Napakiak, AK Map & Demographics
Napakiak Map
Napakiak Overview
$9,481
PER CAPITA INCOME
$23,690
AVG FAMILY INCOME
$23,889
AVG HOUSEHOLD INCOME
2.5%
WAGE / INCOME GAP [ % ]
97.5¢/ $1
WAGE / INCOME GAP [ $ ]
0.53
INEQUALITY / GINI INDEX
692
TOTAL POPULATION
343
MALE POPULATION
349
FEMALE POPULATION
98.28
MALES / 100 FEMALES
101.75
FEMALES / 100 MALES
23.0
MEDIAN AGE
4.4
AVG FAMILY SIZE
3.9
AVG HOUSEHOLD SIZE
193
LABOR FORCE [ PEOPLE ]
46.0%
PERCENT IN LABOR FORCE
38.9%
UNEMPLOYMENT RATE
Napakiak Zip Codes
Napakiak Area Codes
Income in Napakiak
Income Overview in Napakiak
Per Capita Income in Napakiak is $9,481, while median incomes of families and households are $23,690 and $23,889 respectively.
| Characteristic | Number | Measure |
| Per Capita Income | 692 | $9,481 |
| Median Family Income | 144 | $23,690 |
| Mean Family Income | 144 | $40,298 |
| Median Household Income | 178 | $23,889 |
| Mean Household Income | 178 | $39,087 |
| Income Deficit | 144 | $0 |
| Wage / Income Gap (%) | 692 | 2.46% |
| Wage / Income Gap ($) | 692 | 97.54¢ per $1 |
| Gini / Inequality Index | 692 | 0.53 |
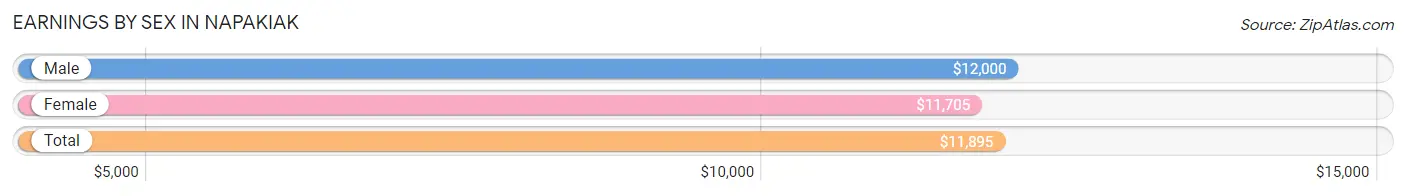
Earnings by Sex in Napakiak
Average Earnings in Napakiak are $11,895, $12,000 for men and $11,705 for women, a difference of 2.5%.
| Sex | Number | Average Earnings |
| Male | 124 (61.7%) | $12,000 |
| Female | 77 (38.3%) | $11,705 |
| Total | 201 (100.0%) | $11,895 |
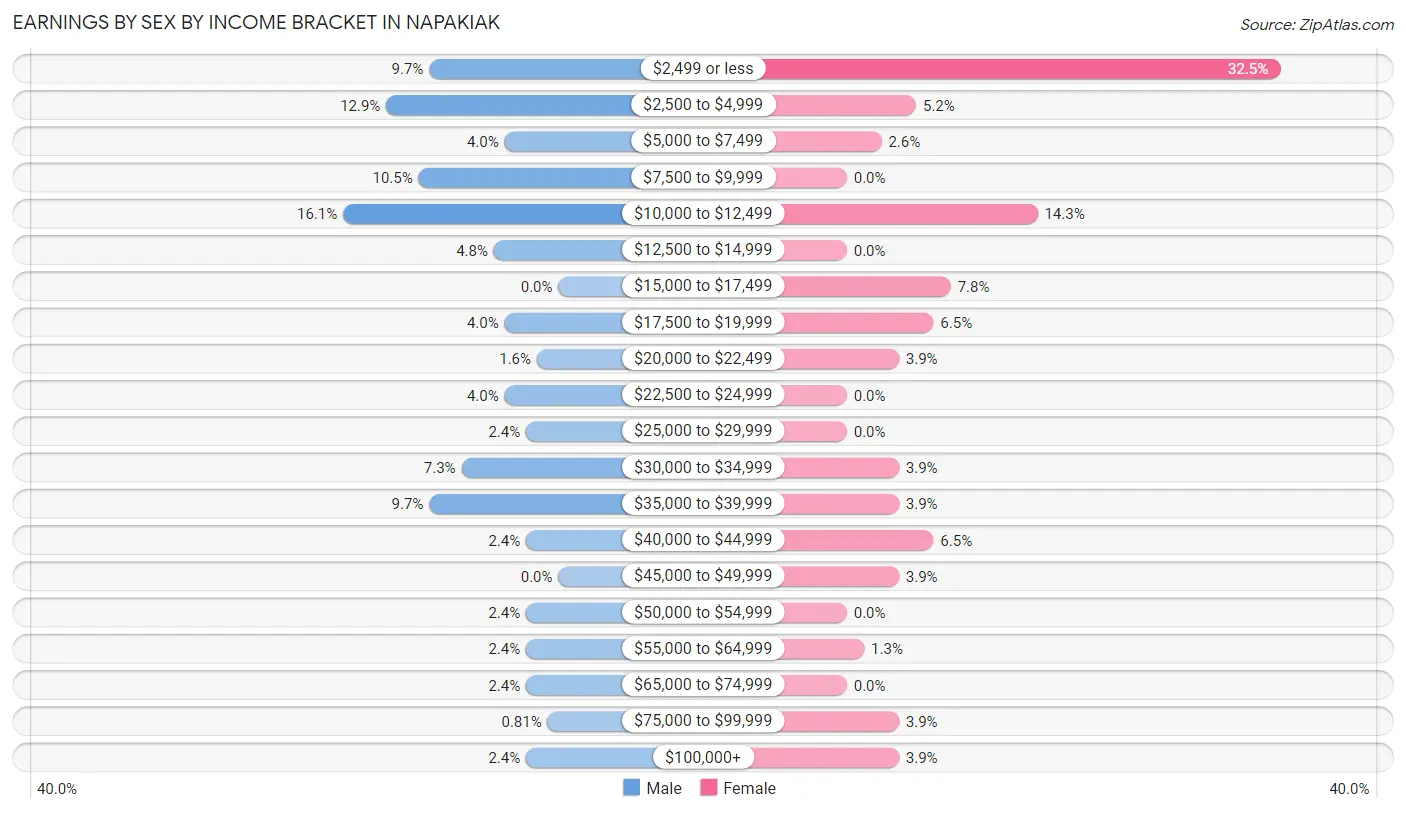
Earnings by Sex by Income Bracket in Napakiak
The most common earnings brackets in Napakiak are $10,000 to $12,499 for men (20 | 16.1%) and $2,499 or less for women (25 | 32.5%).
| Income | Male | Female |
| $2,499 or less | 12 (9.7%) | 25 (32.5%) |
| $2,500 to $4,999 | 16 (12.9%) | 4 (5.2%) |
| $5,000 to $7,499 | 5 (4.0%) | 2 (2.6%) |
| $7,500 to $9,999 | 13 (10.5%) | 0 (0.0%) |
| $10,000 to $12,499 | 20 (16.1%) | 11 (14.3%) |
| $12,500 to $14,999 | 6 (4.8%) | 0 (0.0%) |
| $15,000 to $17,499 | 0 (0.0%) | 6 (7.8%) |
| $17,500 to $19,999 | 5 (4.0%) | 5 (6.5%) |
| $20,000 to $22,499 | 2 (1.6%) | 3 (3.9%) |
| $22,500 to $24,999 | 5 (4.0%) | 0 (0.0%) |
| $25,000 to $29,999 | 3 (2.4%) | 0 (0.0%) |
| $30,000 to $34,999 | 9 (7.3%) | 3 (3.9%) |
| $35,000 to $39,999 | 12 (9.7%) | 3 (3.9%) |
| $40,000 to $44,999 | 3 (2.4%) | 5 (6.5%) |
| $45,000 to $49,999 | 0 (0.0%) | 3 (3.9%) |
| $50,000 to $54,999 | 3 (2.4%) | 0 (0.0%) |
| $55,000 to $64,999 | 3 (2.4%) | 1 (1.3%) |
| $65,000 to $74,999 | 3 (2.4%) | 0 (0.0%) |
| $75,000 to $99,999 | 1 (0.8%) | 3 (3.9%) |
| $100,000+ | 3 (2.4%) | 3 (3.9%) |
| Total | 124 (100.0%) | 77 (100.0%) |
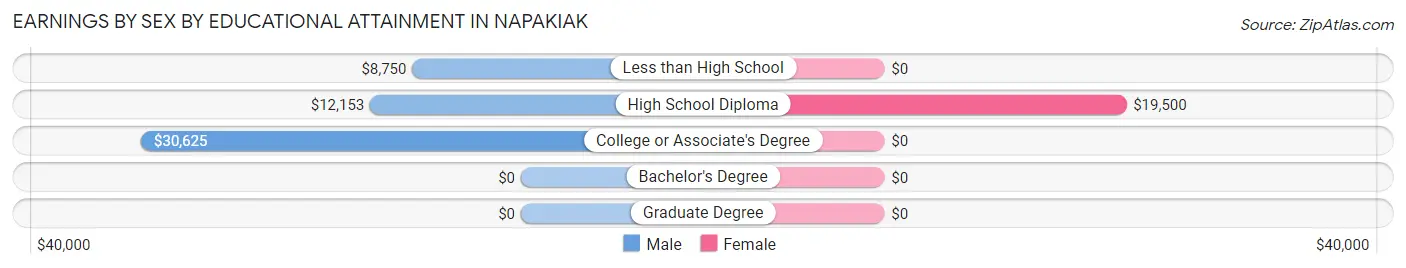
Earnings by Sex by Educational Attainment in Napakiak
Average earnings in Napakiak are $13,125 for men and $19,500 for women, a difference of 32.7%. Men with an educational attainment of college or associate's degree enjoy the highest average annual earnings of $30,625, while those with less than high school education earn the least with $8,750. Women with an educational attainment of high school diploma earn the most with the average annual earnings of $19,500, while those with high school diploma education have the smallest earnings of $19,500.
| Educational Attainment | Male Income | Female Income |
| Less than High School | $8,750 | $0 |
| High School Diploma | $12,153 | $19,500 |
| College or Associate's Degree | $30,625 | $0 |
| Bachelor's Degree | - | - |
| Graduate Degree | - | - |
| Total | $13,125 | $19,500 |
Family Income in Napakiak
Family Income Brackets in Napakiak
According to the Napakiak family income data, there are 44 families falling into the less than $10,000 income range, which is the most common income bracket and makes up 30.6% of all families.
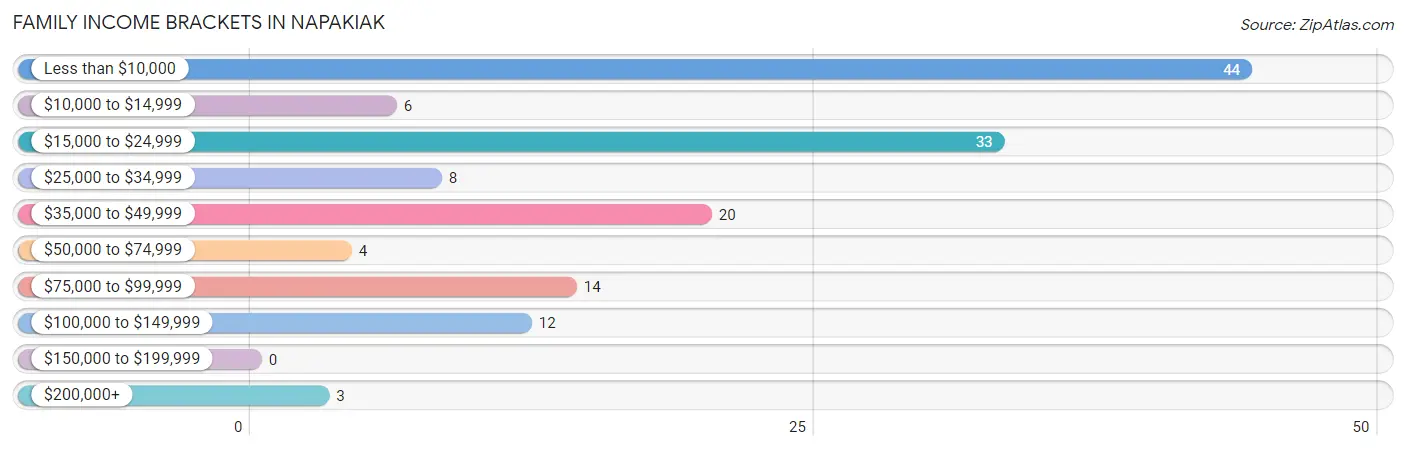
| Income Bracket | # Families | % Families |
| Less than $10,000 | 44 | 30.6% |
| $10,000 to $14,999 | 6 | 4.2% |
| $15,000 to $24,999 | 33 | 22.9% |
| $25,000 to $34,999 | 8 | 5.6% |
| $35,000 to $49,999 | 20 | 13.9% |
| $50,000 to $74,999 | 4 | 2.8% |
| $75,000 to $99,999 | 14 | 9.7% |
| $100,000 to $149,999 | 12 | 8.3% |
| $150,000 to $199,999 | 0 | 0.0% |
| $200,000+ | 3 | 2.1% |
Family Income by Famaliy Size in Napakiak
6-person families (11 | 7.6%) account for the highest median family income in Napakiak with $92,917 per family, while 6-person families (11 | 7.6%) have the highest median income of $15,486 per family member.
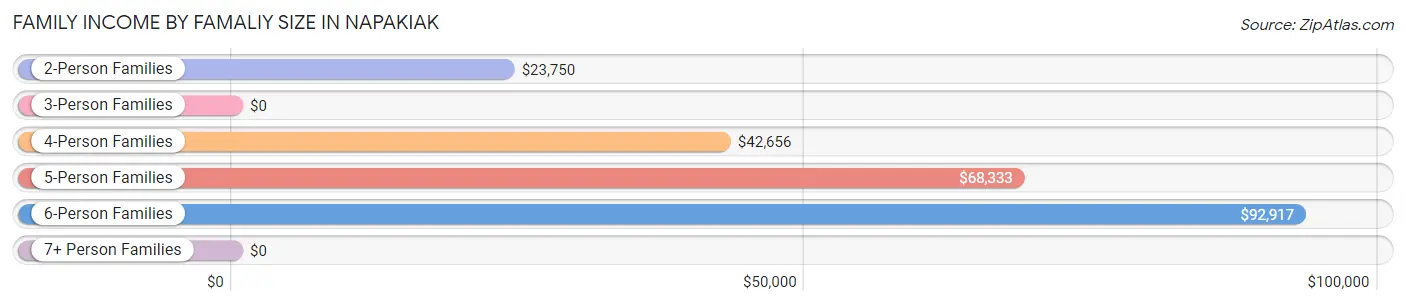
| Income Bracket | # Families | Median Income |
| 2-Person Families | 33 (22.9%) | $23,750 |
| 3-Person Families | 10 (6.9%) | $0 |
| 4-Person Families | 23 (16.0%) | $42,656 |
| 5-Person Families | 16 (11.1%) | $68,333 |
| 6-Person Families | 11 (7.6%) | $92,917 |
| 7+ Person Families | 51 (35.4%) | $0 |
| Total | 144 (100.0%) | $23,690 |
Family Income by Number of Earners in Napakiak
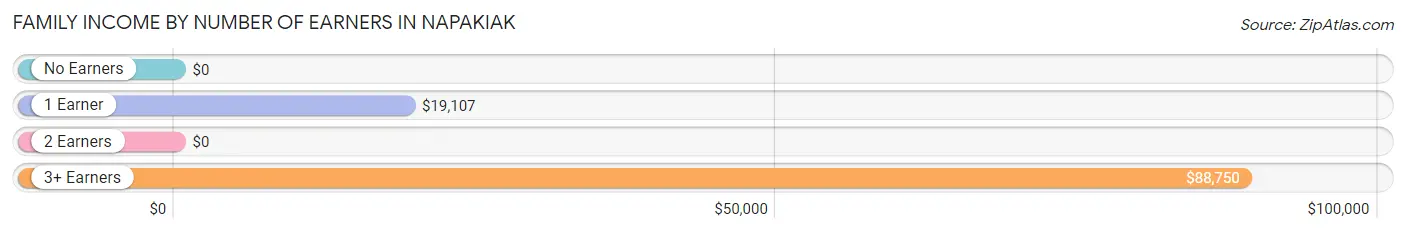
| Number of Earners | # Families | Median Income |
| No Earners | 17 (11.8%) | $0 |
| 1 Earner | 89 (61.8%) | $19,107 |
| 2 Earners | 24 (16.7%) | $0 |
| 3+ Earners | 14 (9.7%) | $88,750 |
| Total | 144 (100.0%) | $23,690 |
Household Income in Napakiak
Household Income Brackets in Napakiak
With 45 households falling in the category, the less than $10,000 income range is the most frequent in Napakiak, accounting for 25.3% of all households.
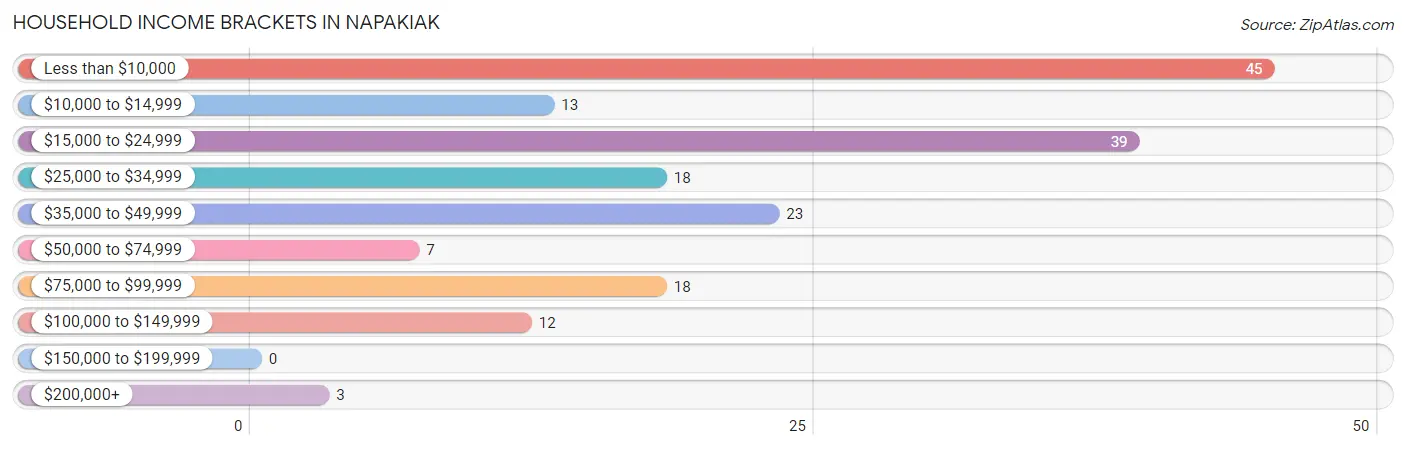
| Income Bracket | # Households | % Households |
| Less than $10,000 | 45 | 25.3% |
| $10,000 to $14,999 | 13 | 7.3% |
| $15,000 to $24,999 | 39 | 21.9% |
| $25,000 to $34,999 | 18 | 10.1% |
| $35,000 to $49,999 | 23 | 12.9% |
| $50,000 to $74,999 | 7 | 3.9% |
| $75,000 to $99,999 | 18 | 10.1% |
| $100,000 to $149,999 | 12 | 6.7% |
| $150,000 to $199,999 | 0 | 0.0% |
| $200,000+ | 3 | 1.7% |
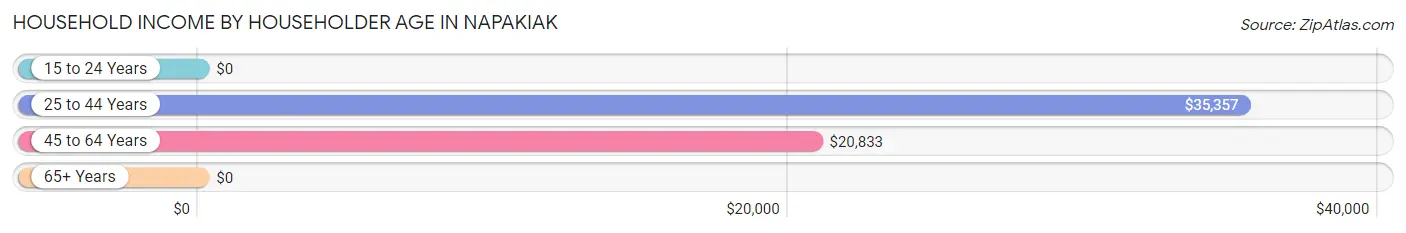
Household Income by Householder Age in Napakiak
The median household income in Napakiak is $23,889, with the highest median household income of $35,357 found in the 25 to 44 years age bracket for the primary householder. A total of 44 households (24.7%) fall into this category. Meanwhile, the 15 to 24 years age bracket for the primary householder has the lowest median household income of $0, with 3 households (1.7%) in this group.
| Income Bracket | # Households | Median Income |
| 15 to 24 Years | 3 (1.7%) | $0 |
| 25 to 44 Years | 44 (24.7%) | $35,357 |
| 45 to 64 Years | 102 (57.3%) | $20,833 |
| 65+ Years | 29 (16.3%) | $0 |
| Total | 178 (100.0%) | $23,889 |
Poverty in Napakiak
Income Below Poverty by Sex and Age in Napakiak
With 59.8% poverty level for males and 58.5% for females among the residents of Napakiak, 16 and 17 year old males and 15 year old females are the most vulnerable to poverty, with 3 males (100.0%) and 26 females (89.7%) in their respective age groups living below the poverty level.
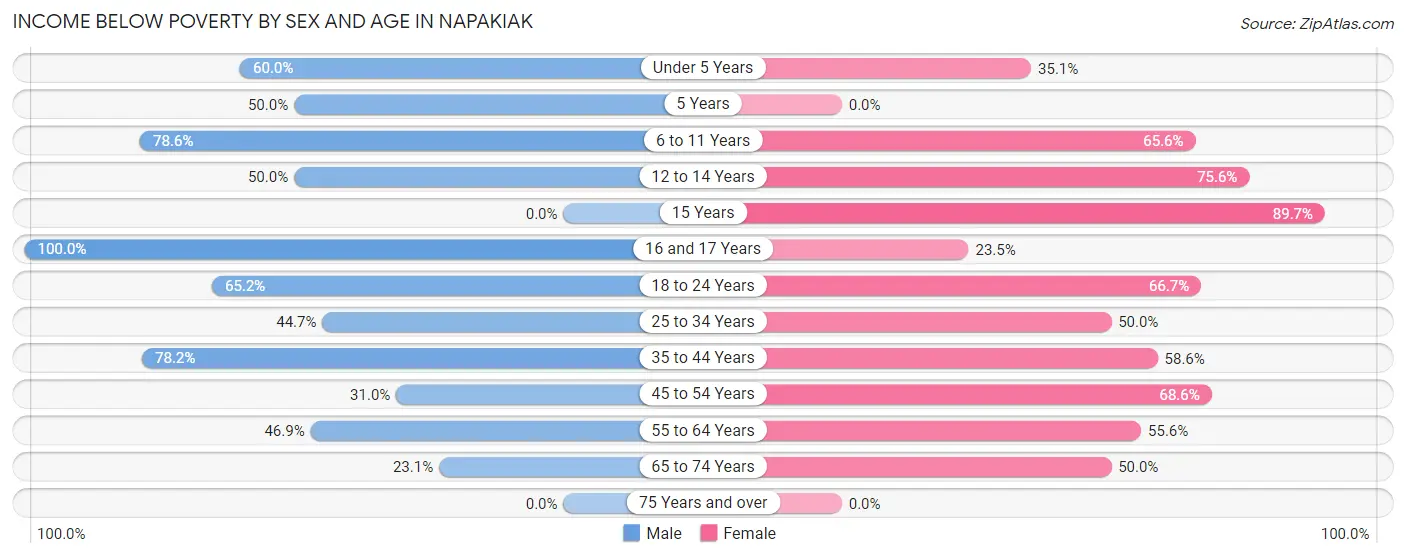
| Age Bracket | Male | Female |
| Under 5 Years | 18 (60.0%) | 13 (35.1%) |
| 5 Years | 3 (50.0%) | 0 (0.0%) |
| 6 to 11 Years | 66 (78.6%) | 21 (65.6%) |
| 12 to 14 Years | 5 (50.0%) | 31 (75.6%) |
| 15 Years | 0 (0.0%) | 26 (89.7%) |
| 16 and 17 Years | 3 (100.0%) | 4 (23.5%) |
| 18 to 24 Years | 15 (65.2%) | 22 (66.7%) |
| 25 to 34 Years | 17 (44.7%) | 17 (50.0%) |
| 35 to 44 Years | 43 (78.2%) | 17 (58.6%) |
| 45 to 54 Years | 9 (31.0%) | 35 (68.6%) |
| 55 to 64 Years | 23 (46.9%) | 10 (55.6%) |
| 65 to 74 Years | 3 (23.1%) | 8 (50.0%) |
| 75 Years and over | 0 (0.0%) | 0 (0.0%) |
| Total | 205 (59.8%) | 204 (58.5%) |
Income Above Poverty by Sex and Age in Napakiak
According to the poverty statistics in Napakiak, males aged 15 years and females aged 75 years and over are the age groups that are most secure financially, with 100.0% of males and 100.0% of females in these age groups living above the poverty line.
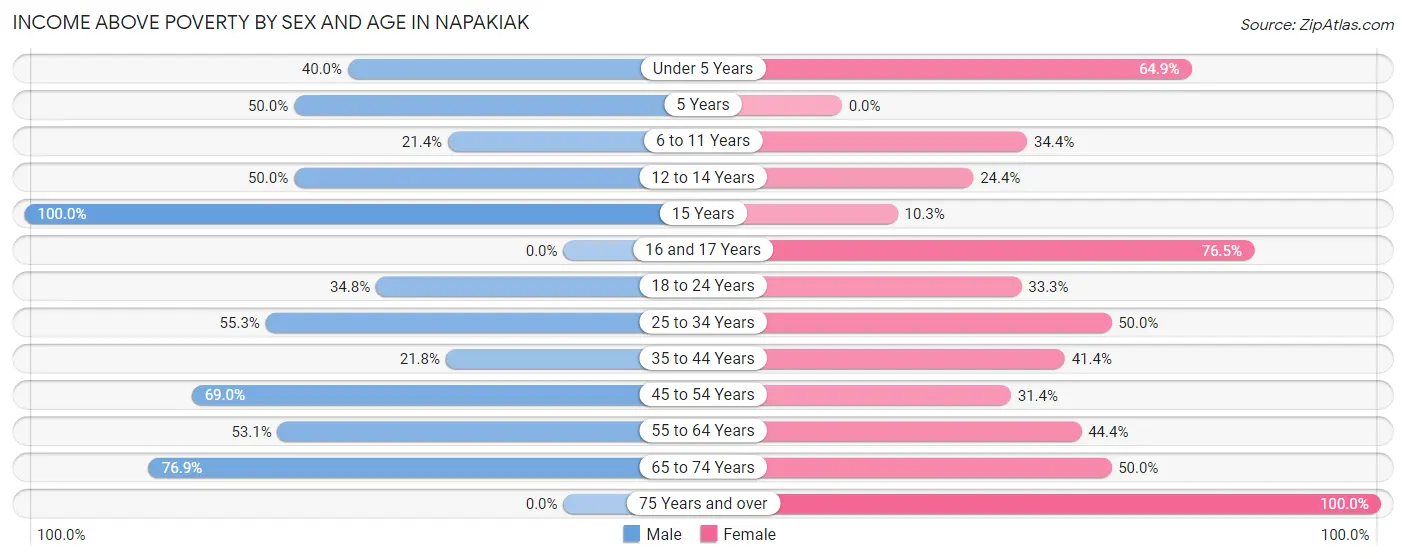
| Age Bracket | Male | Female |
| Under 5 Years | 12 (40.0%) | 24 (64.9%) |
| 5 Years | 3 (50.0%) | 0 (0.0%) |
| 6 to 11 Years | 18 (21.4%) | 11 (34.4%) |
| 12 to 14 Years | 5 (50.0%) | 10 (24.4%) |
| 15 Years | 3 (100.0%) | 3 (10.3%) |
| 16 and 17 Years | 0 (0.0%) | 13 (76.5%) |
| 18 to 24 Years | 8 (34.8%) | 11 (33.3%) |
| 25 to 34 Years | 21 (55.3%) | 17 (50.0%) |
| 35 to 44 Years | 12 (21.8%) | 12 (41.4%) |
| 45 to 54 Years | 20 (69.0%) | 16 (31.4%) |
| 55 to 64 Years | 26 (53.1%) | 8 (44.4%) |
| 65 to 74 Years | 10 (76.9%) | 8 (50.0%) |
| 75 Years and over | 0 (0.0%) | 12 (100.0%) |
| Total | 138 (40.2%) | 145 (41.5%) |
Income Below Poverty Among Married-Couple Families in Napakiak
The poverty statistics for married-couple families in Napakiak show that 46.4% or 39 of the total 84 families live below the poverty line. Families with 5 or more children have the highest poverty rate of 100.0%, comprising of 14 families. On the other hand, families with 1 or 2 children have the lowest poverty rate of 20.8%, which includes 5 families.
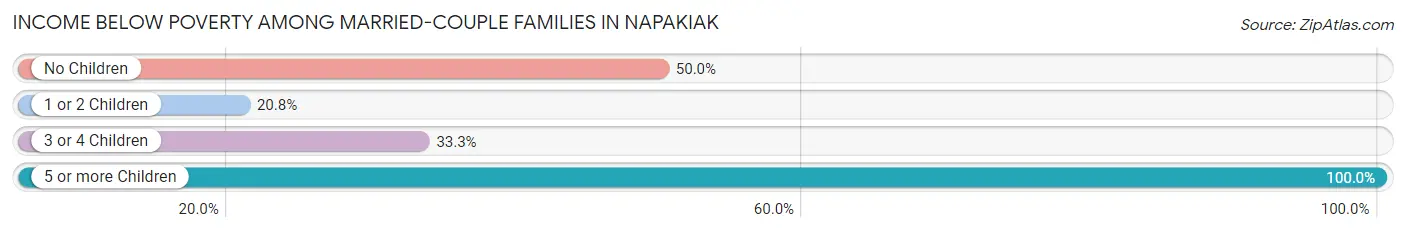
| Children | Above Poverty | Below Poverty |
| No Children | 14 (50.0%) | 14 (50.0%) |
| 1 or 2 Children | 19 (79.2%) | 5 (20.8%) |
| 3 or 4 Children | 12 (66.7%) | 6 (33.3%) |
| 5 or more Children | 0 (0.0%) | 14 (100.0%) |
| Total | 45 (53.6%) | 39 (46.4%) |
Income Below Poverty Among Single-Parent Households in Napakiak
According to the poverty data in Napakiak, 57.1% or 4 single-father households and 73.6% or 39 single-mother households are living below the poverty line. Among single-father households, those with 3 or 4 children have the highest poverty rate, with 2 households (100.0%) experiencing poverty. Likewise, among single-mother households, those with 3 or 4 children have the highest poverty rate, with 29 households (100.0%) falling below the poverty line.
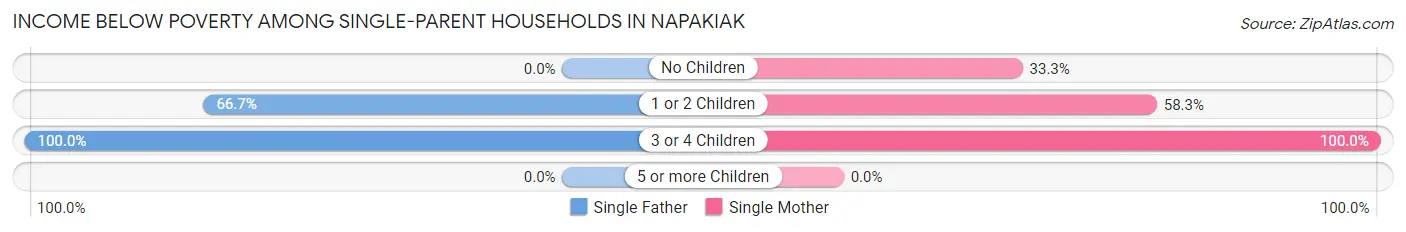
| Children | Single Father | Single Mother |
| No Children | 0 (0.0%) | 3 (33.3%) |
| 1 or 2 Children | 2 (66.7%) | 7 (58.3%) |
| 3 or 4 Children | 2 (100.0%) | 29 (100.0%) |
| 5 or more Children | 0 (0.0%) | 0 (0.0%) |
| Total | 4 (57.1%) | 39 (73.6%) |
Income Below Poverty Among Married-Couple vs Single-Parent Households in Napakiak
The poverty data for Napakiak shows that 39 of the married-couple family households (46.4%) and 43 of the single-parent households (71.7%) are living below the poverty level. Within the married-couple family households, those with 5 or more children have the highest poverty rate, with 14 households (100.0%) falling below the poverty line. Among the single-parent households, those with 3 or 4 children have the highest poverty rate, with 31 household (100.0%) living below poverty.
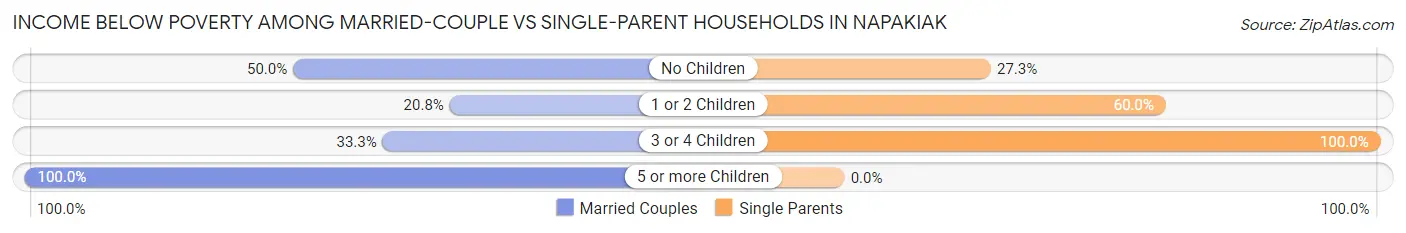
| Children | Married-Couple Families | Single-Parent Households |
| No Children | 14 (50.0%) | 3 (27.3%) |
| 1 or 2 Children | 5 (20.8%) | 9 (60.0%) |
| 3 or 4 Children | 6 (33.3%) | 31 (100.0%) |
| 5 or more Children | 14 (100.0%) | 0 (0.0%) |
| Total | 39 (46.4%) | 43 (71.7%) |
Race in Napakiak
The most populous races in Napakiak are Native / Alaskan (686 | 99.1%), White / Caucasian (3 | 0.4%), and Two or more Races (3 | 0.4%).
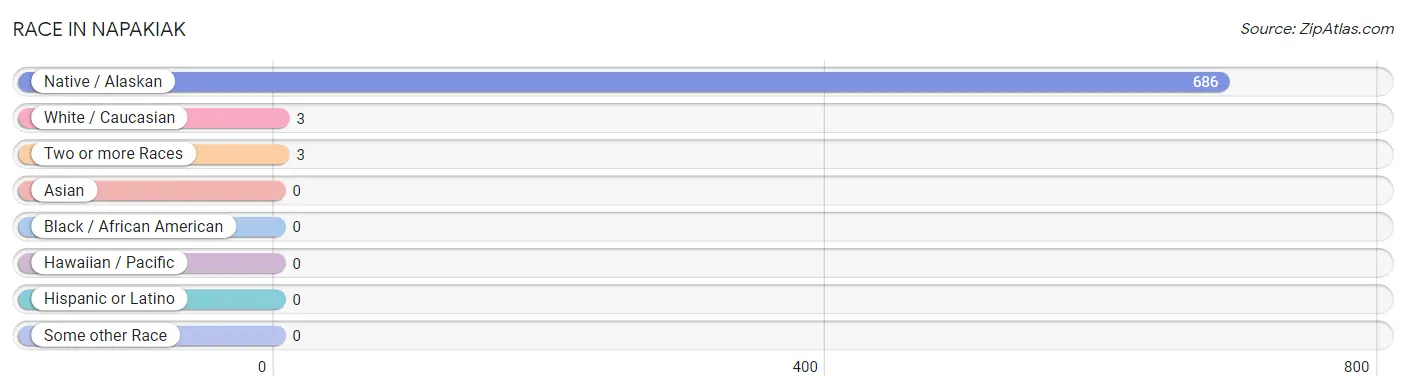
| Race | # Population | % Population |
| Asian | 0 | 0.0% |
| Black / African American | 0 | 0.0% |
| Hawaiian / Pacific | 0 | 0.0% |
| Hispanic or Latino | 0 | 0.0% |
| Native / Alaskan | 686 | 99.1% |
| White / Caucasian | 3 | 0.4% |
| Two or more Races | 3 | 0.4% |
| Some other Race | 0 | 0.0% |
| Total | 692 | 100.0% |
Ancestry in Napakiak
The most populous ancestries reported in Napakiak are Yup'ik (498 | 72.0%), Inupiat (181 | 26.2%), Alaska Native (7 | 1.0%), Paiute (6 | 0.9%), and Apache (3 | 0.4%), together accounting for 100.4% of all Napakiak residents.
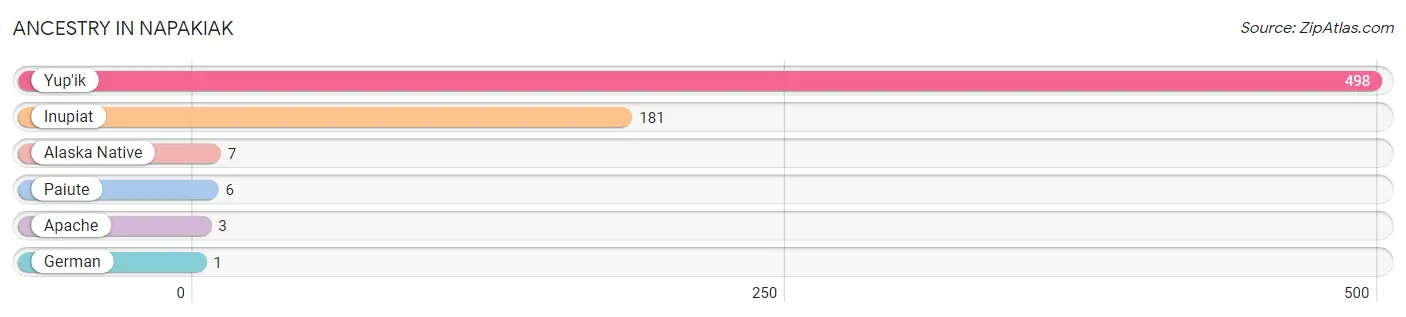
| Ancestry | # Population | % Population |
| Alaska Native | 7 | 1.0% |
| Apache | 3 | 0.4% |
| German | 1 | 0.1% |
| Inupiat | 181 | 26.2% |
| Paiute | 6 | 0.9% |
| Yup'ik | 498 | 72.0% | View All 6 Rows |
Immigrants in Napakiak

| Immigration Origin | # Population | % Population | View All 0 Rows |
Sex and Age in Napakiak
Sex and Age in Napakiak
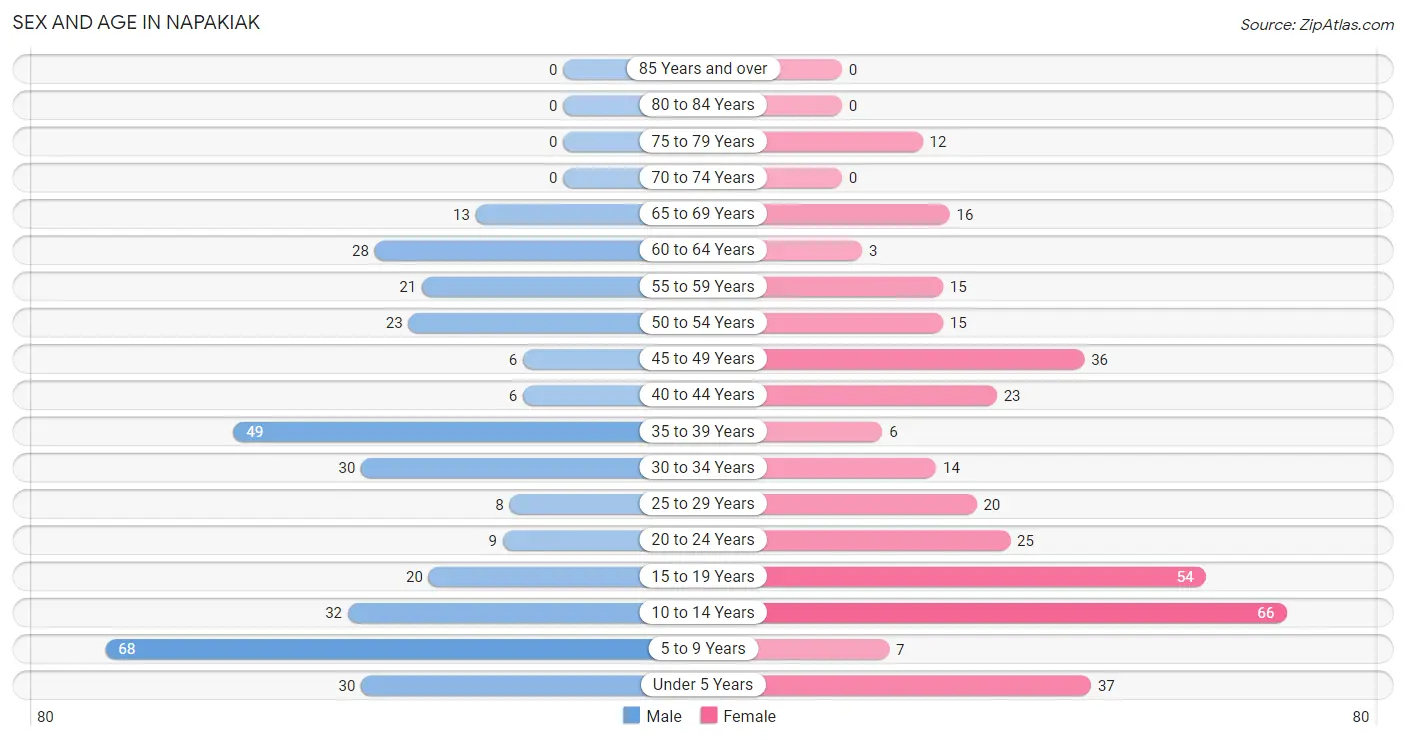
The most populous age groups in Napakiak are 5 to 9 Years (68 | 19.8%) for men and 10 to 14 Years (66 | 18.9%) for women.
| Age Bracket | Male | Female |
| Under 5 Years | 30 (8.7%) | 37 (10.6%) |
| 5 to 9 Years | 68 (19.8%) | 7 (2.0%) |
| 10 to 14 Years | 32 (9.3%) | 66 (18.9%) |
| 15 to 19 Years | 20 (5.8%) | 54 (15.5%) |
| 20 to 24 Years | 9 (2.6%) | 25 (7.2%) |
| 25 to 29 Years | 8 (2.3%) | 20 (5.7%) |
| 30 to 34 Years | 30 (8.7%) | 14 (4.0%) |
| 35 to 39 Years | 49 (14.3%) | 6 (1.7%) |
| 40 to 44 Years | 6 (1.8%) | 23 (6.6%) |
| 45 to 49 Years | 6 (1.8%) | 36 (10.3%) |
| 50 to 54 Years | 23 (6.7%) | 15 (4.3%) |
| 55 to 59 Years | 21 (6.1%) | 15 (4.3%) |
| 60 to 64 Years | 28 (8.2%) | 3 (0.9%) |
| 65 to 69 Years | 13 (3.8%) | 16 (4.6%) |
| 70 to 74 Years | 0 (0.0%) | 0 (0.0%) |
| 75 to 79 Years | 0 (0.0%) | 12 (3.4%) |
| 80 to 84 Years | 0 (0.0%) | 0 (0.0%) |
| 85 Years and over | 0 (0.0%) | 0 (0.0%) |
| Total | 343 (100.0%) | 349 (100.0%) |
Families and Households in Napakiak
Median Family Size in Napakiak
The median family size in Napakiak is 4.39 persons per family, with single male/father families (7 | 4.9%) accounting for the largest median family size of 7.43 persons per family. On the other hand, married-couple families (84 | 58.3%) represent the smallest median family size with 3.87 persons per family.
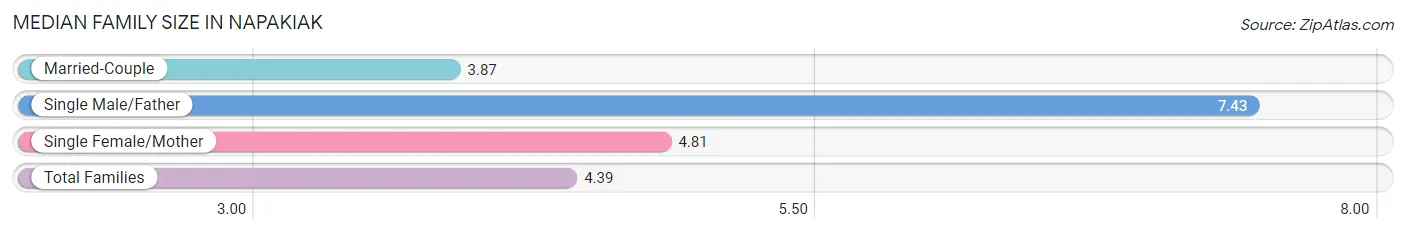
| Family Type | # Families | Family Size |
| Married-Couple | 84 (58.3%) | 3.87 |
| Single Male/Father | 7 (4.9%) | 7.43 |
| Single Female/Mother | 53 (36.8%) | 4.81 |
| Total Families | 144 (100.0%) | 4.39 |
Median Household Size in Napakiak
The median household size in Napakiak is 3.89 persons per household, with single male/father households (7 | 3.9%) accounting for the largest median household size of 8.29 persons per household. non-family households (34 | 19.1%) represent the smallest median household size with 1.12 persons per household.
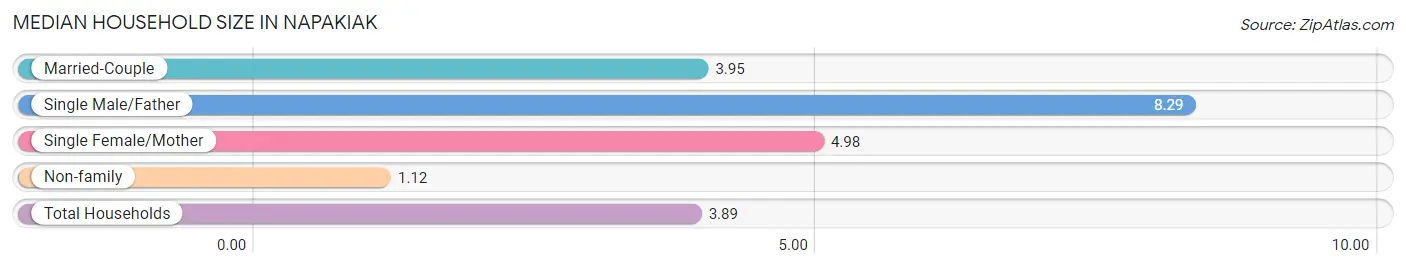
| Household Type | # Households | Household Size |
| Married-Couple | 84 (47.2%) | 3.95 |
| Single Male/Father | 7 (3.9%) | 8.29 |
| Single Female/Mother | 53 (29.8%) | 4.98 |
| Non-family | 34 (19.1%) | 1.12 |
| Total Households | 178 (100.0%) | 3.89 |
Household Size by Marriage Status in Napakiak
Out of a total of 178 households in Napakiak, 144 (80.9%) are family households, while 34 (19.1%) are nonfamily households. The most numerous type of family households are 7+ person households, comprising 56, and the most common type of nonfamily households are 1-person households, comprising 30.
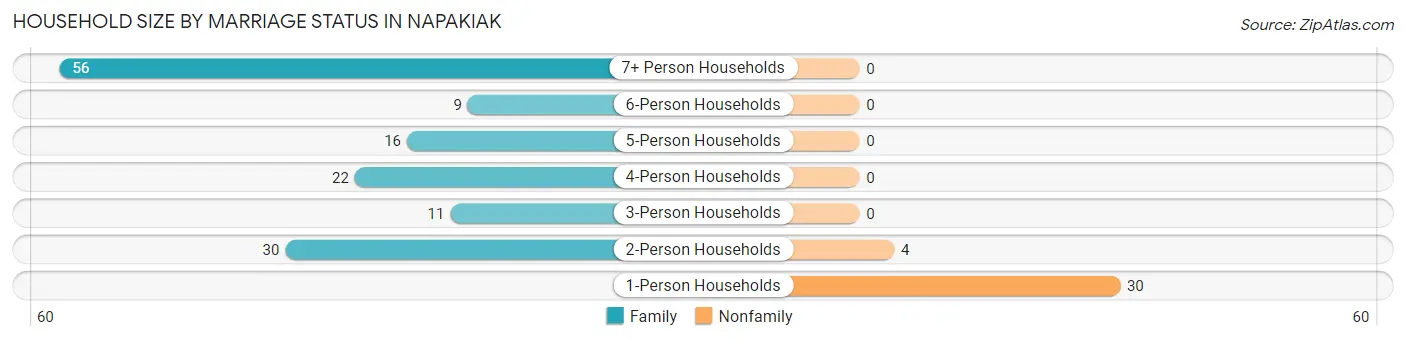
| Household Size | Family Households | Nonfamily Households |
| 1-Person Households | - | 30 (16.9%) |
| 2-Person Households | 30 (16.9%) | 4 (2.2%) |
| 3-Person Households | 11 (6.2%) | 0 (0.0%) |
| 4-Person Households | 22 (12.4%) | 0 (0.0%) |
| 5-Person Households | 16 (9.0%) | 0 (0.0%) |
| 6-Person Households | 9 (5.1%) | 0 (0.0%) |
| 7+ Person Households | 56 (31.5%) | 0 (0.0%) |
| Total | 144 (80.9%) | 34 (19.1%) |
Female Fertility in Napakiak
Fertility by Age in Napakiak
Average fertility rate in Napakiak is 33.0 births per 1,000 women. Women in the age bracket of 35 to 50 years have the highest fertility rate with 88.0 births per 1,000 women. Women in the age bracket of 35 to 50 years acount for 100.0% of all women with births.
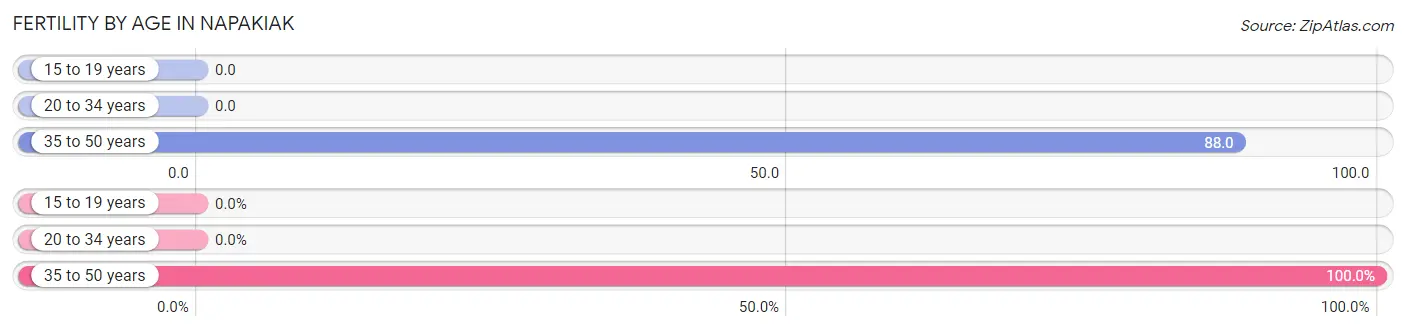
| Age Bracket | Women with Births | Births / 1,000 Women |
| 15 to 19 years | 0 (0.0%) | 0.0 |
| 20 to 34 years | 0 (0.0%) | 0.0 |
| 35 to 50 years | 6 (100.0%) | 88.0 |
| Total | 6 (100.0%) | 33.0 |
Fertility by Age by Marriage Status in Napakiak
50.0% of women with births (6) in Napakiak are married. The highest percentage of unmarried women with births falls into 35 to 50 years age bracket with 50.0% of them unmarried at the time of birth, while the lowest percentage of unmarried women with births belong to 35 to 50 years age bracket with 50.0% of them unmarried.
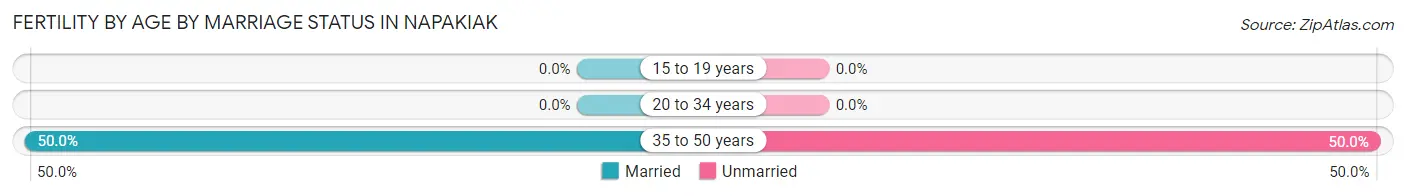
| Age Bracket | Married | Unmarried |
| 15 to 19 years | 0 (0.0%) | 0 (0.0%) |
| 20 to 34 years | 0 (0.0%) | 0 (0.0%) |
| 35 to 50 years | 3 (50.0%) | 3 (50.0%) |
| Total | 3 (50.0%) | 3 (50.0%) |
Fertility by Education in Napakiak
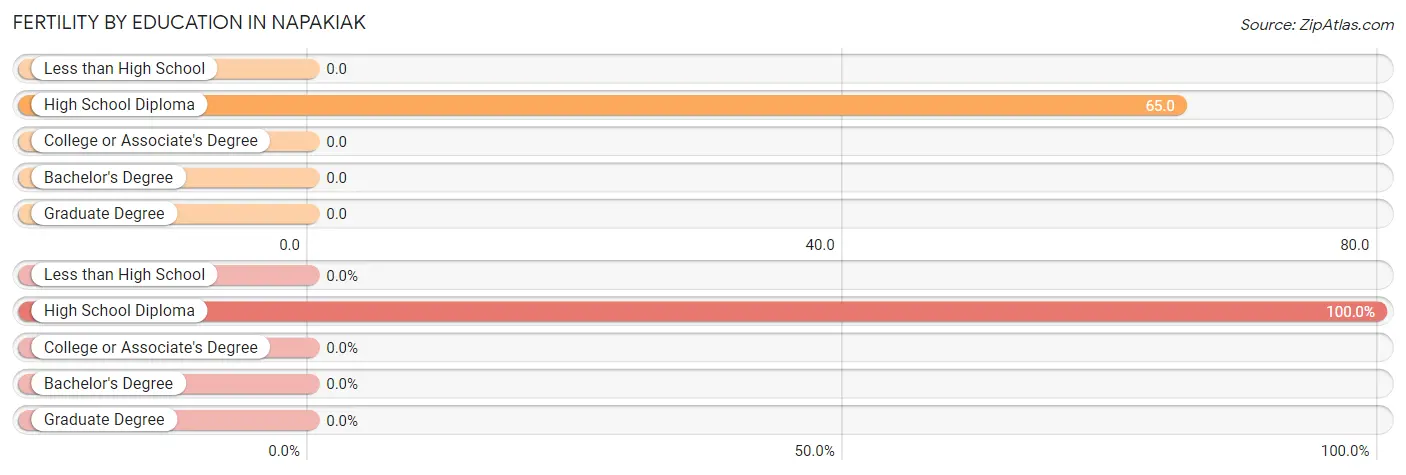
| Educational Attainment | Women with Births | Births / 1,000 Women |
| Less than High School | 0 (0.0%) | 0.0 |
| High School Diploma | 6 (100.0%) | 65.0 |
| College or Associate's Degree | 0 (0.0%) | 0.0 |
| Bachelor's Degree | 0 (0.0%) | 0.0 |
| Graduate Degree | 0 (0.0%) | 0.0 |
| Total | 6 (100.0%) | 33.0 |
Fertility by Education by Marriage Status in Napakiak
50.0% of women with births in Napakiak are unmarried. Women with the educational attainment of high school diploma are most likely to be married with 50.0% of them married at childbirth, while women with the educational attainment of high school diploma are least likely to be married with 50.0% of them unmarried at childbirth.
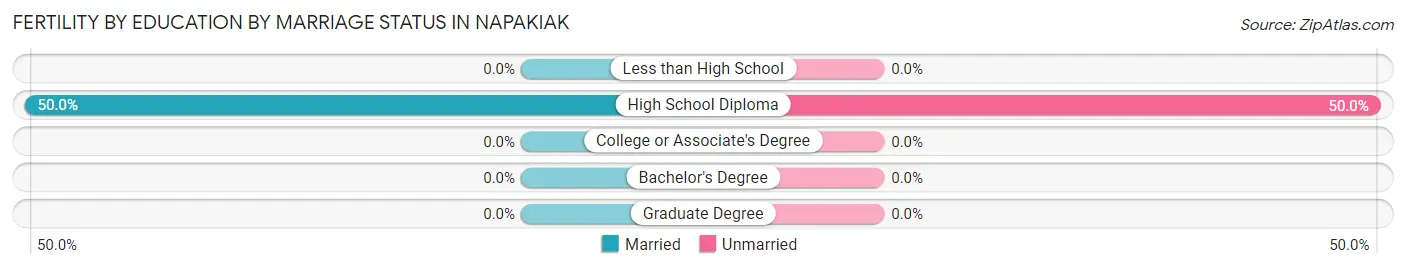
| Educational Attainment | Married | Unmarried |
| Less than High School | 0 (0.0%) | 0 (0.0%) |
| High School Diploma | 3 (50.0%) | 3 (50.0%) |
| College or Associate's Degree | 0 (0.0%) | 0 (0.0%) |
| Bachelor's Degree | 0 (0.0%) | 0 (0.0%) |
| Graduate Degree | 0 (0.0%) | 0 (0.0%) |
| Total | 3 (50.0%) | 3 (50.0%) |
Employment Characteristics in Napakiak
Employment by Class of Employer in Napakiak
Among the 110 employed individuals in Napakiak, local government employees (42 | 38.2%), state government employees (25 | 22.7%), and not-for-profit organizations (22 | 20.0%) make up the most common classes of employment.
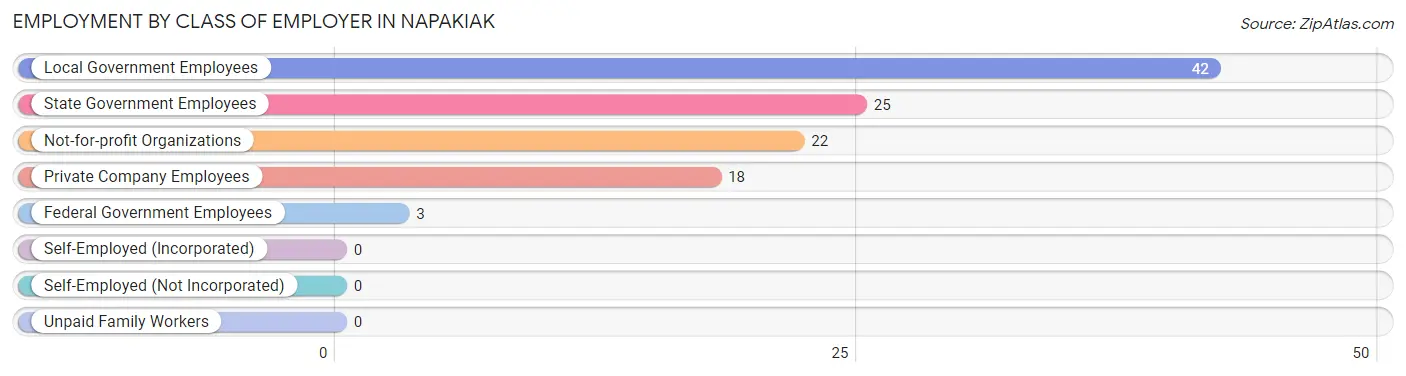
| Employer Class | # Employees | % Employees |
| Private Company Employees | 18 | 16.4% |
| Self-Employed (Incorporated) | 0 | 0.0% |
| Self-Employed (Not Incorporated) | 0 | 0.0% |
| Not-for-profit Organizations | 22 | 20.0% |
| Local Government Employees | 42 | 38.2% |
| State Government Employees | 25 | 22.7% |
| Federal Government Employees | 3 | 2.7% |
| Unpaid Family Workers | 0 | 0.0% |
| Total | 110 | 100.0% |
Employment Status by Age in Napakiak
According to the labor force statistics for Napakiak, out of the total population over 16 years of age (420), 46.0% or 193 individuals are in the labor force, with 38.9% or 75 of them unemployed. The age group with the highest labor force participation rate is 30 to 34 years, with 72.7% or 32 individuals in the labor force. Within the labor force, the 35 to 44 years age range has the highest percentage of unemployed individuals, with 69.0% or 40 of them being unemployed.
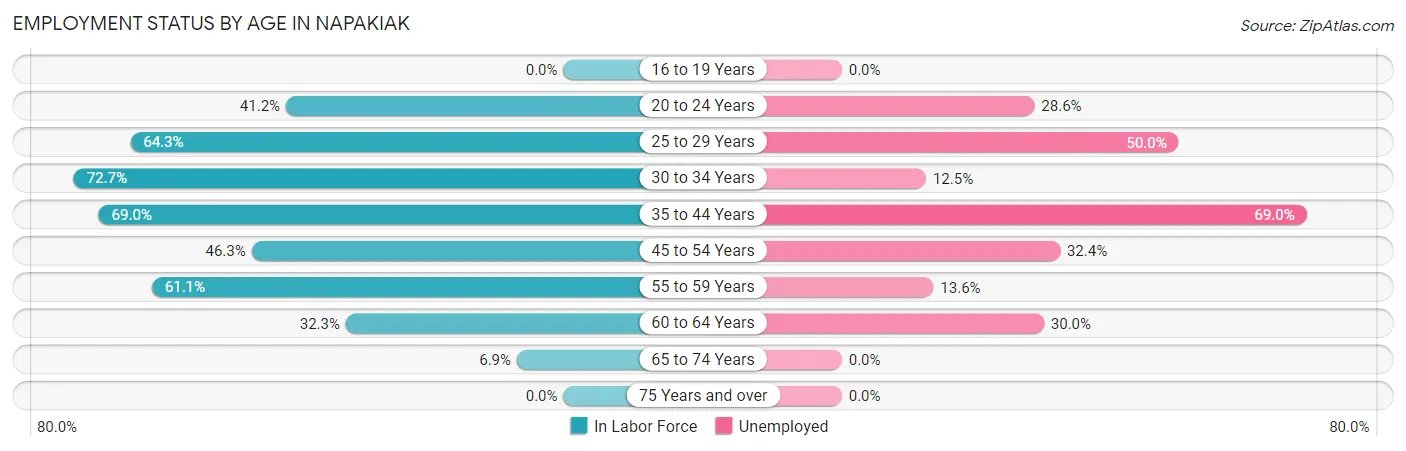
| Age Bracket | In Labor Force | Unemployed |
| 16 to 19 Years | 0 (0.0%) | 0 (0.0%) |
| 20 to 24 Years | 14 (41.2%) | 4 (28.6%) |
| 25 to 29 Years | 18 (64.3%) | 9 (50.0%) |
| 30 to 34 Years | 32 (72.7%) | 4 (12.5%) |
| 35 to 44 Years | 58 (69.0%) | 40 (69.0%) |
| 45 to 54 Years | 37 (46.3%) | 12 (32.4%) |
| 55 to 59 Years | 22 (61.1%) | 3 (13.6%) |
| 60 to 64 Years | 10 (32.3%) | 3 (30.0%) |
| 65 to 74 Years | 2 (6.9%) | 0 (0.0%) |
| 75 Years and over | 0 (0.0%) | 0 (0.0%) |
| Total | 193 (46.0%) | 75 (38.9%) |
Employment Status by Educational Attainment in Napakiak
According to labor force statistics for Napakiak, 58.4% of individuals (177) out of the total population between 25 and 64 years of age (303) are in the labor force, with 40.1% or 71 of them being unemployed. The group with the highest labor force participation rate are those with the educational attainment of college / associate degree, with 73.7% or 28 individuals in the labor force. Within the labor force, individuals with less than high school education have the highest percentage of unemployment, with 56.3% or 9 of them being unemployed.
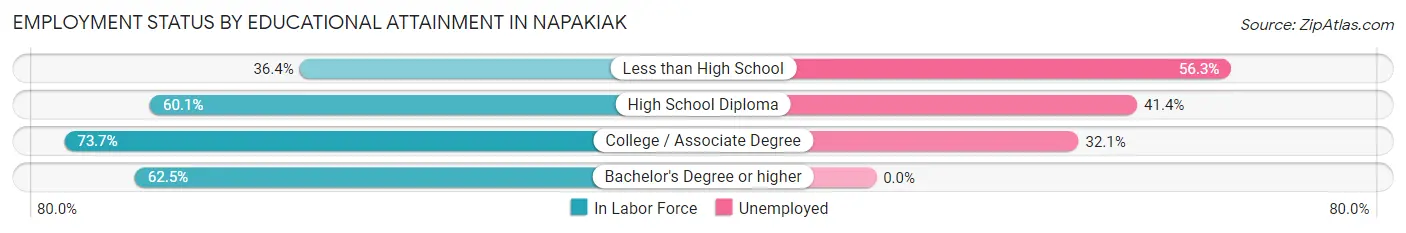
| Educational Attainment | In Labor Force | Unemployed |
| Less than High School | 16 (36.4%) | 25 (56.3%) |
| High School Diploma | 128 (60.1%) | 88 (41.4%) |
| College / Associate Degree | 28 (73.7%) | 12 (32.1%) |
| Bachelor's Degree or higher | 5 (62.5%) | 0 (0.0%) |
| Total | 177 (58.4%) | 122 (40.1%) |
Employment Occupations by Sex in Napakiak
Management, Business, Science and Arts Occupations
The most common Management, Business, Science and Arts occupations in Napakiak are Community & Social Service (14 | 11.9%), Education Instruction & Library (14 | 11.9%), Management (12 | 10.2%), Business & Financial (5 | 4.2%), and Computers, Engineering & Science (3 | 2.5%).
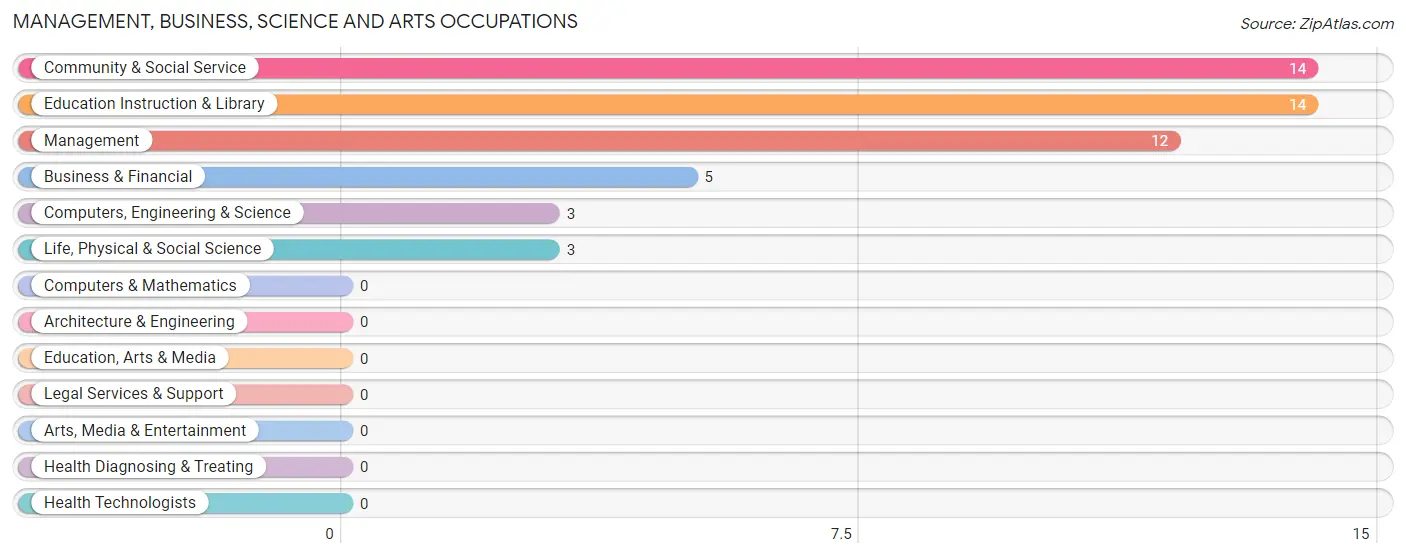
Management, Business, Science and Arts Occupations by Sex
Within the Management, Business, Science and Arts occupations in Napakiak, the most male-oriented occupations are Business & Financial (100.0%), Computers, Engineering & Science (100.0%), and Life, Physical & Social Science (100.0%), while the most female-oriented occupations are Community & Social Service (71.4%), Education Instruction & Library (71.4%), and Management (50.0%).
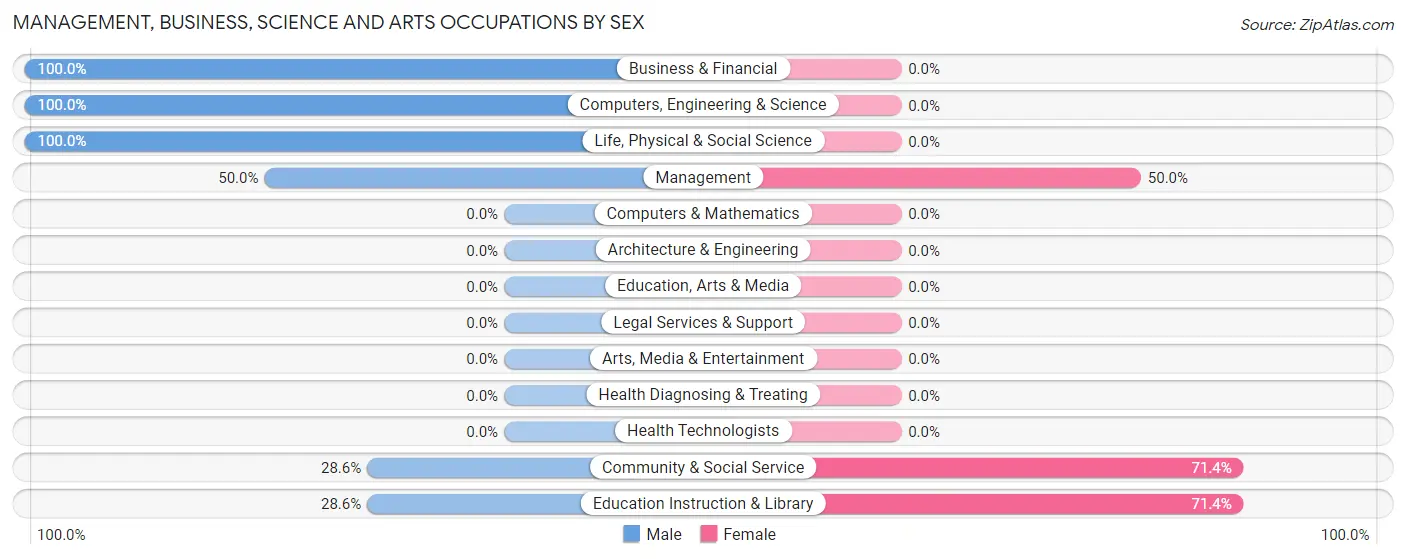
| Occupation | Male | Female |
| Management | 6 (50.0%) | 6 (50.0%) |
| Business & Financial | 5 (100.0%) | 0 (0.0%) |
| Computers, Engineering & Science | 3 (100.0%) | 0 (0.0%) |
| Computers & Mathematics | 0 (0.0%) | 0 (0.0%) |
| Architecture & Engineering | 0 (0.0%) | 0 (0.0%) |
| Life, Physical & Social Science | 3 (100.0%) | 0 (0.0%) |
| Community & Social Service | 4 (28.6%) | 10 (71.4%) |
| Education, Arts & Media | 0 (0.0%) | 0 (0.0%) |
| Legal Services & Support | 0 (0.0%) | 0 (0.0%) |
| Education Instruction & Library | 4 (28.6%) | 10 (71.4%) |
| Arts, Media & Entertainment | 0 (0.0%) | 0 (0.0%) |
| Health Diagnosing & Treating | 0 (0.0%) | 0 (0.0%) |
| Health Technologists | 0 (0.0%) | 0 (0.0%) |
| Total (Category) | 18 (52.9%) | 16 (47.1%) |
| Total (Overall) | 71 (60.2%) | 47 (39.8%) |
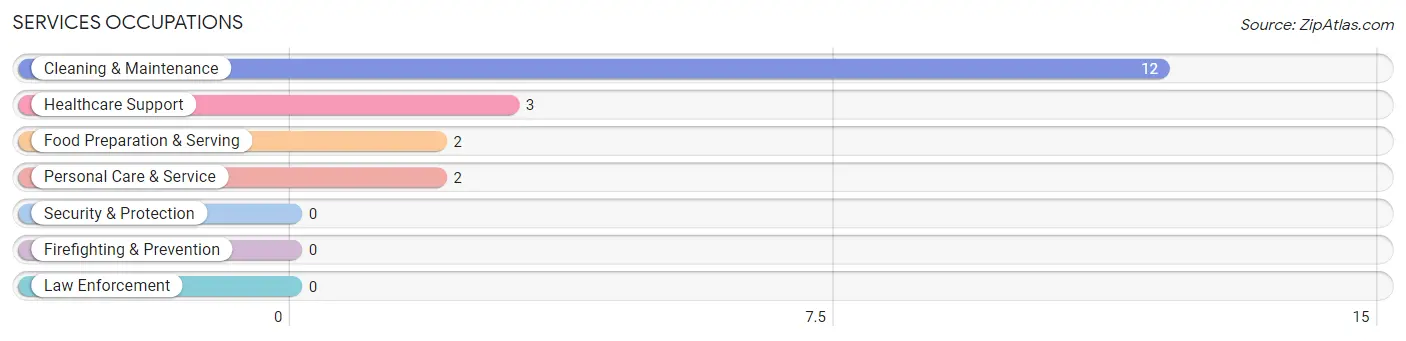
Services Occupations
The most common Services occupations in Napakiak are Cleaning & Maintenance (12 | 10.2%), Healthcare Support (3 | 2.5%), Food Preparation & Serving (2 | 1.7%), and Personal Care & Service (2 | 1.7%).
Services Occupations by Sex
Within the Services occupations in Napakiak, the most male-oriented occupations are Food Preparation & Serving (100.0%), and Cleaning & Maintenance (100.0%), while the most female-oriented occupations are Healthcare Support (100.0%), and Personal Care & Service (100.0%).
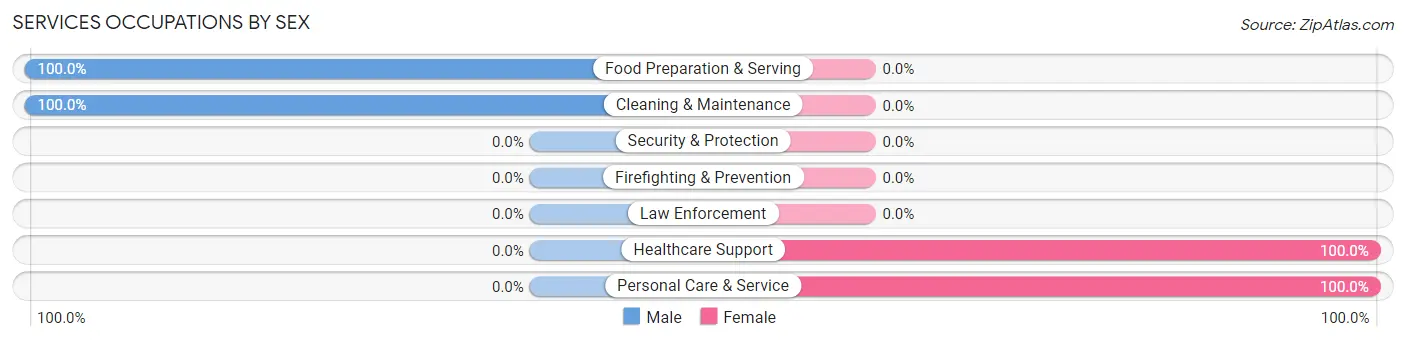
| Occupation | Male | Female |
| Healthcare Support | 0 (0.0%) | 3 (100.0%) |
| Security & Protection | 0 (0.0%) | 0 (0.0%) |
| Firefighting & Prevention | 0 (0.0%) | 0 (0.0%) |
| Law Enforcement | 0 (0.0%) | 0 (0.0%) |
| Food Preparation & Serving | 2 (100.0%) | 0 (0.0%) |
| Cleaning & Maintenance | 12 (100.0%) | 0 (0.0%) |
| Personal Care & Service | 0 (0.0%) | 2 (100.0%) |
| Total (Category) | 14 (73.7%) | 5 (26.3%) |
| Total (Overall) | 71 (60.2%) | 47 (39.8%) |
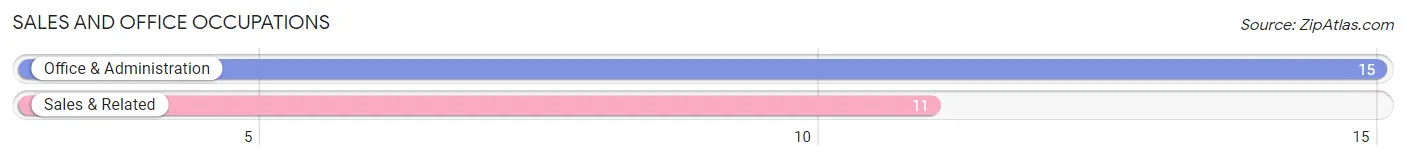
Sales and Office Occupations
The most common Sales and Office occupations in Napakiak are Office & Administration (15 | 12.7%), and Sales & Related (11 | 9.3%).
Sales and Office Occupations by Sex
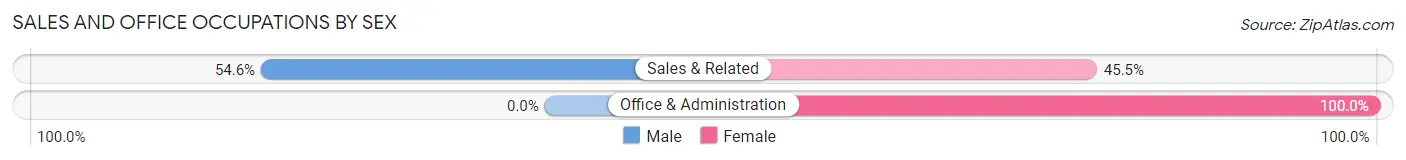
| Occupation | Male | Female |
| Sales & Related | 6 (54.5%) | 5 (45.5%) |
| Office & Administration | 0 (0.0%) | 15 (100.0%) |
| Total (Category) | 6 (23.1%) | 20 (76.9%) |
| Total (Overall) | 71 (60.2%) | 47 (39.8%) |
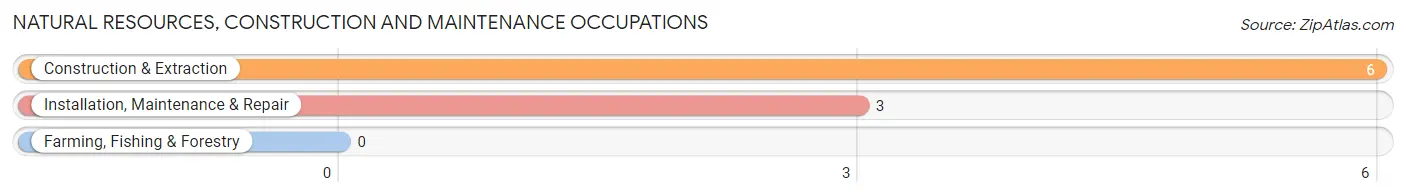
Natural Resources, Construction and Maintenance Occupations
The most common Natural Resources, Construction and Maintenance occupations in Napakiak are Construction & Extraction (6 | 5.1%), and Installation, Maintenance & Repair (3 | 2.5%).
Natural Resources, Construction and Maintenance Occupations by Sex
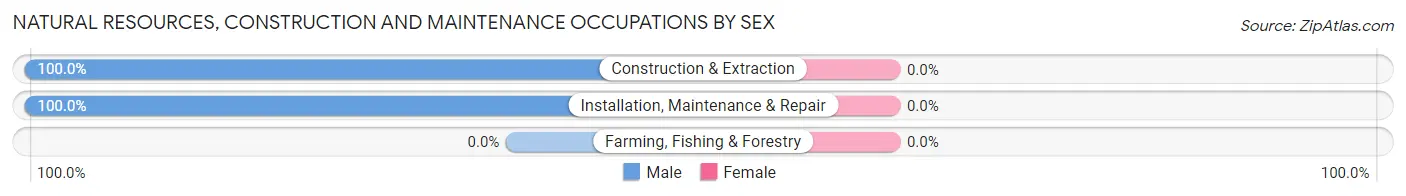
| Occupation | Male | Female |
| Farming, Fishing & Forestry | 0 (0.0%) | 0 (0.0%) |
| Construction & Extraction | 6 (100.0%) | 0 (0.0%) |
| Installation, Maintenance & Repair | 3 (100.0%) | 0 (0.0%) |
| Total (Category) | 9 (100.0%) | 0 (0.0%) |
| Total (Overall) | 71 (60.2%) | 47 (39.8%) |
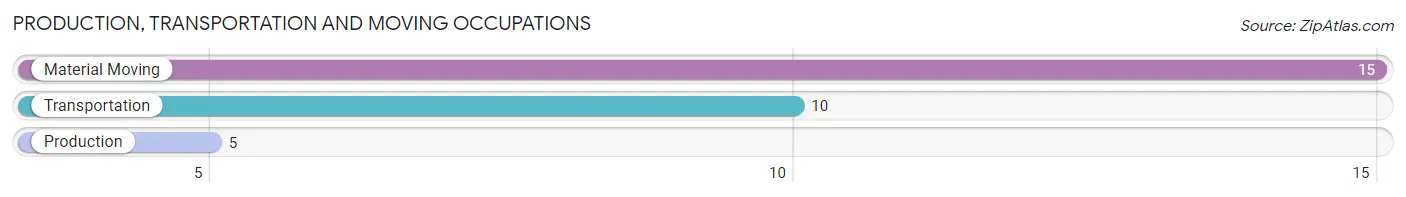
Production, Transportation and Moving Occupations
The most common Production, Transportation and Moving occupations in Napakiak are Material Moving (15 | 12.7%), Transportation (10 | 8.5%), and Production (5 | 4.2%).
Production, Transportation and Moving Occupations by Sex
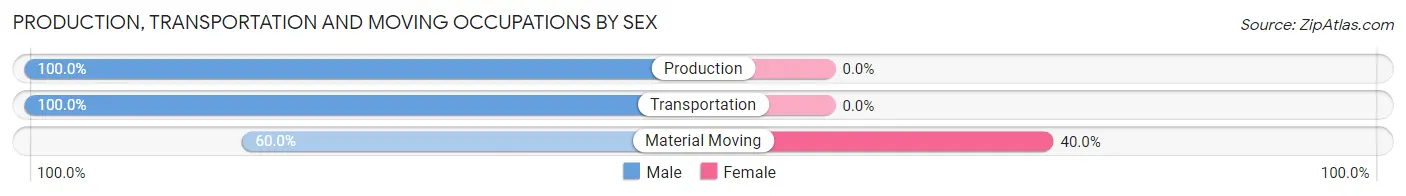
| Occupation | Male | Female |
| Production | 5 (100.0%) | 0 (0.0%) |
| Transportation | 10 (100.0%) | 0 (0.0%) |
| Material Moving | 9 (60.0%) | 6 (40.0%) |
| Total (Category) | 24 (80.0%) | 6 (20.0%) |
| Total (Overall) | 71 (60.2%) | 47 (39.8%) |
Employment Industries by Sex in Napakiak
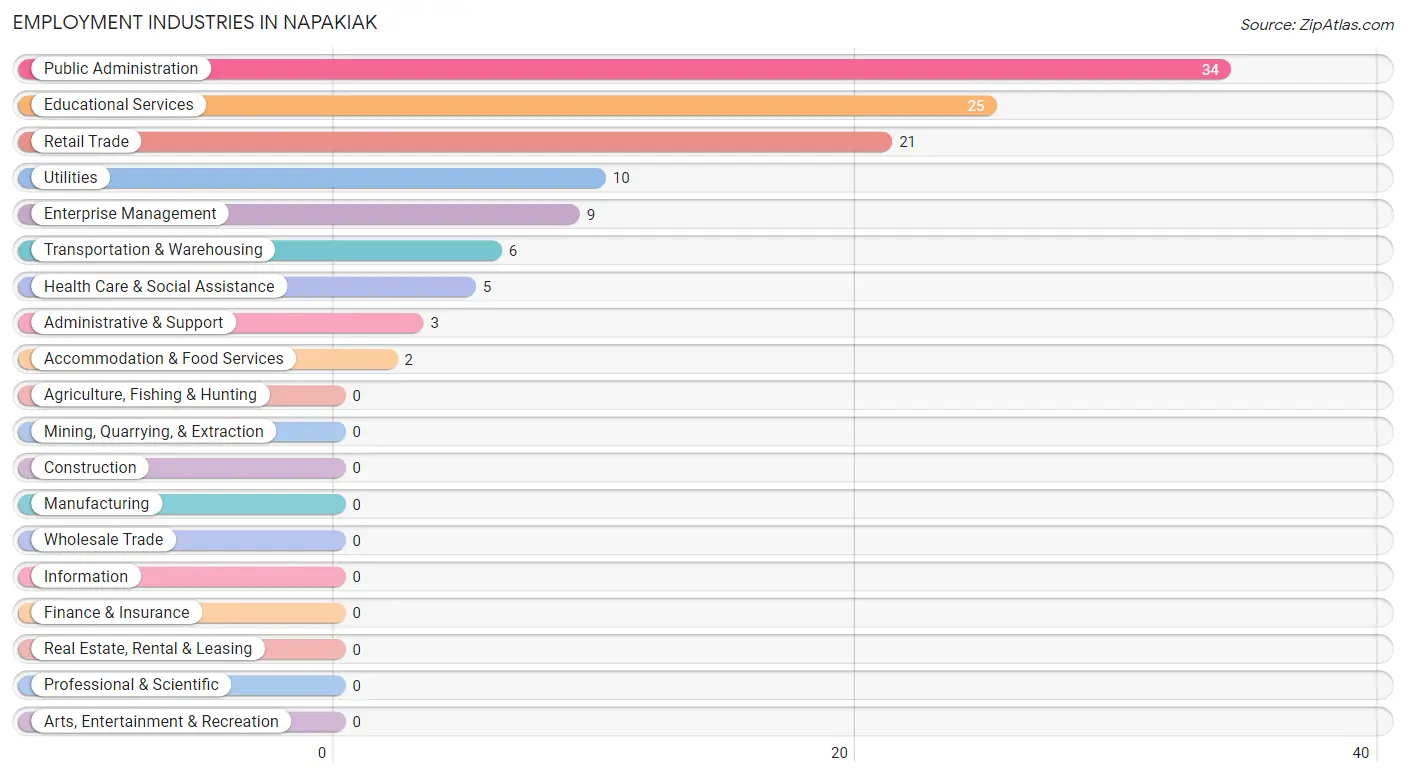
Employment Industries in Napakiak
The major employment industries in Napakiak include Public Administration (34 | 28.8%), Educational Services (25 | 21.2%), Retail Trade (21 | 17.8%), Utilities (10 | 8.5%), and Enterprise Management (9 | 7.6%).
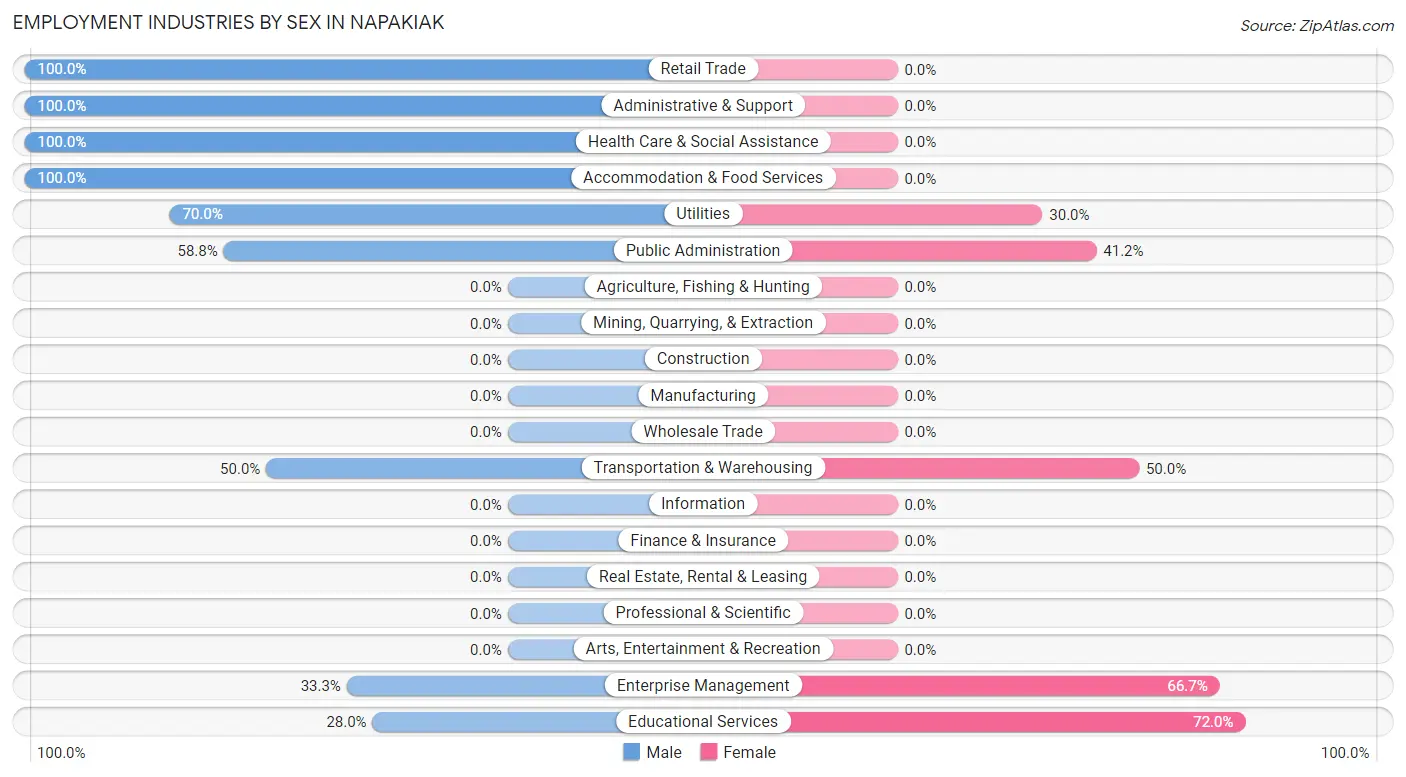
Employment Industries by Sex in Napakiak
The Napakiak industries that see more men than women are Retail Trade (100.0%), Administrative & Support (100.0%), and Health Care & Social Assistance (100.0%), whereas the industries that tend to have a higher number of women are Educational Services (72.0%), Enterprise Management (66.7%), and Transportation & Warehousing (50.0%).
| Industry | Male | Female |
| Agriculture, Fishing & Hunting | 0 (0.0%) | 0 (0.0%) |
| Mining, Quarrying, & Extraction | 0 (0.0%) | 0 (0.0%) |
| Construction | 0 (0.0%) | 0 (0.0%) |
| Manufacturing | 0 (0.0%) | 0 (0.0%) |
| Wholesale Trade | 0 (0.0%) | 0 (0.0%) |
| Retail Trade | 21 (100.0%) | 0 (0.0%) |
| Transportation & Warehousing | 3 (50.0%) | 3 (50.0%) |
| Utilities | 7 (70.0%) | 3 (30.0%) |
| Information | 0 (0.0%) | 0 (0.0%) |
| Finance & Insurance | 0 (0.0%) | 0 (0.0%) |
| Real Estate, Rental & Leasing | 0 (0.0%) | 0 (0.0%) |
| Professional & Scientific | 0 (0.0%) | 0 (0.0%) |
| Enterprise Management | 3 (33.3%) | 6 (66.7%) |
| Administrative & Support | 3 (100.0%) | 0 (0.0%) |
| Educational Services | 7 (28.0%) | 18 (72.0%) |
| Health Care & Social Assistance | 5 (100.0%) | 0 (0.0%) |
| Arts, Entertainment & Recreation | 0 (0.0%) | 0 (0.0%) |
| Accommodation & Food Services | 2 (100.0%) | 0 (0.0%) |
| Public Administration | 20 (58.8%) | 14 (41.2%) |
| Total | 71 (60.2%) | 47 (39.8%) |
Education in Napakiak
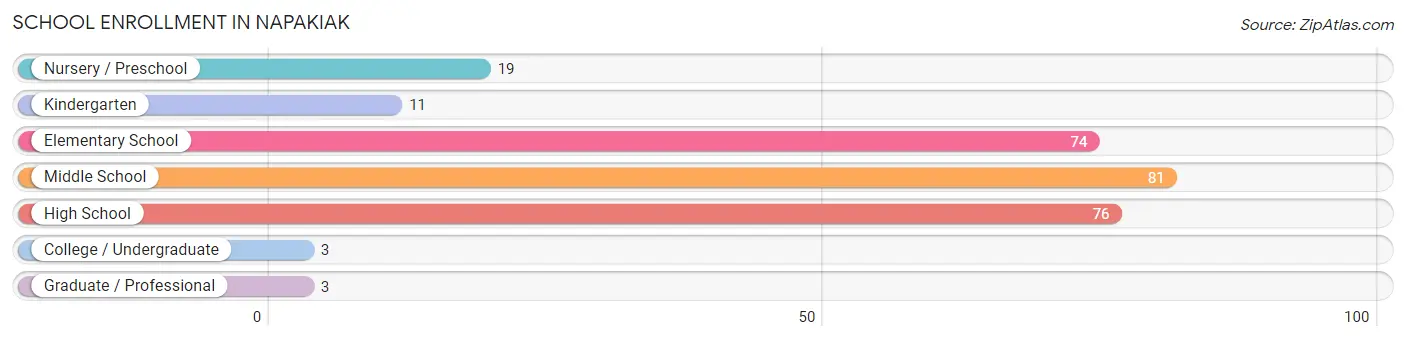
School Enrollment in Napakiak
The most common levels of schooling among the 267 students in Napakiak are middle school (81 | 30.3%), high school (76 | 28.5%), and elementary school (74 | 27.7%).
| School Level | # Students | % Students |
| Nursery / Preschool | 19 | 7.1% |
| Kindergarten | 11 | 4.1% |
| Elementary School | 74 | 27.7% |
| Middle School | 81 | 30.3% |
| High School | 76 | 28.5% |
| College / Undergraduate | 3 | 1.1% |
| Graduate / Professional | 3 | 1.1% |
| Total | 267 | 100.0% |
School Enrollment by Age by Funding Source in Napakiak
Out of a total of 267 students who are enrolled in schools in Napakiak, 36 (13.5%) attend a private institution, while the remaining 231 (86.5%) are enrolled in public schools. The age group of 15 to 17 year olds has the highest likelihood of being enrolled in private schools, with 20 (38.5% in the age bracket) enrolled. Conversely, the age group of 3 to 4 year olds has the lowest likelihood of being enrolled in a private school, with 19 (100.0% in the age bracket) attending a public institution.
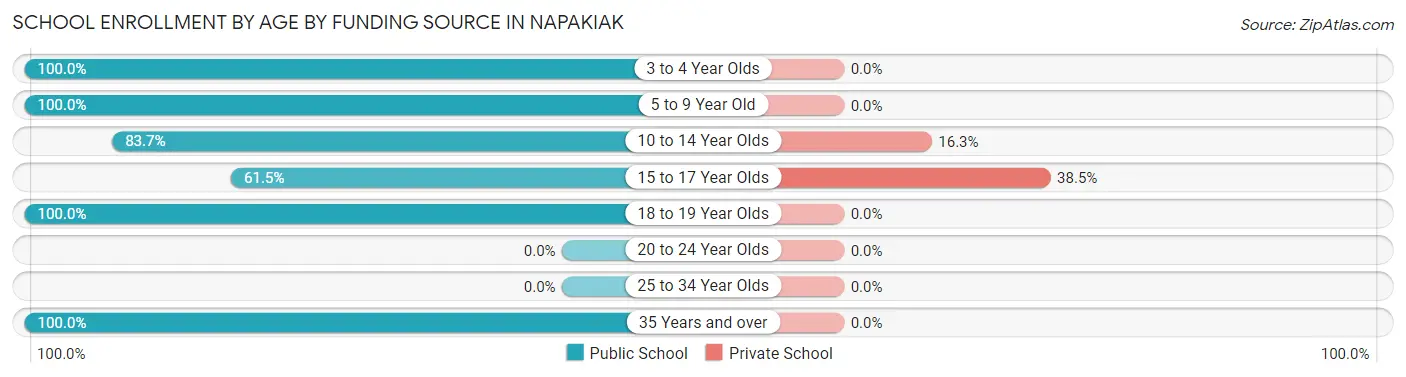
| Age Bracket | Public School | Private School |
| 3 to 4 Year Olds | 19 (100.0%) | 0 (0.0%) |
| 5 to 9 Year Old | 72 (100.0%) | 0 (0.0%) |
| 10 to 14 Year Olds | 82 (83.7%) | 16 (16.3%) |
| 15 to 17 Year Olds | 32 (61.5%) | 20 (38.5%) |
| 18 to 19 Year Olds | 20 (100.0%) | 0 (0.0%) |
| 20 to 24 Year Olds | 0 (0.0%) | 0 (0.0%) |
| 25 to 34 Year Olds | 0 (0.0%) | 0 (0.0%) |
| 35 Years and over | 6 (100.0%) | 0 (0.0%) |
| Total | 231 (86.5%) | 36 (13.5%) |
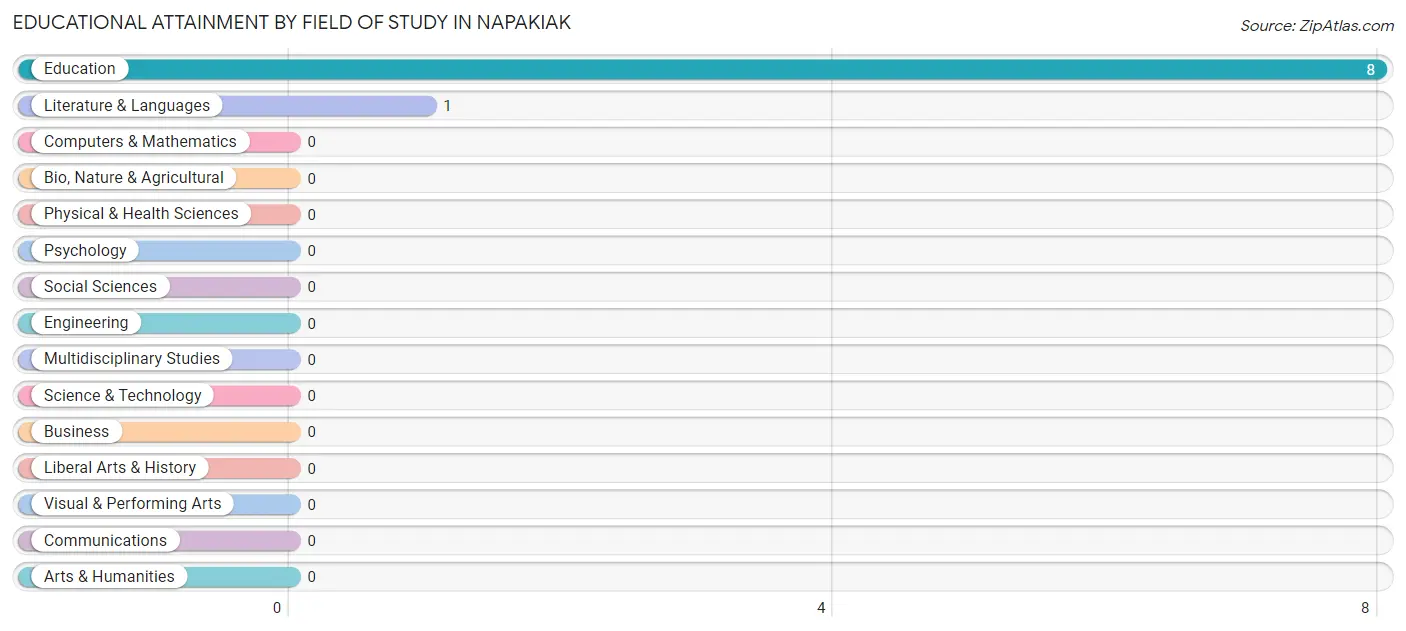
Educational Attainment by Field of Study in Napakiak
Education (8 | 88.9%), and literature & languages (1 | 11.1%) are the most common fields of study among 9 individuals in Napakiak who have obtained a bachelor's degree or higher.
| Field of Study | # Graduates | % Graduates |
| Computers & Mathematics | 0 | 0.0% |
| Bio, Nature & Agricultural | 0 | 0.0% |
| Physical & Health Sciences | 0 | 0.0% |
| Psychology | 0 | 0.0% |
| Social Sciences | 0 | 0.0% |
| Engineering | 0 | 0.0% |
| Multidisciplinary Studies | 0 | 0.0% |
| Science & Technology | 0 | 0.0% |
| Business | 0 | 0.0% |
| Education | 8 | 88.9% |
| Literature & Languages | 1 | 11.1% |
| Liberal Arts & History | 0 | 0.0% |
| Visual & Performing Arts | 0 | 0.0% |
| Communications | 0 | 0.0% |
| Arts & Humanities | 0 | 0.0% |
| Total | 9 | 100.0% |
Transportation & Commute in Napakiak
Vehicle Availability by Sex in Napakiak
The most prevalent vehicle ownership categories in Napakiak are males with no vehicle (51, accounting for 77.3%) and females with no vehicle (26, making up 115.9%).
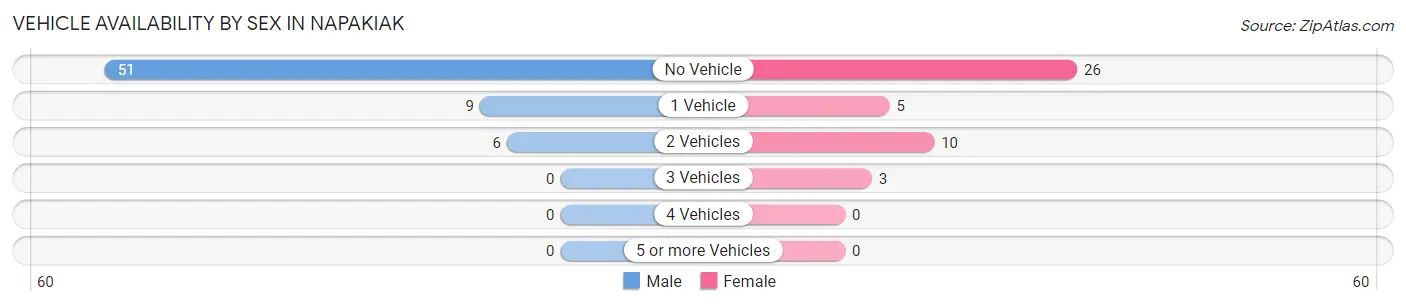
| Vehicles Available | Male | Female |
| No Vehicle | 51 (77.3%) | 26 (59.1%) |
| 1 Vehicle | 9 (13.6%) | 5 (11.4%) |
| 2 Vehicles | 6 (9.1%) | 10 (22.7%) |
| 3 Vehicles | 0 (0.0%) | 3 (6.8%) |
| 4 Vehicles | 0 (0.0%) | 0 (0.0%) |
| 5 or more Vehicles | 0 (0.0%) | 0 (0.0%) |
| Total | 66 (100.0%) | 44 (100.0%) |
Commute Time in Napakiak
The most frequently occuring commute durations in Napakiak are less than 5 minutes (66 commuters, 61.1%), 5 to 9 minutes (24 commuters, 22.2%), and 15 to 19 minutes (15 commuters, 13.9%).
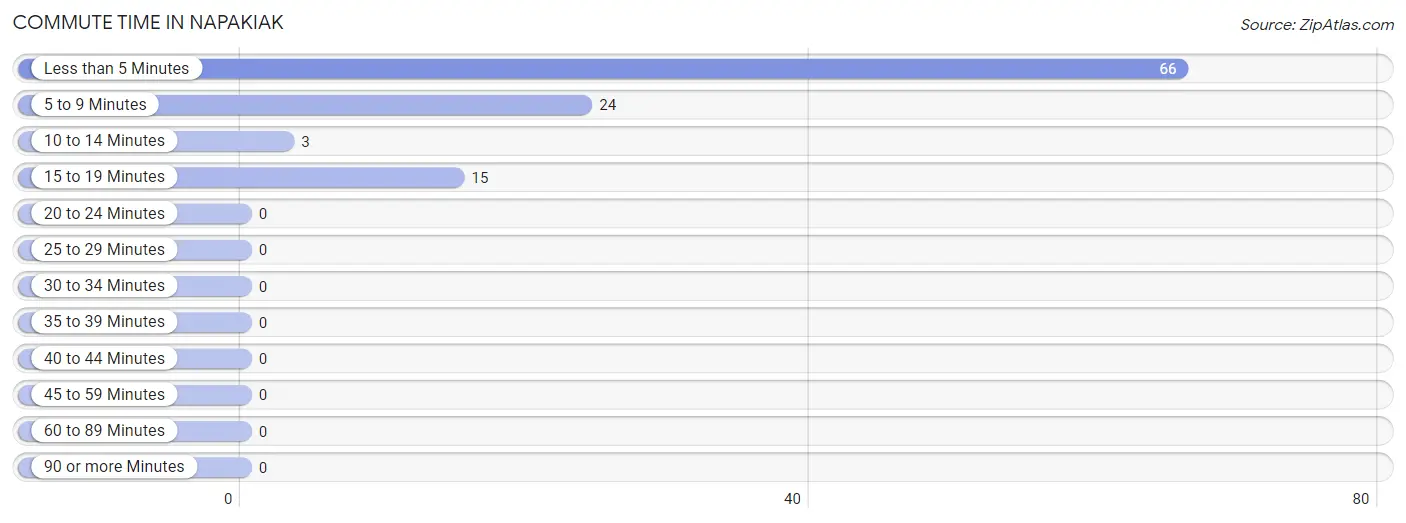
| Commute Time | # Commuters | % Commuters |
| Less than 5 Minutes | 66 | 61.1% |
| 5 to 9 Minutes | 24 | 22.2% |
| 10 to 14 Minutes | 3 | 2.8% |
| 15 to 19 Minutes | 15 | 13.9% |
| 20 to 24 Minutes | 0 | 0.0% |
| 25 to 29 Minutes | 0 | 0.0% |
| 30 to 34 Minutes | 0 | 0.0% |
| 35 to 39 Minutes | 0 | 0.0% |
| 40 to 44 Minutes | 0 | 0.0% |
| 45 to 59 Minutes | 0 | 0.0% |
| 60 to 89 Minutes | 0 | 0.0% |
| 90 or more Minutes | 0 | 0.0% |
Commute Time by Sex in Napakiak
The most common commute times in Napakiak are less than 5 minutes (29 commuters, 45.3%) for males and less than 5 minutes (37 commuters, 84.1%) for females.
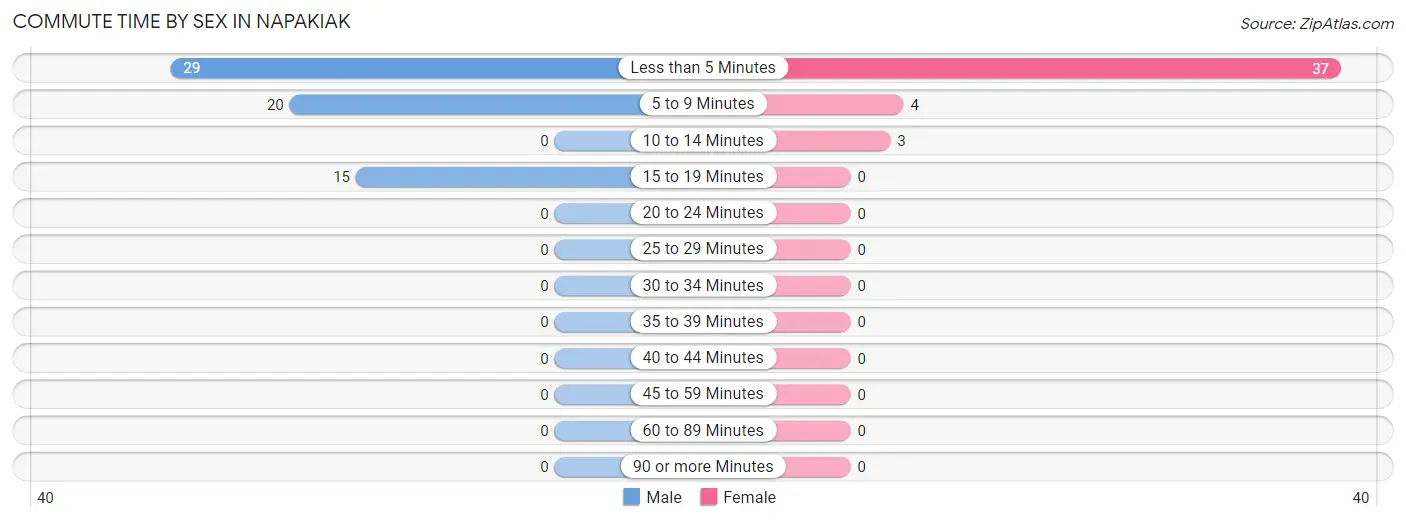
| Commute Time | Male | Female |
| Less than 5 Minutes | 29 (45.3%) | 37 (84.1%) |
| 5 to 9 Minutes | 20 (31.2%) | 4 (9.1%) |
| 10 to 14 Minutes | 0 (0.0%) | 3 (6.8%) |
| 15 to 19 Minutes | 15 (23.4%) | 0 (0.0%) |
| 20 to 24 Minutes | 0 (0.0%) | 0 (0.0%) |
| 25 to 29 Minutes | 0 (0.0%) | 0 (0.0%) |
| 30 to 34 Minutes | 0 (0.0%) | 0 (0.0%) |
| 35 to 39 Minutes | 0 (0.0%) | 0 (0.0%) |
| 40 to 44 Minutes | 0 (0.0%) | 0 (0.0%) |
| 45 to 59 Minutes | 0 (0.0%) | 0 (0.0%) |
| 60 to 89 Minutes | 0 (0.0%) | 0 (0.0%) |
| 90 or more Minutes | 0 (0.0%) | 0 (0.0%) |
Time of Departure to Work by Sex in Napakiak
The most frequent times of departure to work in Napakiak are 9:00 AM to 9:59 AM (21, 32.8%) for males and 8:30 AM to 8:59 AM (13, 29.5%) for females.
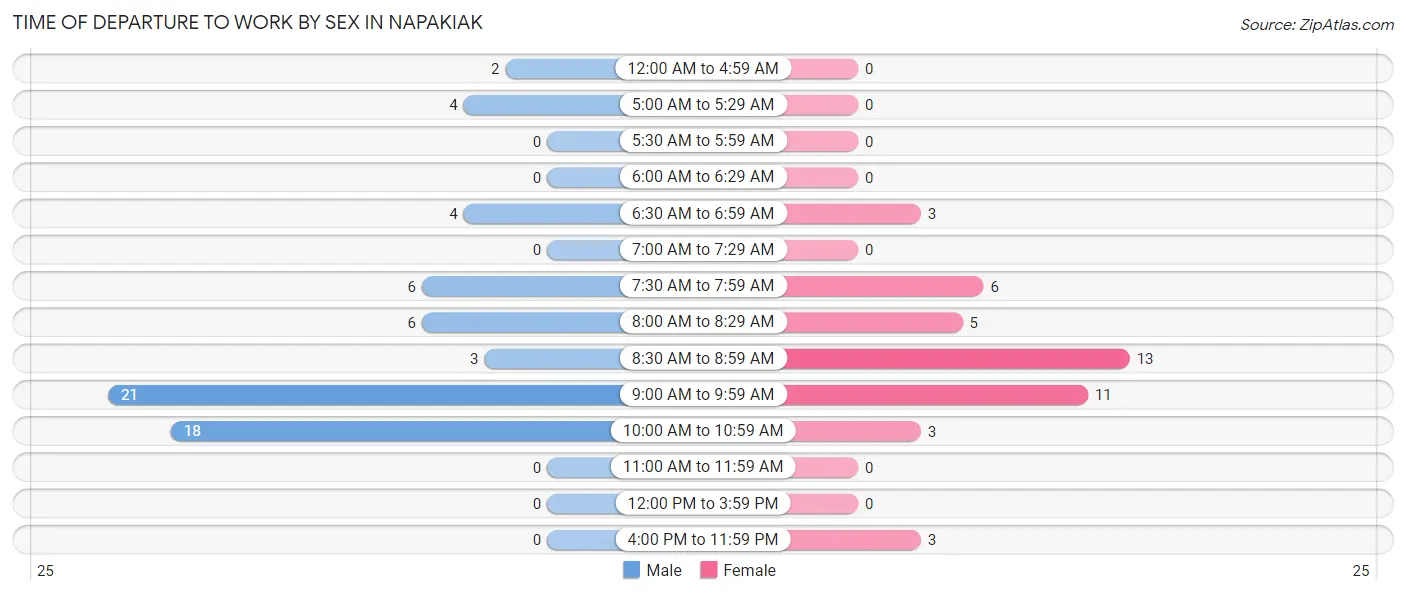
| Time of Departure | Male | Female |
| 12:00 AM to 4:59 AM | 2 (3.1%) | 0 (0.0%) |
| 5:00 AM to 5:29 AM | 4 (6.2%) | 0 (0.0%) |
| 5:30 AM to 5:59 AM | 0 (0.0%) | 0 (0.0%) |
| 6:00 AM to 6:29 AM | 0 (0.0%) | 0 (0.0%) |
| 6:30 AM to 6:59 AM | 4 (6.2%) | 3 (6.8%) |
| 7:00 AM to 7:29 AM | 0 (0.0%) | 0 (0.0%) |
| 7:30 AM to 7:59 AM | 6 (9.4%) | 6 (13.6%) |
| 8:00 AM to 8:29 AM | 6 (9.4%) | 5 (11.4%) |
| 8:30 AM to 8:59 AM | 3 (4.7%) | 13 (29.5%) |
| 9:00 AM to 9:59 AM | 21 (32.8%) | 11 (25.0%) |
| 10:00 AM to 10:59 AM | 18 (28.1%) | 3 (6.8%) |
| 11:00 AM to 11:59 AM | 0 (0.0%) | 0 (0.0%) |
| 12:00 PM to 3:59 PM | 0 (0.0%) | 0 (0.0%) |
| 4:00 PM to 11:59 PM | 0 (0.0%) | 3 (6.8%) |
| Total | 64 (100.0%) | 44 (100.0%) |
Housing Occupancy in Napakiak
Occupancy by Ownership in Napakiak
Of the total 178 dwellings in Napakiak, owner-occupied units account for 111 (62.4%), while renter-occupied units make up 67 (37.6%).
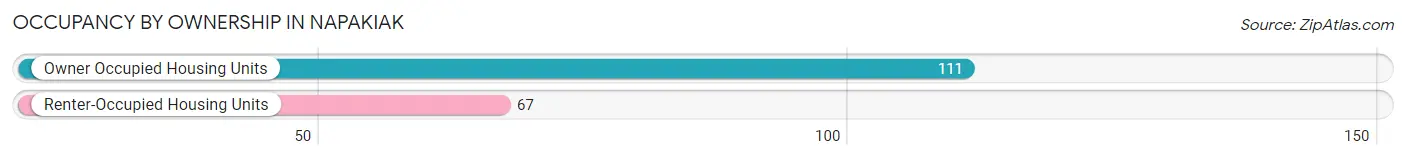
| Occupancy | # Housing Units | % Housing Units |
| Owner Occupied Housing Units | 111 | 62.4% |
| Renter-Occupied Housing Units | 67 | 37.6% |
| Total Occupied Housing Units | 178 | 100.0% |
Occupancy by Household Size in Napakiak
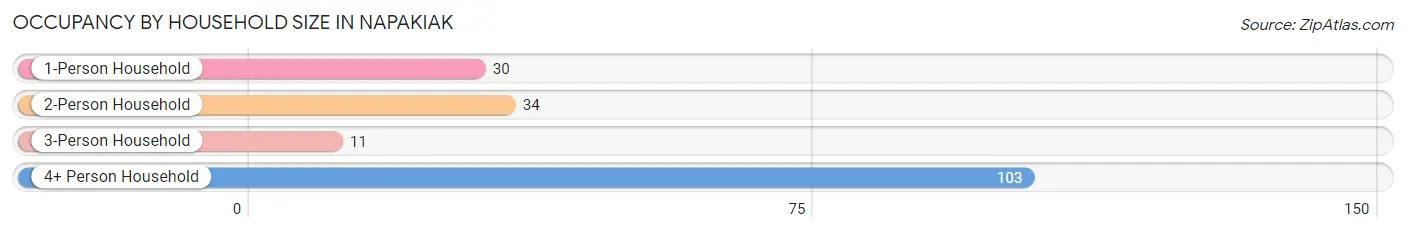
| Household Size | # Housing Units | % Housing Units |
| 1-Person Household | 30 | 16.9% |
| 2-Person Household | 34 | 19.1% |
| 3-Person Household | 11 | 6.2% |
| 4+ Person Household | 103 | 57.9% |
| Total Housing Units | 178 | 100.0% |
Occupancy by Ownership by Household Size in Napakiak
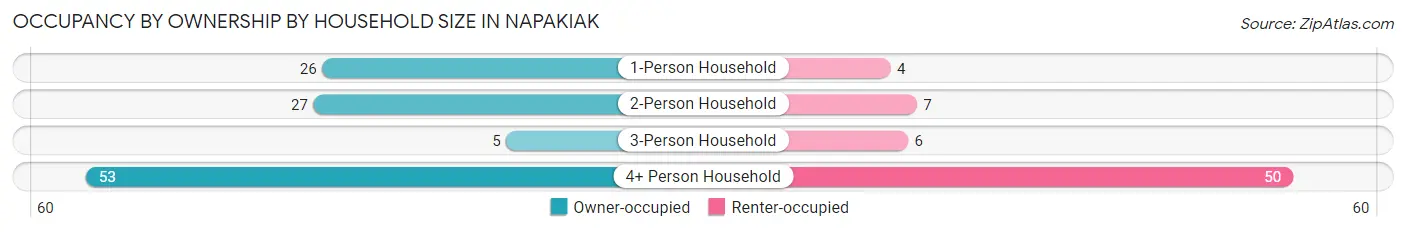
| Household Size | Owner-occupied | Renter-occupied |
| 1-Person Household | 26 (86.7%) | 4 (13.3%) |
| 2-Person Household | 27 (79.4%) | 7 (20.6%) |
| 3-Person Household | 5 (45.5%) | 6 (54.5%) |
| 4+ Person Household | 53 (51.5%) | 50 (48.5%) |
| Total Housing Units | 111 (62.4%) | 67 (37.6%) |
Occupancy by Educational Attainment in Napakiak
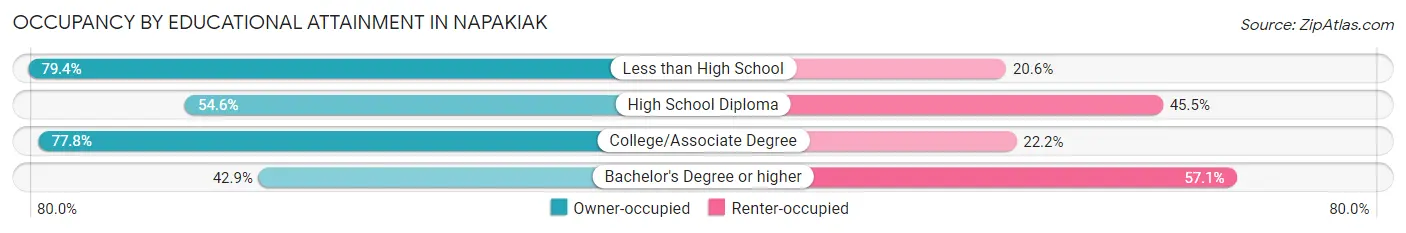
| Household Size | Owner-occupied | Renter-occupied |
| Less than High School | 27 (79.4%) | 7 (20.6%) |
| High School Diploma | 60 (54.5%) | 50 (45.5%) |
| College/Associate Degree | 21 (77.8%) | 6 (22.2%) |
| Bachelor's Degree or higher | 3 (42.9%) | 4 (57.1%) |
Occupancy by Age of Householder in Napakiak
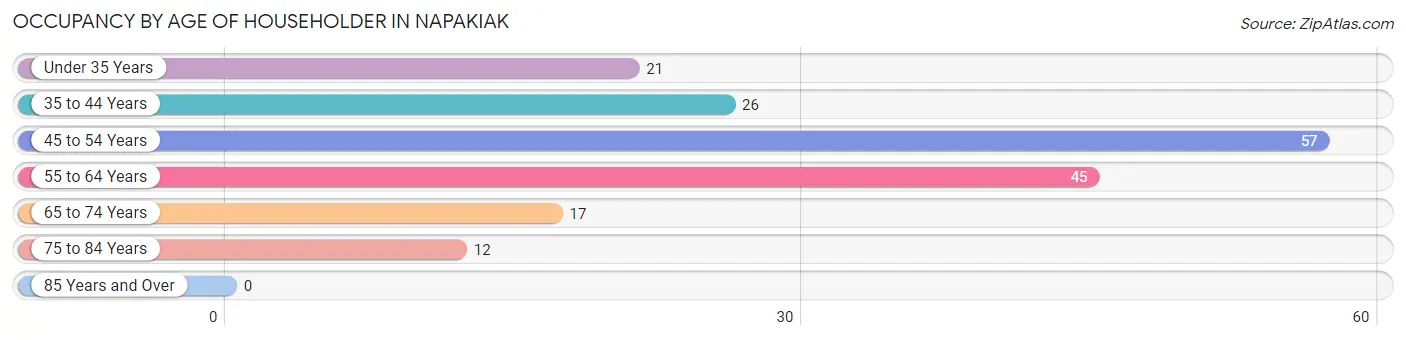
| Age Bracket | # Households | % Households |
| Under 35 Years | 21 | 11.8% |
| 35 to 44 Years | 26 | 14.6% |
| 45 to 54 Years | 57 | 32.0% |
| 55 to 64 Years | 45 | 25.3% |
| 65 to 74 Years | 17 | 9.6% |
| 75 to 84 Years | 12 | 6.7% |
| 85 Years and Over | 0 | 0.0% |
| Total | 178 | 100.0% |
Housing Finances in Napakiak
Median Income by Occupancy in Napakiak
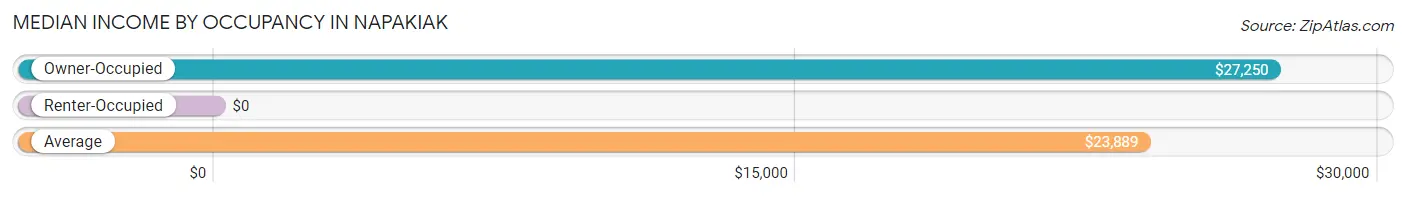
| Occupancy Type | # Households | Median Income |
| Owner-Occupied | 111 (62.4%) | $27,250 |
| Renter-Occupied | 67 (37.6%) | $0 |
| Average | 178 (100.0%) | $23,889 |
Occupancy by Householder Income Bracket in Napakiak
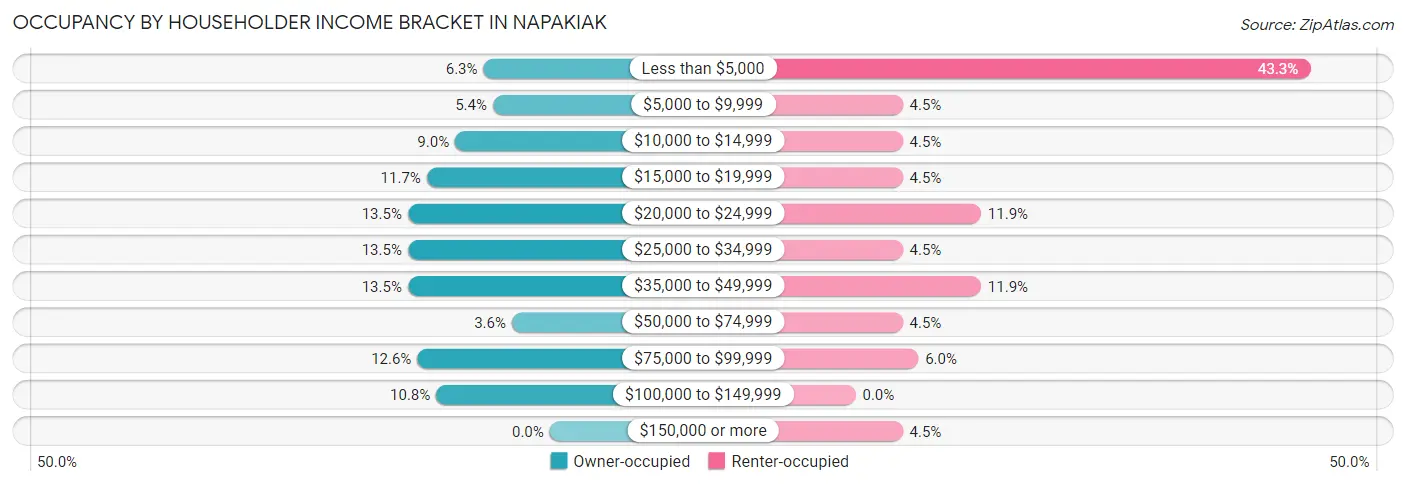
| Income Bracket | Owner-occupied | Renter-occupied |
| Less than $5,000 | 7 (6.3%) | 29 (43.3%) |
| $5,000 to $9,999 | 6 (5.4%) | 3 (4.5%) |
| $10,000 to $14,999 | 10 (9.0%) | 3 (4.5%) |
| $15,000 to $19,999 | 13 (11.7%) | 3 (4.5%) |
| $20,000 to $24,999 | 15 (13.5%) | 8 (11.9%) |
| $25,000 to $34,999 | 15 (13.5%) | 3 (4.5%) |
| $35,000 to $49,999 | 15 (13.5%) | 8 (11.9%) |
| $50,000 to $74,999 | 4 (3.6%) | 3 (4.5%) |
| $75,000 to $99,999 | 14 (12.6%) | 4 (6.0%) |
| $100,000 to $149,999 | 12 (10.8%) | 0 (0.0%) |
| $150,000 or more | 0 (0.0%) | 3 (4.5%) |
| Total | 111 (100.0%) | 67 (100.0%) |
Monthly Housing Cost Tiers in Napakiak
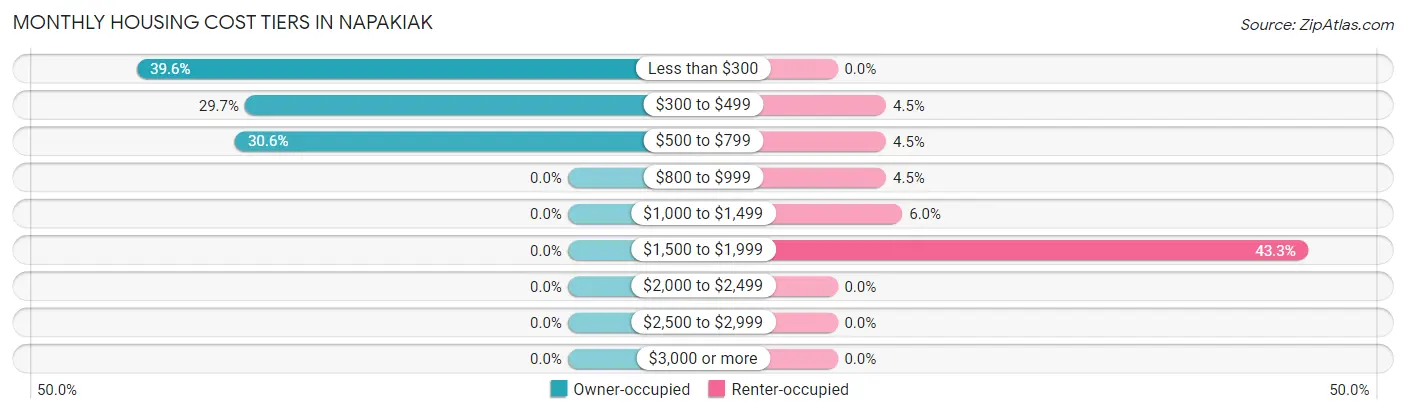
| Monthly Cost | Owner-occupied | Renter-occupied |
| Less than $300 | 44 (39.6%) | 0 (0.0%) |
| $300 to $499 | 33 (29.7%) | 3 (4.5%) |
| $500 to $799 | 34 (30.6%) | 3 (4.5%) |
| $800 to $999 | 0 (0.0%) | 3 (4.5%) |
| $1,000 to $1,499 | 0 (0.0%) | 4 (6.0%) |
| $1,500 to $1,999 | 0 (0.0%) | 29 (43.3%) |
| $2,000 to $2,499 | 0 (0.0%) | 0 (0.0%) |
| $2,500 to $2,999 | 0 (0.0%) | 0 (0.0%) |
| $3,000 or more | 0 (0.0%) | 0 (0.0%) |
| Total | 111 (100.0%) | 67 (100.0%) |
Physical Housing Characteristics in Napakiak
Housing Structures in Napakiak
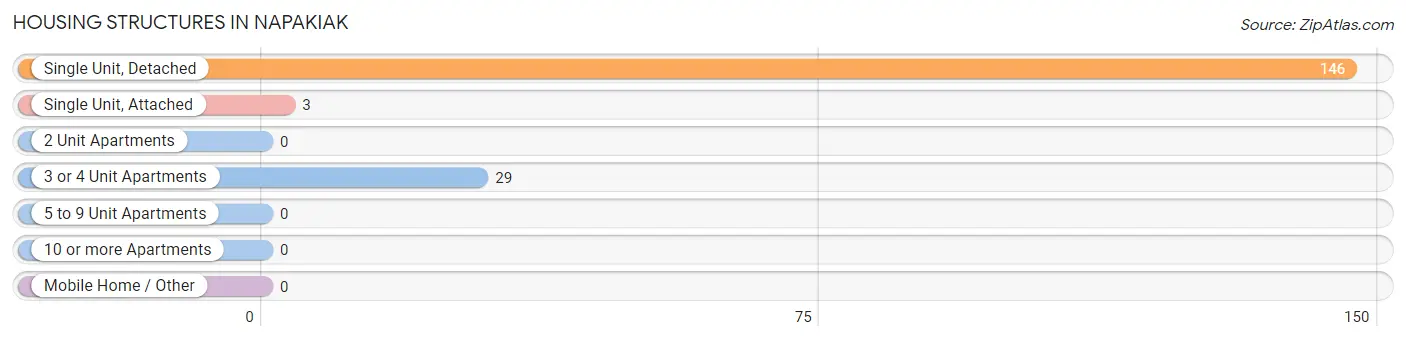
| Structure Type | # Housing Units | % Housing Units |
| Single Unit, Detached | 146 | 82.0% |
| Single Unit, Attached | 3 | 1.7% |
| 2 Unit Apartments | 0 | 0.0% |
| 3 or 4 Unit Apartments | 29 | 16.3% |
| 5 to 9 Unit Apartments | 0 | 0.0% |
| 10 or more Apartments | 0 | 0.0% |
| Mobile Home / Other | 0 | 0.0% |
| Total | 178 | 100.0% |
Housing Structures by Occupancy in Napakiak
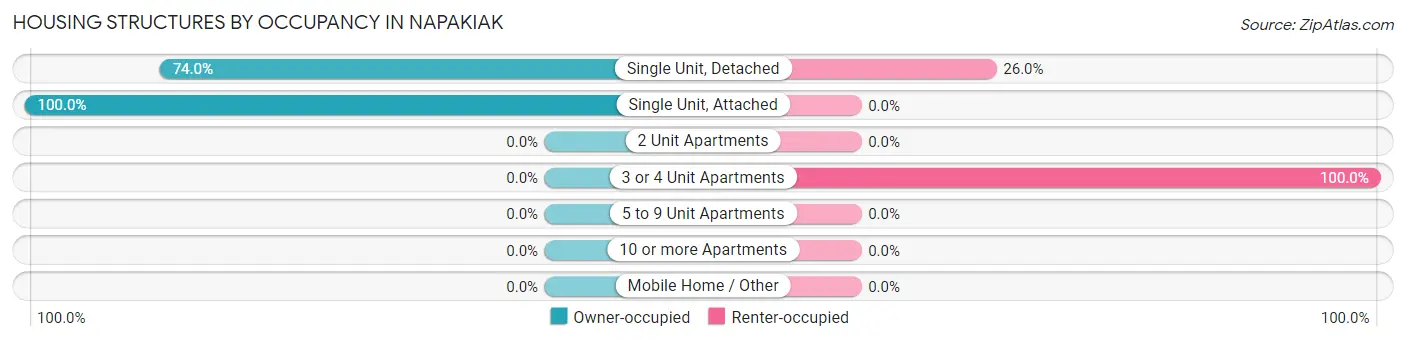
| Structure Type | Owner-occupied | Renter-occupied |
| Single Unit, Detached | 108 (74.0%) | 38 (26.0%) |
| Single Unit, Attached | 3 (100.0%) | 0 (0.0%) |
| 2 Unit Apartments | 0 (0.0%) | 0 (0.0%) |
| 3 or 4 Unit Apartments | 0 (0.0%) | 29 (100.0%) |
| 5 to 9 Unit Apartments | 0 (0.0%) | 0 (0.0%) |
| 10 or more Apartments | 0 (0.0%) | 0 (0.0%) |
| Mobile Home / Other | 0 (0.0%) | 0 (0.0%) |
| Total | 111 (62.4%) | 67 (37.6%) |
Housing Structures by Number of Rooms in Napakiak

| Number of Rooms | Owner-occupied | Renter-occupied |
| 1 Room | 5 (4.5%) | 1 (1.5%) |
| 2 or 3 Rooms | 32 (28.8%) | 6 (9.0%) |
| 4 or 5 Rooms | 67 (60.4%) | 60 (89.5%) |
| 6 or 7 Rooms | 7 (6.3%) | 0 (0.0%) |
| 8 or more Rooms | 0 (0.0%) | 0 (0.0%) |
| Total | 111 (100.0%) | 67 (100.0%) |
Housing Structure by Heating Type in Napakiak
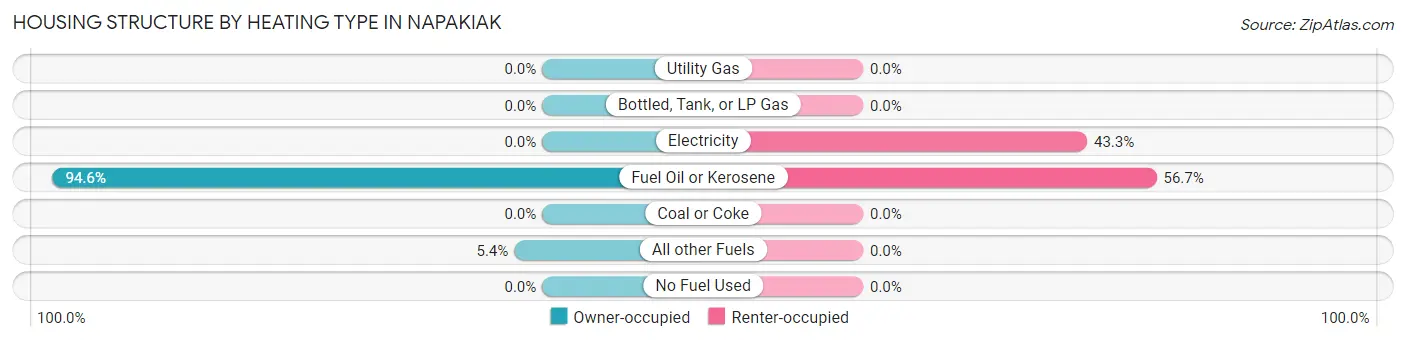
| Heating Type | Owner-occupied | Renter-occupied |
| Utility Gas | 0 (0.0%) | 0 (0.0%) |
| Bottled, Tank, or LP Gas | 0 (0.0%) | 0 (0.0%) |
| Electricity | 0 (0.0%) | 29 (43.3%) |
| Fuel Oil or Kerosene | 105 (94.6%) | 38 (56.7%) |
| Coal or Coke | 0 (0.0%) | 0 (0.0%) |
| All other Fuels | 6 (5.4%) | 0 (0.0%) |
| No Fuel Used | 0 (0.0%) | 0 (0.0%) |
| Total | 111 (100.0%) | 67 (100.0%) |
Household Vehicle Usage in Napakiak
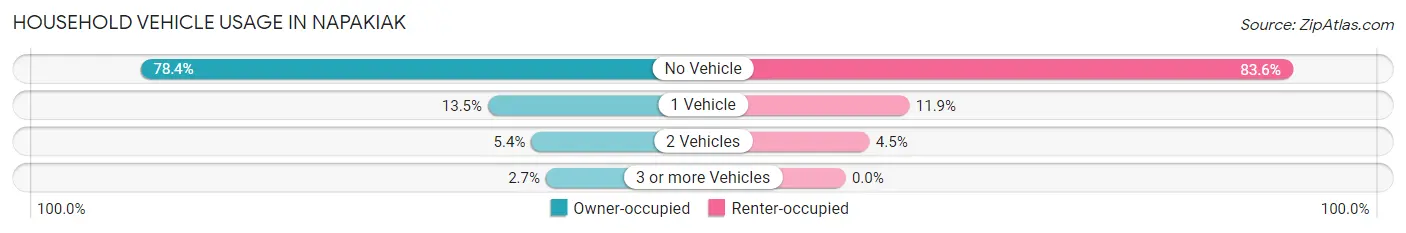
| Vehicles per Household | Owner-occupied | Renter-occupied |
| No Vehicle | 87 (78.4%) | 56 (83.6%) |
| 1 Vehicle | 15 (13.5%) | 8 (11.9%) |
| 2 Vehicles | 6 (5.4%) | 3 (4.5%) |
| 3 or more Vehicles | 3 (2.7%) | 0 (0.0%) |
| Total | 111 (100.0%) | 67 (100.0%) |
Real Estate & Mortgages in Napakiak
Real Estate and Mortgage Overview in Napakiak
| Characteristic | Without Mortgage | With Mortgage |
| Housing Units | 91 | 20 |
| Median Property Value | $19,700 | $240,000 |
| Median Household Income | $24,306 | $0 |
| Monthly Housing Costs | $309 | $0 |
| Real Estate Taxes | - | - |
Property Value by Mortgage Status in Napakiak
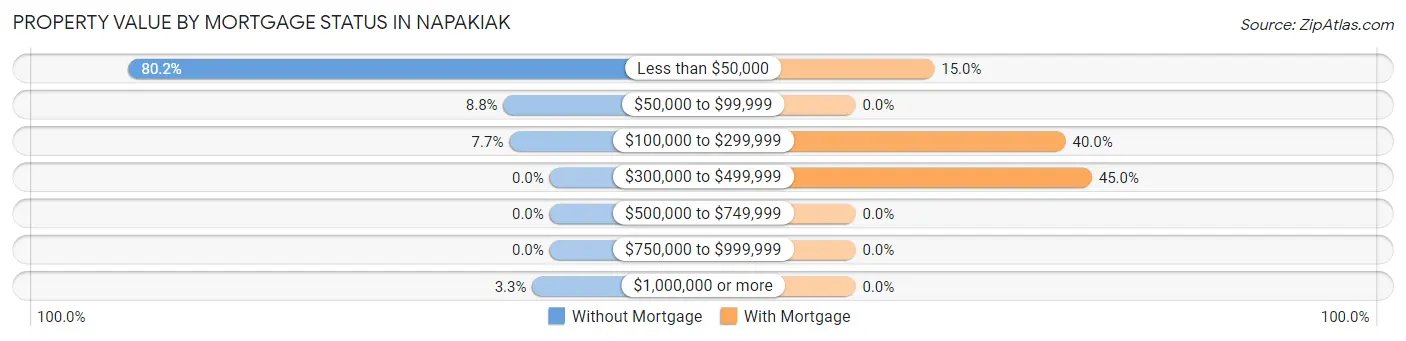
| Property Value | Without Mortgage | With Mortgage |
| Less than $50,000 | 73 (80.2%) | 3 (15.0%) |
| $50,000 to $99,999 | 8 (8.8%) | 0 (0.0%) |
| $100,000 to $299,999 | 7 (7.7%) | 8 (40.0%) |
| $300,000 to $499,999 | 0 (0.0%) | 9 (45.0%) |
| $500,000 to $749,999 | 0 (0.0%) | 0 (0.0%) |
| $750,000 to $999,999 | 0 (0.0%) | 0 (0.0%) |
| $1,000,000 or more | 3 (3.3%) | 0 (0.0%) |
| Total | 91 (100.0%) | 20 (100.0%) |
Household Income by Mortgage Status in Napakiak
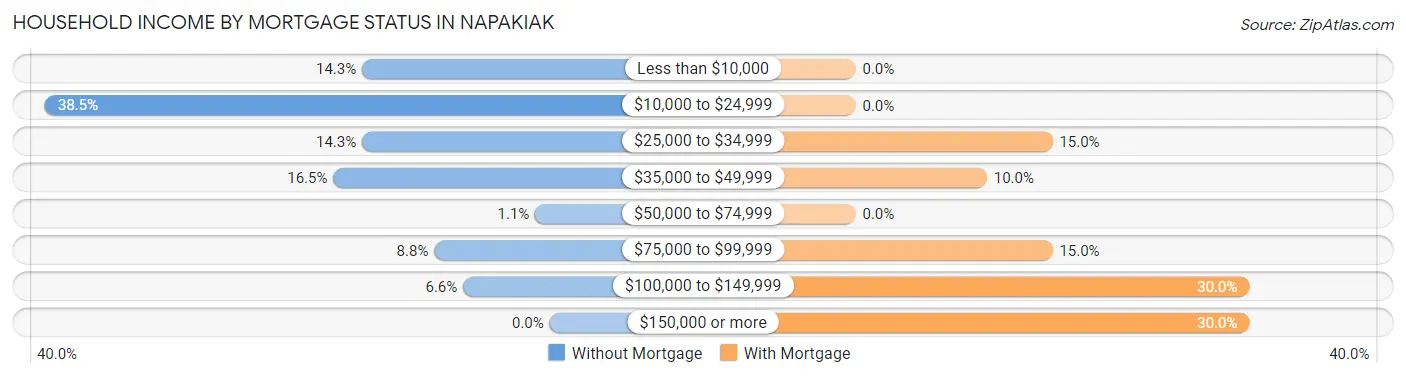
| Household Income | Without Mortgage | With Mortgage |
| Less than $10,000 | 13 (14.3%) | 0 (0.0%) |
| $10,000 to $24,999 | 35 (38.5%) | 0 (0.0%) |
| $25,000 to $34,999 | 13 (14.3%) | 3 (15.0%) |
| $35,000 to $49,999 | 15 (16.5%) | 2 (10.0%) |
| $50,000 to $74,999 | 1 (1.1%) | 0 (0.0%) |
| $75,000 to $99,999 | 8 (8.8%) | 3 (15.0%) |
| $100,000 to $149,999 | 6 (6.6%) | 6 (30.0%) |
| $150,000 or more | 0 (0.0%) | 6 (30.0%) |
| Total | 91 (100.0%) | 20 (100.0%) |
Property Value to Household Income Ratio in Napakiak
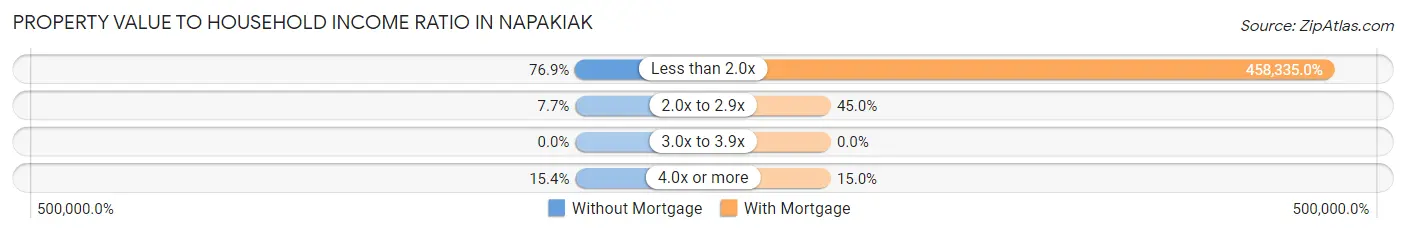
| Value-to-Income Ratio | Without Mortgage | With Mortgage |
| Less than 2.0x | 70 (76.9%) | 91,667 (458,335.0%) |
| 2.0x to 2.9x | 7 (7.7%) | 9 (45.0%) |
| 3.0x to 3.9x | 0 (0.0%) | 0 (0.0%) |
| 4.0x or more | 14 (15.4%) | 3 (15.0%) |
| Total | 91 (100.0%) | 20 (100.0%) |
Real Estate Taxes by Mortgage Status in Napakiak
| Property Taxes | Without Mortgage | With Mortgage |
| Less than $800 | 0 (0.0%) | 0 (0.0%) |
| $800 to $1,499 | 0 (0.0%) | 0 (0.0%) |
| $800 to $1,499 | 0 (0.0%) | 0 (0.0%) |
| Total | 91 (100.0%) | 20 (100.0%) |
Health & Disability in Napakiak
Health Insurance Coverage by Age in Napakiak
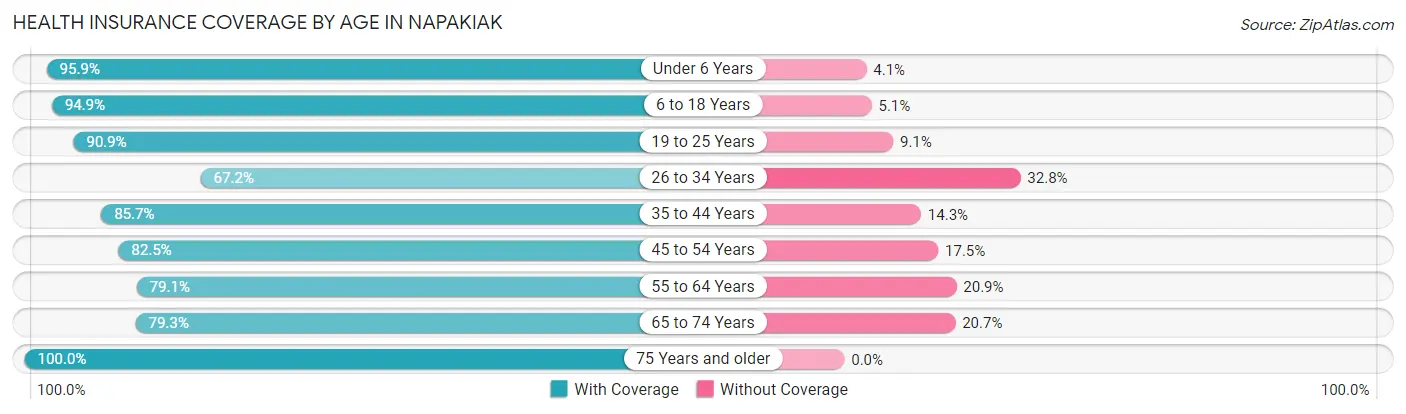
| Age Bracket | With Coverage | Without Coverage |
| Under 6 Years | 70 (95.9%) | 3 (4.1%) |
| 6 to 18 Years | 224 (94.9%) | 12 (5.1%) |
| 19 to 25 Years | 40 (90.9%) | 4 (9.1%) |
| 26 to 34 Years | 45 (67.2%) | 22 (32.8%) |
| 35 to 44 Years | 72 (85.7%) | 12 (14.3%) |
| 45 to 54 Years | 66 (82.5%) | 14 (17.5%) |
| 55 to 64 Years | 53 (79.1%) | 14 (20.9%) |
| 65 to 74 Years | 23 (79.3%) | 6 (20.7%) |
| 75 Years and older | 12 (100.0%) | 0 (0.0%) |
| Total | 605 (87.4%) | 87 (12.6%) |
Health Insurance Coverage by Citizenship Status in Napakiak
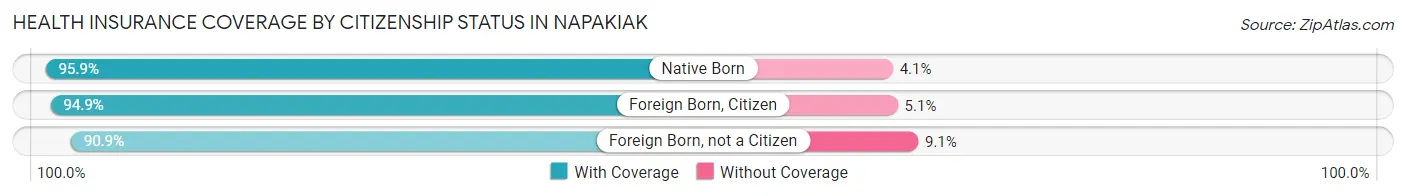
| Citizenship Status | With Coverage | Without Coverage |
| Native Born | 70 (95.9%) | 3 (4.1%) |
| Foreign Born, Citizen | 224 (94.9%) | 12 (5.1%) |
| Foreign Born, not a Citizen | 40 (90.9%) | 4 (9.1%) |
Health Insurance Coverage by Household Income in Napakiak
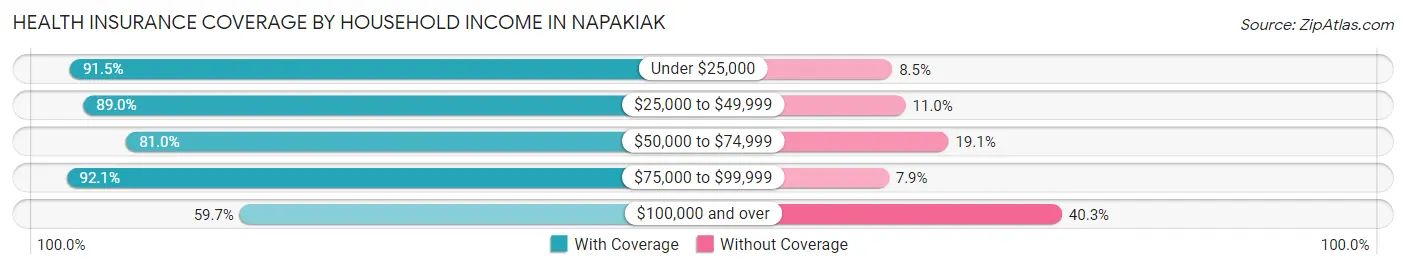
| Household Income | With Coverage | Without Coverage |
| Under $25,000 | 344 (91.5%) | 32 (8.5%) |
| $25,000 to $49,999 | 105 (89.0%) | 13 (11.0%) |
| $50,000 to $74,999 | 34 (80.9%) | 8 (19.1%) |
| $75,000 to $99,999 | 82 (92.1%) | 7 (7.9%) |
| $100,000 and over | 40 (59.7%) | 27 (40.3%) |
Public vs Private Health Insurance Coverage by Age in Napakiak
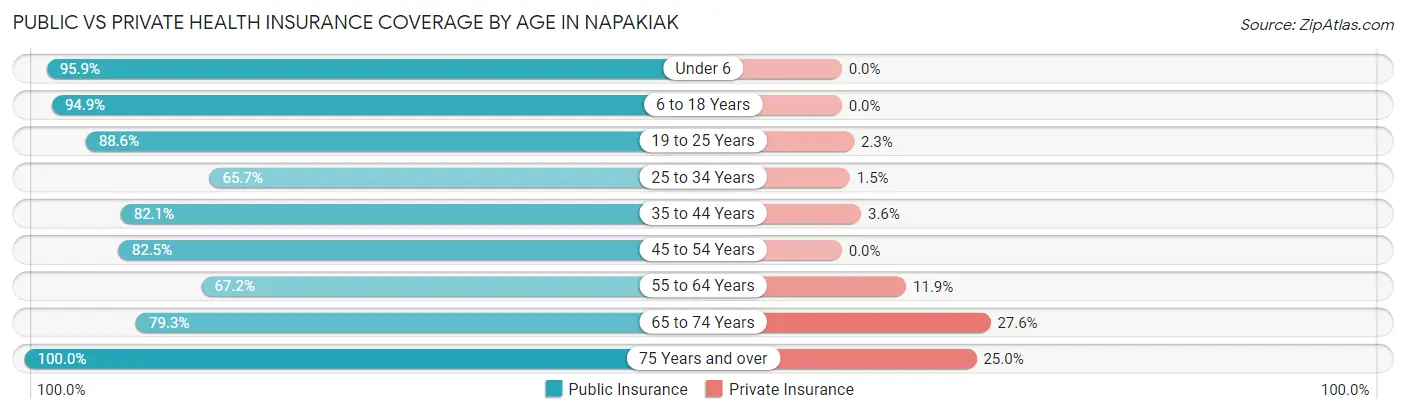
| Age Bracket | Public Insurance | Private Insurance |
| Under 6 | 70 (95.9%) | 0 (0.0%) |
| 6 to 18 Years | 224 (94.9%) | 0 (0.0%) |
| 19 to 25 Years | 39 (88.6%) | 1 (2.3%) |
| 25 to 34 Years | 44 (65.7%) | 1 (1.5%) |
| 35 to 44 Years | 69 (82.1%) | 3 (3.6%) |
| 45 to 54 Years | 66 (82.5%) | 0 (0.0%) |
| 55 to 64 Years | 45 (67.2%) | 8 (11.9%) |
| 65 to 74 Years | 23 (79.3%) | 8 (27.6%) |
| 75 Years and over | 12 (100.0%) | 3 (25.0%) |
| Total | 592 (85.6%) | 24 (3.5%) |
Disability Status by Sex by Age in Napakiak
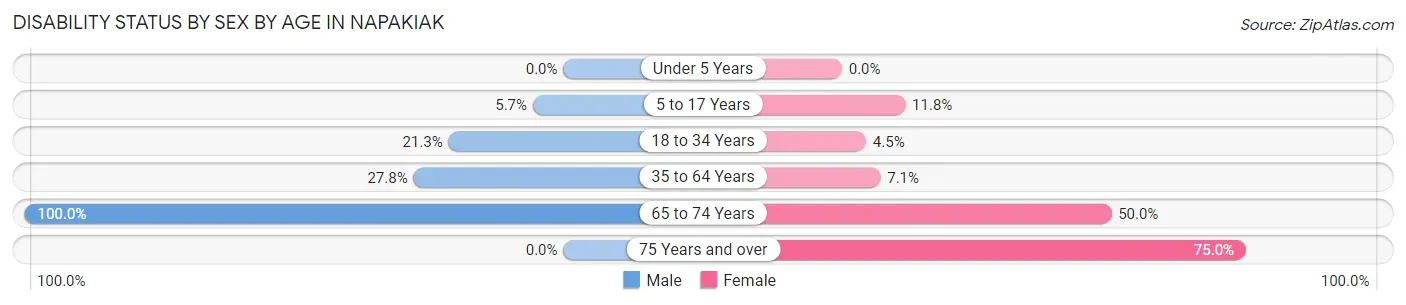
| Age Bracket | Male | Female |
| Under 5 Years | 0 (0.0%) | 0 (0.0%) |
| 5 to 17 Years | 6 (5.7%) | 14 (11.8%) |
| 18 to 34 Years | 13 (21.3%) | 3 (4.5%) |
| 35 to 64 Years | 37 (27.8%) | 7 (7.1%) |
| 65 to 74 Years | 13 (100.0%) | 8 (50.0%) |
| 75 Years and over | 0 (0.0%) | 9 (75.0%) |
Disability Class by Sex by Age in Napakiak
Disability Class: Hearing Difficulty
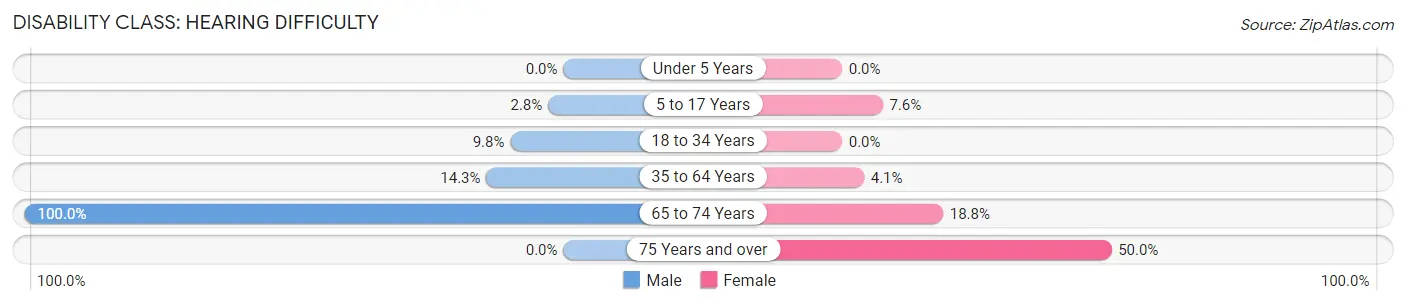
| Age Bracket | Male | Female |
| Under 5 Years | 0 (0.0%) | 0 (0.0%) |
| 5 to 17 Years | 3 (2.8%) | 9 (7.6%) |
| 18 to 34 Years | 6 (9.8%) | 0 (0.0%) |
| 35 to 64 Years | 19 (14.3%) | 4 (4.1%) |
| 65 to 74 Years | 13 (100.0%) | 3 (18.8%) |
| 75 Years and over | 0 (0.0%) | 6 (50.0%) |
Disability Class: Vision Difficulty
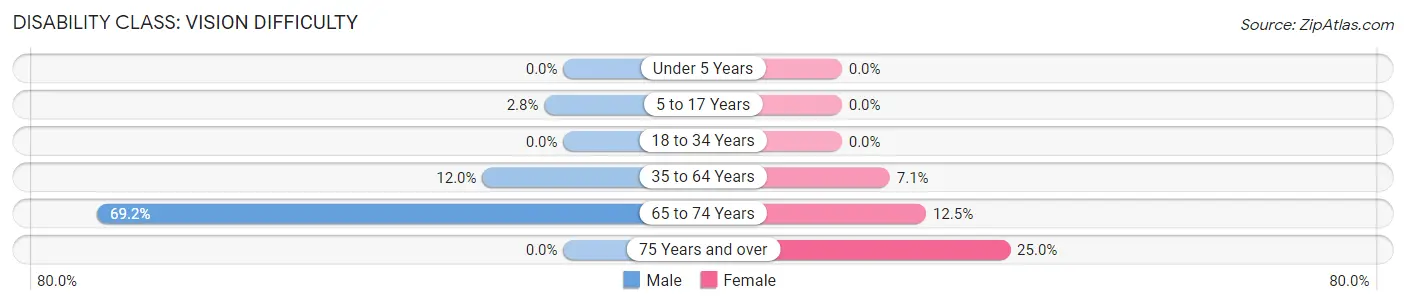
| Age Bracket | Male | Female |
| Under 5 Years | 0 (0.0%) | 0 (0.0%) |
| 5 to 17 Years | 3 (2.8%) | 0 (0.0%) |
| 18 to 34 Years | 0 (0.0%) | 0 (0.0%) |
| 35 to 64 Years | 16 (12.0%) | 7 (7.1%) |
| 65 to 74 Years | 9 (69.2%) | 2 (12.5%) |
| 75 Years and over | 0 (0.0%) | 3 (25.0%) |
Disability Class: Cognitive Difficulty
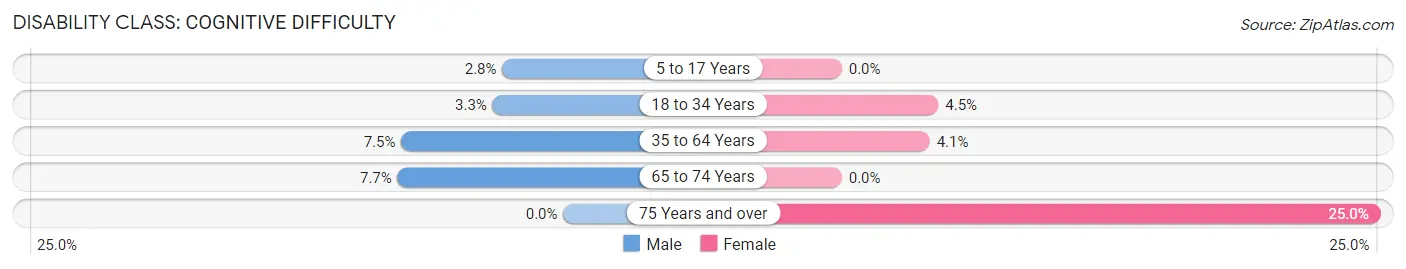
| Age Bracket | Male | Female |
| 5 to 17 Years | 3 (2.8%) | 0 (0.0%) |
| 18 to 34 Years | 2 (3.3%) | 3 (4.5%) |
| 35 to 64 Years | 10 (7.5%) | 4 (4.1%) |
| 65 to 74 Years | 1 (7.7%) | 0 (0.0%) |
| 75 Years and over | 0 (0.0%) | 3 (25.0%) |
Disability Class: Ambulatory Difficulty
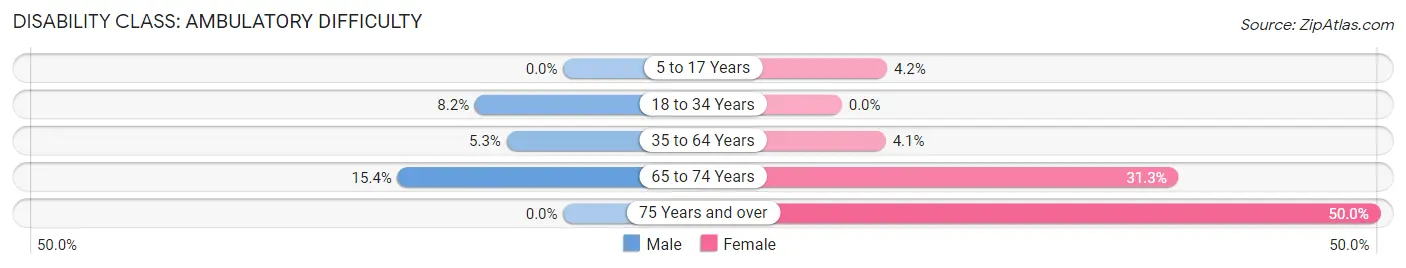
| Age Bracket | Male | Female |
| 5 to 17 Years | 0 (0.0%) | 5 (4.2%) |
| 18 to 34 Years | 5 (8.2%) | 0 (0.0%) |
| 35 to 64 Years | 7 (5.3%) | 4 (4.1%) |
| 65 to 74 Years | 2 (15.4%) | 5 (31.2%) |
| 75 Years and over | 0 (0.0%) | 6 (50.0%) |
Disability Class: Self-Care Difficulty
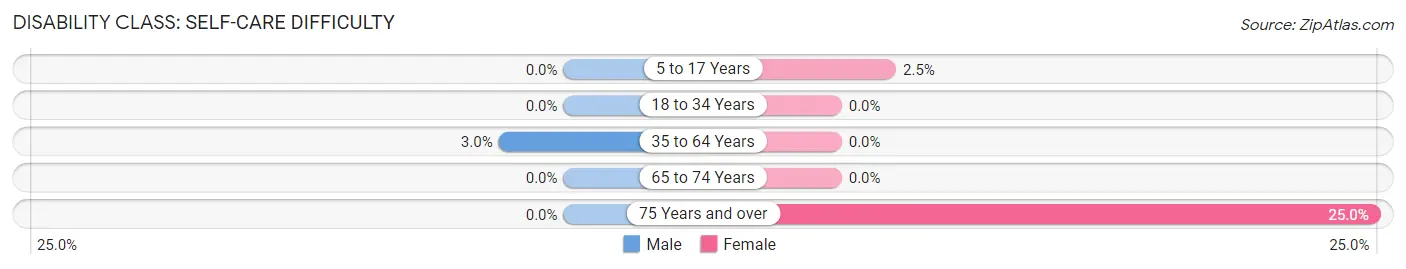
| Age Bracket | Male | Female |
| 5 to 17 Years | 0 (0.0%) | 3 (2.5%) |
| 18 to 34 Years | 0 (0.0%) | 0 (0.0%) |
| 35 to 64 Years | 4 (3.0%) | 0 (0.0%) |
| 65 to 74 Years | 0 (0.0%) | 0 (0.0%) |
| 75 Years and over | 0 (0.0%) | 3 (25.0%) |
Technology Access in Napakiak
Computing Device Access in Napakiak
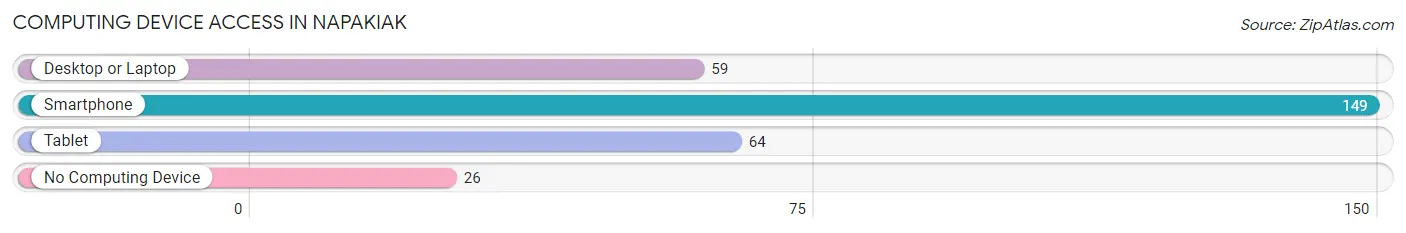
| Device Type | # Households | % Households |
| Desktop or Laptop | 59 | 33.2% |
| Smartphone | 149 | 83.7% |
| Tablet | 64 | 36.0% |
| No Computing Device | 26 | 14.6% |
| Total | 178 | 100.0% |
Internet Access in Napakiak
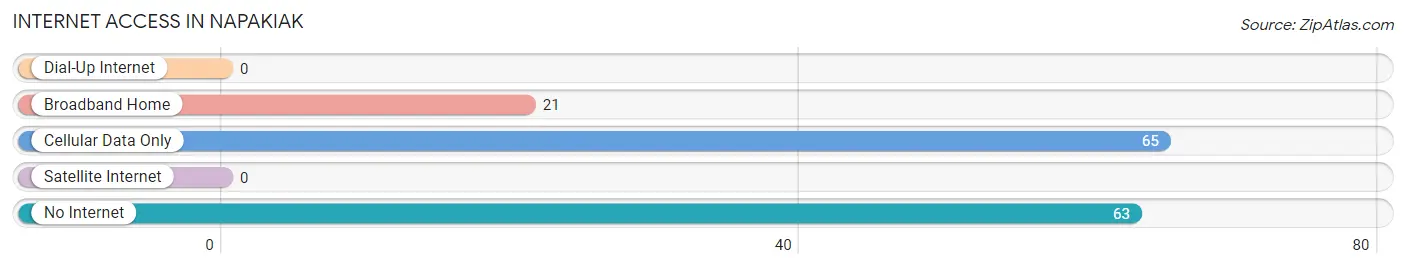
| Internet Type | # Households | % Households |
| Dial-Up Internet | 0 | 0.0% |
| Broadband Home | 21 | 11.8% |
| Cellular Data Only | 65 | 36.5% |
| Satellite Internet | 0 | 0.0% |
| No Internet | 63 | 35.4% |
| Total | 178 | 100.0% |
Napakiak Summary
History
The small village of Napakiak, Alaska is located on the Kuskokwim River, about 20 miles upstream from Bethel. It is part of the Bethel Census Area and is home to about 500 people. The village was originally inhabited by the Nunamuit people, who have lived in the area for thousands of years. The first recorded contact with Europeans was in 1851, when a Russian explorer named Ivan Petroff visited the area.
In the early 1900s, the village was established as a trading post by the Alaska Commercial Company. The trading post was a hub for the local people, who would come to trade goods and services. In the 1920s, the village was incorporated as a city.
In the 1950s, the village was connected to the outside world by the Alaska Railroad. This allowed for the development of a school, a post office, and other services. In the 1960s, the village was connected to the outside world by the Alaska Marine Highway System. This allowed for the development of a health clinic, a library, and other services.
In the 1970s, the village was connected to the outside world by the Alaska Native Claims Settlement Act. This allowed for the development of a tribal government, a tribal court, and other services.
In the 1980s, the village was connected to the outside world by the Alaska National Interest Lands Conservation Act. This allowed for the development of a fish hatchery, a fish processing plant, and other services.
In the 1990s, the village was connected to the outside world by the Alaska Native Education Act. This allowed for the development of a school, a library, and other services.
Geography
Napakiak is located on the Kuskokwim River, about 20 miles upstream from Bethel. The village is situated on a small island in the river, and is surrounded by wetlands and tundra. The climate is subarctic, with cold winters and mild summers. The average temperature in the summer is around 50°F, and in the winter it is around -20°F.
The village is accessible by air and by boat. The nearest airport is in Bethel, about 20 miles away. The village is also accessible by boat, with regular ferry service from Bethel.
Economy
The economy of Napakiak is largely based on subsistence activities, such as fishing, hunting, and gathering. The village also has a small commercial fishing industry, and some of the residents are employed in the fish processing plant. The village also has a small tourism industry, with visitors coming to experience the traditional lifestyle of the Nunamuit people.
Demographics
As of the 2010 census, the population of Napakiak was 498. The population is primarily Alaska Native, with the majority being of Yup'ik Eskimo descent. The median age is 24.7 years, and the median household income is $25,000. The village is served by the Napakiak School District, which has an enrollment of about 200 students.
Common Questions
What is Per Capita Income in Napakiak?
Per Capita income in Napakiak is $9,481.
What is the Median Family Income in Napakiak?
Median Family Income in Napakiak is $23,690.
What is the Median Household income in Napakiak?
Median Household Income in Napakiak is $23,889.
What is Income or Wage Gap in Napakiak?
Income or Wage Gap in Napakiak is 2.5%.
Women in Napakiak earn 97.5 cents for every dollar earned by a man.
What is Inequality or Gini Index in Napakiak?
Inequality or Gini Index in Napakiak is 0.53.
What is the Total Population of Napakiak?
Total Population of Napakiak is 692.
What is the Total Male Population of Napakiak?
Total Male Population of Napakiak is 343.
What is the Total Female Population of Napakiak?
Total Female Population of Napakiak is 349.
What is the Ratio of Males per 100 Females in Napakiak?
There are 98.28 Males per 100 Females in Napakiak.
What is the Ratio of Females per 100 Males in Napakiak?
There are 101.75 Females per 100 Males in Napakiak.
What is the Median Population Age in Napakiak?
Median Population Age in Napakiak is 23.0 Years.
What is the Average Family Size in Napakiak
Average Family Size in Napakiak is 4.4 People.
What is the Average Household Size in Napakiak
Average Household Size in Napakiak is 3.9 People.
How Large is the Labor Force in Napakiak?
There are 193 People in the Labor Forcein in Napakiak.
What is the Percentage of People in the Labor Force in Napakiak?
46.0% of People are in the Labor Force in Napakiak.
What is the Unemployment Rate in Napakiak?
Unemployment Rate in Napakiak is 38.9%.