Salcha, AK Map & Demographics
Salcha Map
Salcha Overview
$41,694
PER CAPITA INCOME
$84,353
AVG FAMILY INCOME
$64,044
AVG HOUSEHOLD INCOME
0.41
INEQUALITY / GINI INDEX
689
TOTAL POPULATION
413
MALE POPULATION
276
FEMALE POPULATION
149.64
MALES / 100 FEMALES
66.83
FEMALES / 100 MALES
50.7
MEDIAN AGE
2.5
AVG FAMILY SIZE
1.9
AVG HOUSEHOLD SIZE
306
LABOR FORCE [ PEOPLE ]
48.2%
PERCENT IN LABOR FORCE
Salcha Zip Codes
Salcha Area Codes
Income in Salcha
Income Overview in Salcha
Per Capita Income in Salcha is $41,694, while median incomes of families and households are $84,353 and $64,044 respectively.
| Characteristic | Number | Measure |
| Per Capita Income | 689 | $41,694 |
| Median Family Income | 201 | $84,353 |
| Mean Family Income | 201 | $99,907 |
| Median Household Income | 353 | $64,044 |
| Mean Household Income | 353 | $76,861 |
| Income Deficit | 201 | $0 |
| Wage / Income Gap (%) | 689 | 0.00% |
| Wage / Income Gap ($) | 689 | 100.00¢ per $1 |
| Gini / Inequality Index | 689 | 0.41 |
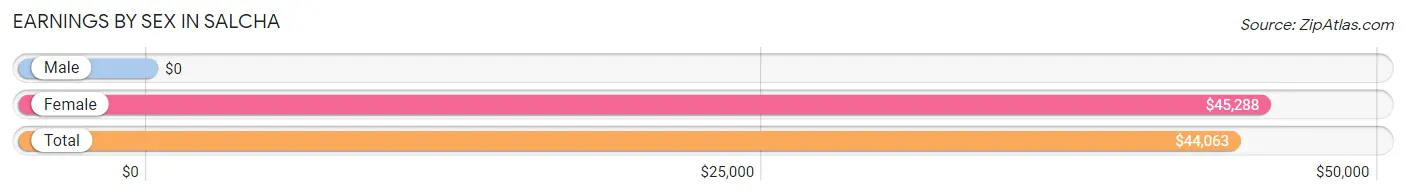
Earnings by Sex in Salcha
| Sex | Number | Average Earnings |
| Male | 264 (63.5%) | $0 |
| Female | 152 (36.5%) | $45,288 |
| Total | 416 (100.0%) | $44,063 |
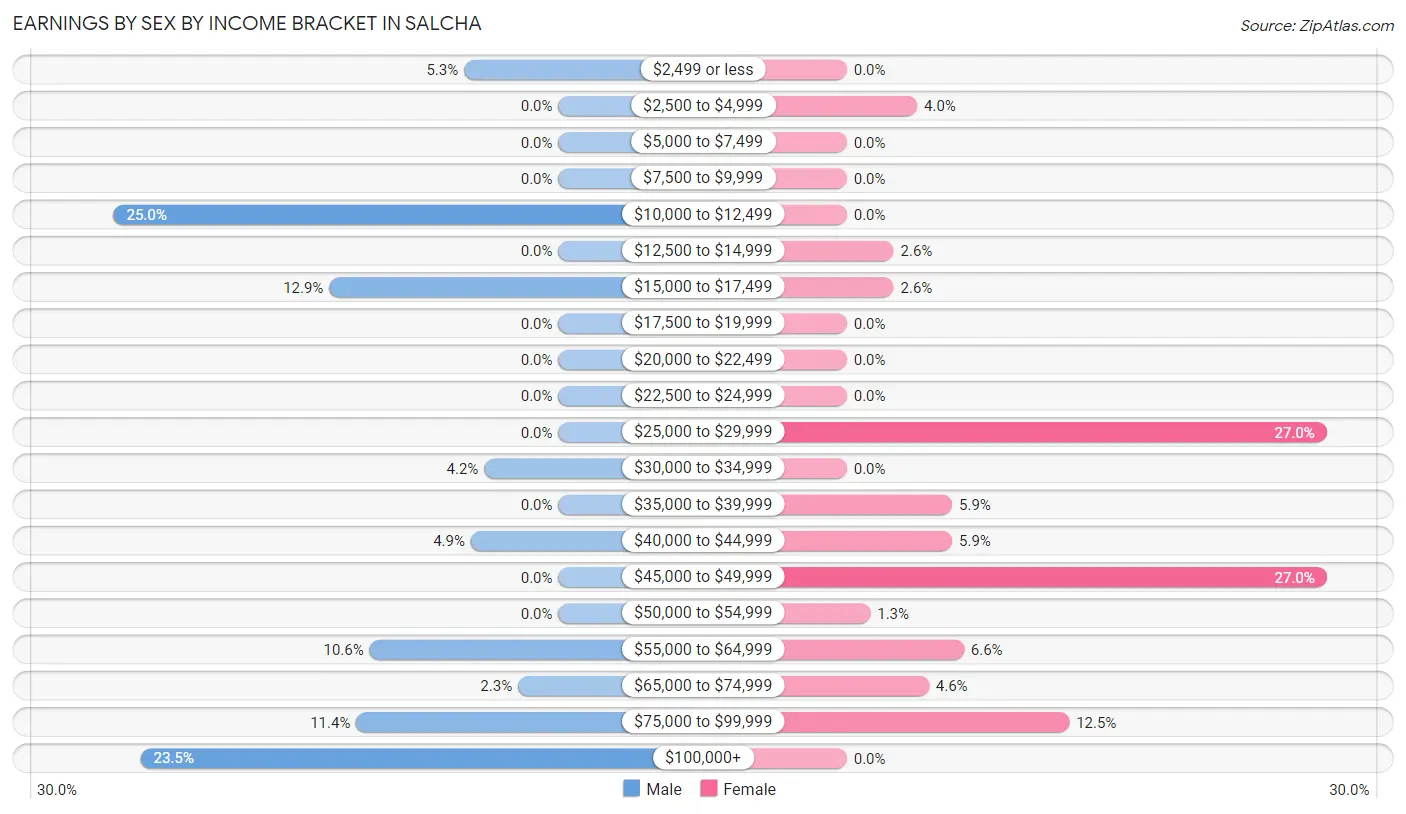
Earnings by Sex by Income Bracket in Salcha
The most common earnings brackets in Salcha are $10,000 to $12,499 for men (66 | 25.0%) and $25,000 to $29,999 for women (41 | 27.0%).
| Income | Male | Female |
| $2,499 or less | 14 (5.3%) | 0 (0.0%) |
| $2,500 to $4,999 | 0 (0.0%) | 6 (4.0%) |
| $5,000 to $7,499 | 0 (0.0%) | 0 (0.0%) |
| $7,500 to $9,999 | 0 (0.0%) | 0 (0.0%) |
| $10,000 to $12,499 | 66 (25.0%) | 0 (0.0%) |
| $12,500 to $14,999 | 0 (0.0%) | 4 (2.6%) |
| $15,000 to $17,499 | 34 (12.9%) | 4 (2.6%) |
| $17,500 to $19,999 | 0 (0.0%) | 0 (0.0%) |
| $20,000 to $22,499 | 0 (0.0%) | 0 (0.0%) |
| $22,500 to $24,999 | 0 (0.0%) | 0 (0.0%) |
| $25,000 to $29,999 | 0 (0.0%) | 41 (27.0%) |
| $30,000 to $34,999 | 11 (4.2%) | 0 (0.0%) |
| $35,000 to $39,999 | 0 (0.0%) | 9 (5.9%) |
| $40,000 to $44,999 | 13 (4.9%) | 9 (5.9%) |
| $45,000 to $49,999 | 0 (0.0%) | 41 (27.0%) |
| $50,000 to $54,999 | 0 (0.0%) | 2 (1.3%) |
| $55,000 to $64,999 | 28 (10.6%) | 10 (6.6%) |
| $65,000 to $74,999 | 6 (2.3%) | 7 (4.6%) |
| $75,000 to $99,999 | 30 (11.4%) | 19 (12.5%) |
| $100,000+ | 62 (23.5%) | 0 (0.0%) |
| Total | 264 (100.0%) | 152 (100.0%) |
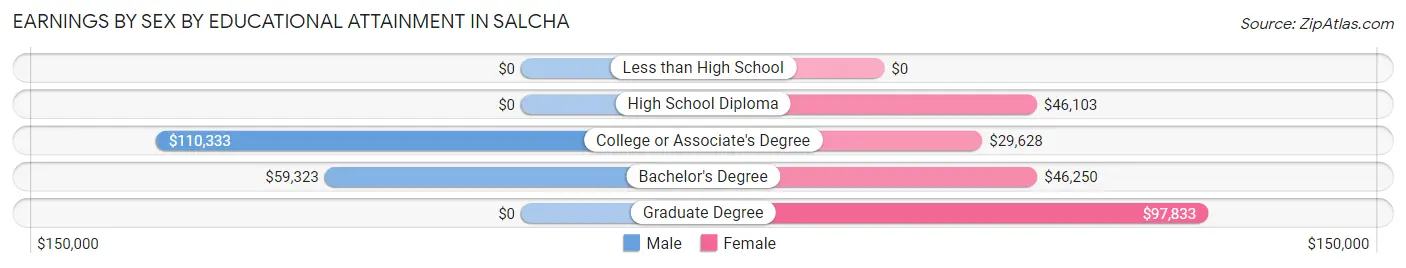
Earnings by Sex by Educational Attainment in Salcha
| Educational Attainment | Male Income | Female Income |
| Less than High School | - | - |
| High School Diploma | - | - |
| College or Associate's Degree | $110,333 | $29,628 |
| Bachelor's Degree | $59,323 | $46,250 |
| Graduate Degree | - | - |
| Total | - | - |
Family Income in Salcha
Family Income Brackets in Salcha
According to the Salcha family income data, there are 54 families falling into the $100,000 to $149,999 income range, which is the most common income bracket and makes up 26.9% of all families.
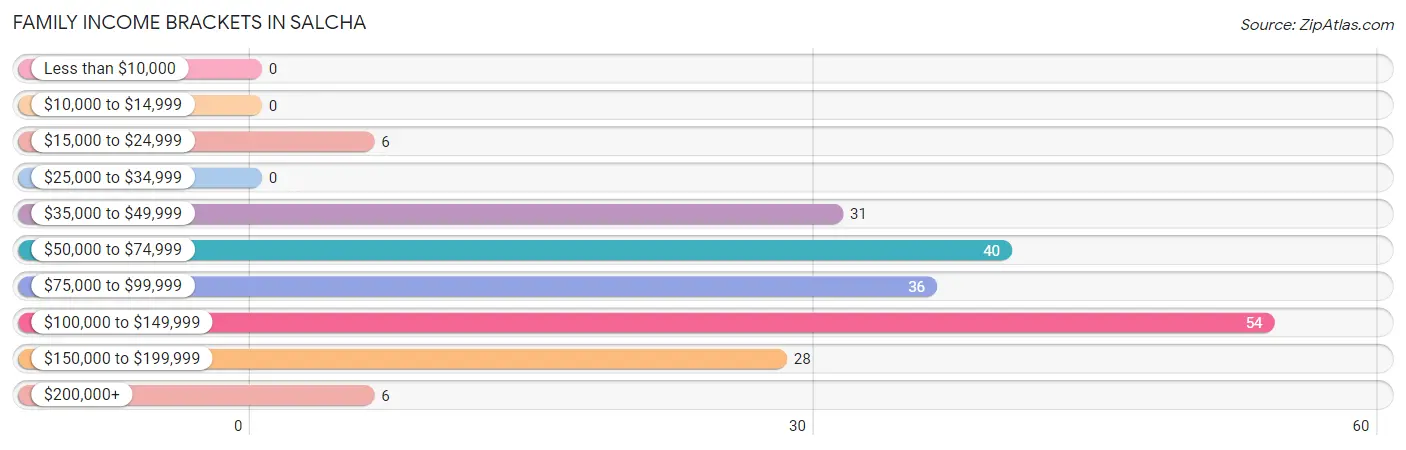
| Income Bracket | # Families | % Families |
| Less than $10,000 | 0 | 0.0% |
| $10,000 to $14,999 | 0 | 0.0% |
| $15,000 to $24,999 | 6 | 3.0% |
| $25,000 to $34,999 | 0 | 0.0% |
| $35,000 to $49,999 | 31 | 15.4% |
| $50,000 to $74,999 | 40 | 19.9% |
| $75,000 to $99,999 | 36 | 17.9% |
| $100,000 to $149,999 | 54 | 26.9% |
| $150,000 to $199,999 | 28 | 13.9% |
| $200,000+ | 6 | 3.0% |
Family Income by Famaliy Size in Salcha
2-person families (162 | 80.6%) account for the highest median family income in Salcha with $100,714 per family, while 2-person families (162 | 80.6%) have the highest median income of $50,357 per family member.
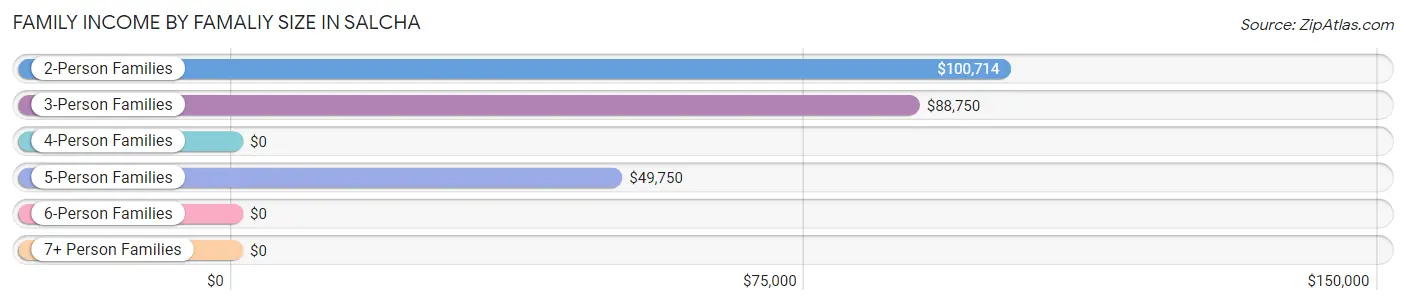
| Income Bracket | # Families | Median Income |
| 2-Person Families | 162 (80.6%) | $100,714 |
| 3-Person Families | 20 (10.0%) | $88,750 |
| 4-Person Families | 10 (5.0%) | $0 |
| 5-Person Families | 9 (4.5%) | $49,750 |
| 6-Person Families | 0 (0.0%) | $0 |
| 7+ Person Families | 0 (0.0%) | $0 |
| Total | 201 (100.0%) | $84,353 |
Family Income by Number of Earners in Salcha
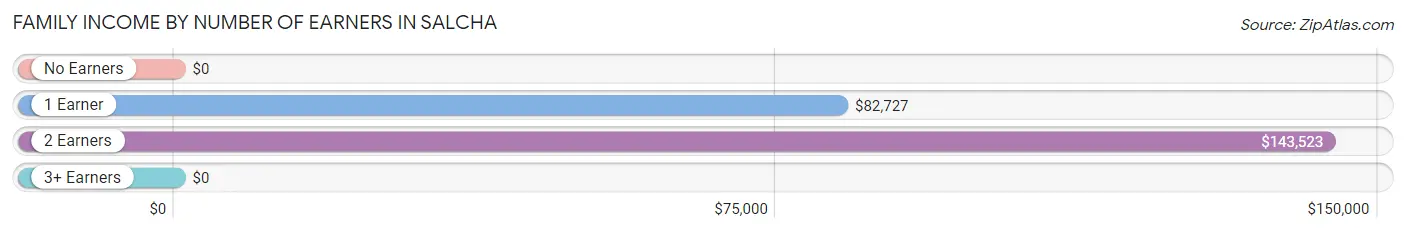
| Number of Earners | # Families | Median Income |
| No Earners | 61 (30.3%) | $0 |
| 1 Earner | 42 (20.9%) | $82,727 |
| 2 Earners | 93 (46.3%) | $143,523 |
| 3+ Earners | 5 (2.5%) | $0 |
| Total | 201 (100.0%) | $84,353 |
Household Income in Salcha
Household Income Brackets in Salcha
With 68 households falling in the category, the $100,000 to $149,999 income range is the most frequent in Salcha, accounting for 19.3% of all households. In contrast, only 5 households (1.4%) fall into the less than $10,000 income bracket, making it the least populous group.
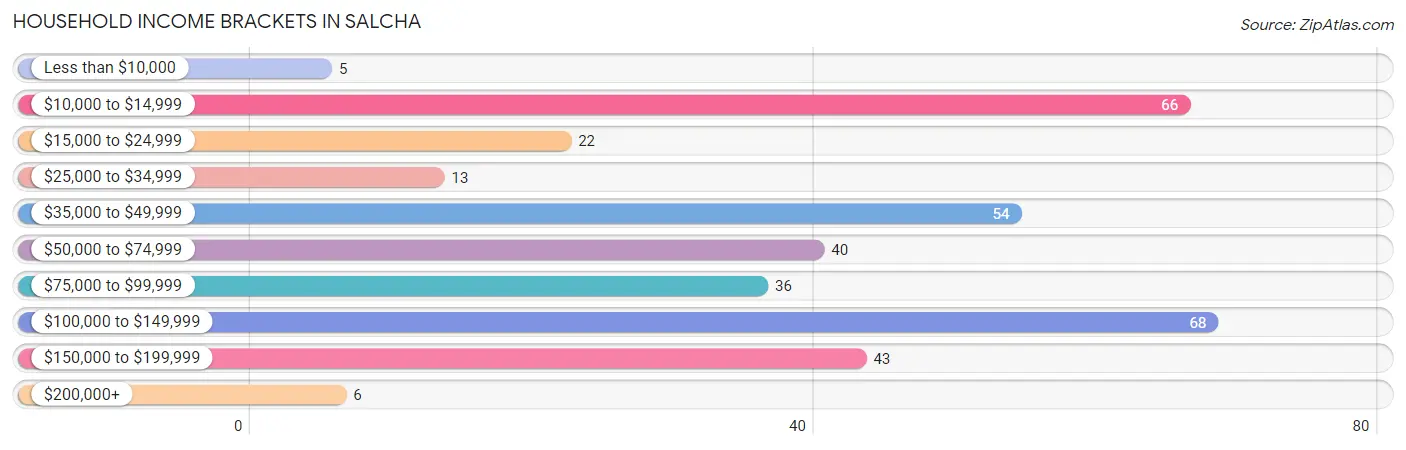
| Income Bracket | # Households | % Households |
| Less than $10,000 | 5 | 1.4% |
| $10,000 to $14,999 | 66 | 18.7% |
| $15,000 to $24,999 | 22 | 6.2% |
| $25,000 to $34,999 | 13 | 3.7% |
| $35,000 to $49,999 | 54 | 15.3% |
| $50,000 to $74,999 | 40 | 11.3% |
| $75,000 to $99,999 | 36 | 10.2% |
| $100,000 to $149,999 | 68 | 19.3% |
| $150,000 to $199,999 | 43 | 12.2% |
| $200,000+ | 6 | 1.7% |
Household Income by Householder Age in Salcha
The median household income in Salcha is $64,044, with the highest median household income of $115,250 found in the 25 to 44 years age bracket for the primary householder. A total of 111 households (31.4%) fall into this category.
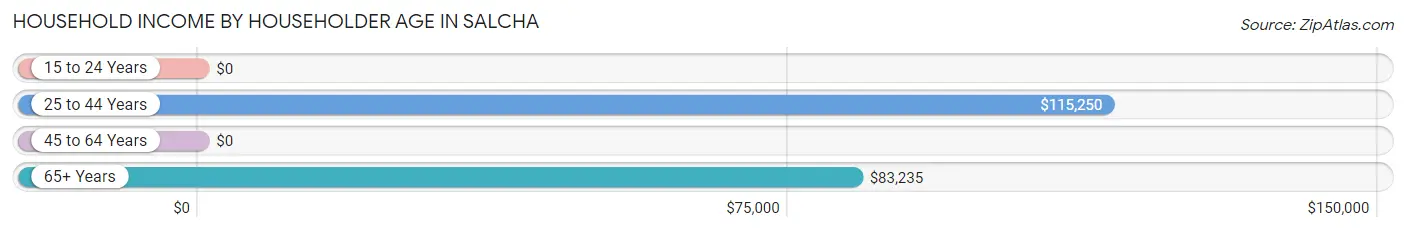
| Income Bracket | # Households | Median Income |
| 15 to 24 Years | 0 (0.0%) | $0 |
| 25 to 44 Years | 111 (31.4%) | $115,250 |
| 45 to 64 Years | 188 (53.3%) | $0 |
| 65+ Years | 54 (15.3%) | $83,235 |
| Total | 353 (100.0%) | $64,044 |
Poverty in Salcha
Income Below Poverty by Sex and Age in Salcha
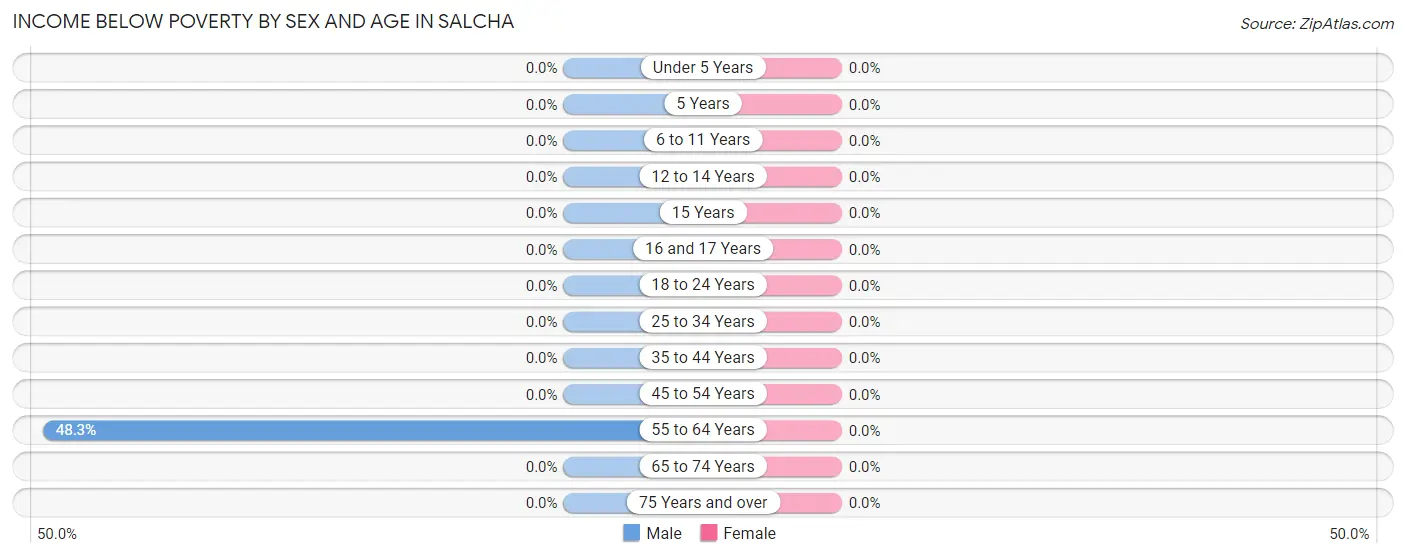
| Age Bracket | Male | Female |
| Under 5 Years | 0 (0.0%) | 0 (0.0%) |
| 5 Years | 0 (0.0%) | 0 (0.0%) |
| 6 to 11 Years | 0 (0.0%) | 0 (0.0%) |
| 12 to 14 Years | 0 (0.0%) | 0 (0.0%) |
| 15 Years | 0 (0.0%) | 0 (0.0%) |
| 16 and 17 Years | 0 (0.0%) | 0 (0.0%) |
| 18 to 24 Years | 0 (0.0%) | 0 (0.0%) |
| 25 to 34 Years | 0 (0.0%) | 0 (0.0%) |
| 35 to 44 Years | 0 (0.0%) | 0 (0.0%) |
| 45 to 54 Years | 0 (0.0%) | 0 (0.0%) |
| 55 to 64 Years | 71 (48.3%) | 0 (0.0%) |
| 65 to 74 Years | 0 (0.0%) | 0 (0.0%) |
| 75 Years and over | 0 (0.0%) | 0 (0.0%) |
| Total | 71 (17.2%) | 0 (0.0%) |
Income Above Poverty by Sex and Age in Salcha
According to the poverty statistics in Salcha, males aged 6 to 11 years and females aged 6 to 11 years are the age groups that are most secure financially, with 100.0% of males and 100.0% of females in these age groups living above the poverty line.
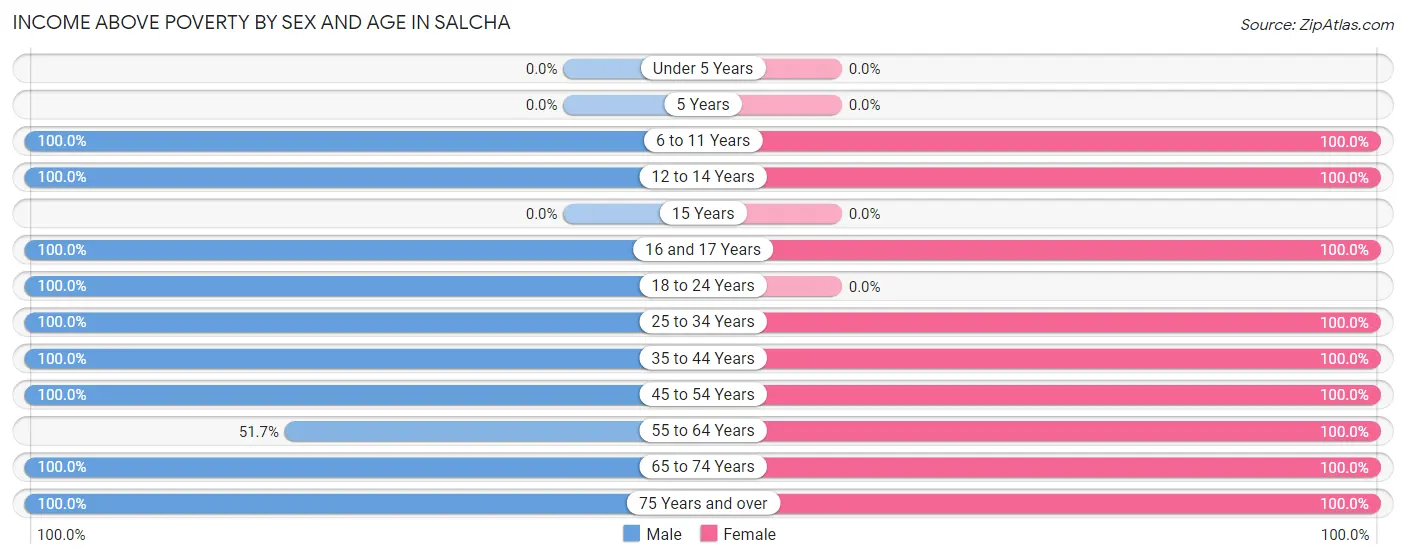
| Age Bracket | Male | Female |
| Under 5 Years | 0 (0.0%) | 0 (0.0%) |
| 5 Years | 0 (0.0%) | 0 (0.0%) |
| 6 to 11 Years | 21 (100.0%) | 4 (100.0%) |
| 12 to 14 Years | 23 (100.0%) | 6 (100.0%) |
| 15 Years | 0 (0.0%) | 0 (0.0%) |
| 16 and 17 Years | 11 (100.0%) | 2 (100.0%) |
| 18 to 24 Years | 12 (100.0%) | 0 (0.0%) |
| 25 to 34 Years | 64 (100.0%) | 86 (100.0%) |
| 35 to 44 Years | 58 (100.0%) | 36 (100.0%) |
| 45 to 54 Years | 29 (100.0%) | 39 (100.0%) |
| 55 to 64 Years | 76 (51.7%) | 55 (100.0%) |
| 65 to 74 Years | 40 (100.0%) | 39 (100.0%) |
| 75 Years and over | 8 (100.0%) | 9 (100.0%) |
| Total | 342 (82.8%) | 276 (100.0%) |
Income Below Poverty Among Married-Couple Families in Salcha
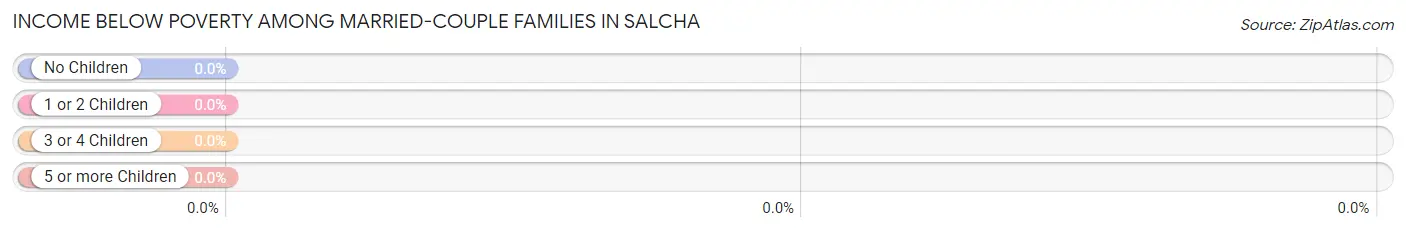
| Children | Above Poverty | Below Poverty |
| No Children | 154 (100.0%) | 0 (0.0%) |
| 1 or 2 Children | 4 (100.0%) | 0 (0.0%) |
| 3 or 4 Children | 8 (100.0%) | 0 (0.0%) |
| 5 or more Children | 0 (0.0%) | 0 (0.0%) |
| Total | 166 (100.0%) | 0 (0.0%) |
Income Below Poverty Among Single-Parent Households in Salcha
| Children | Single Father | Single Mother |
| No Children | 0 (0.0%) | 0 (0.0%) |
| 1 or 2 Children | 0 (0.0%) | 0 (0.0%) |
| 3 or 4 Children | 0 (0.0%) | 0 (0.0%) |
| 5 or more Children | 0 (0.0%) | 0 (0.0%) |
| Total | 0 (0.0%) | 0 (0.0%) |
Income Below Poverty Among Married-Couple vs Single-Parent Households in Salcha
| Children | Married-Couple Families | Single-Parent Households |
| No Children | 0 (0.0%) | 0 (0.0%) |
| 1 or 2 Children | 0 (0.0%) | 0 (0.0%) |
| 3 or 4 Children | 0 (0.0%) | 0 (0.0%) |
| 5 or more Children | 0 (0.0%) | 0 (0.0%) |
| Total | 0 (0.0%) | 0 (0.0%) |
Race in Salcha
The most populous races in Salcha are White / Caucasian (612 | 88.8%), Native / Alaskan (41 | 5.9%), and Two or more Races (36 | 5.2%).
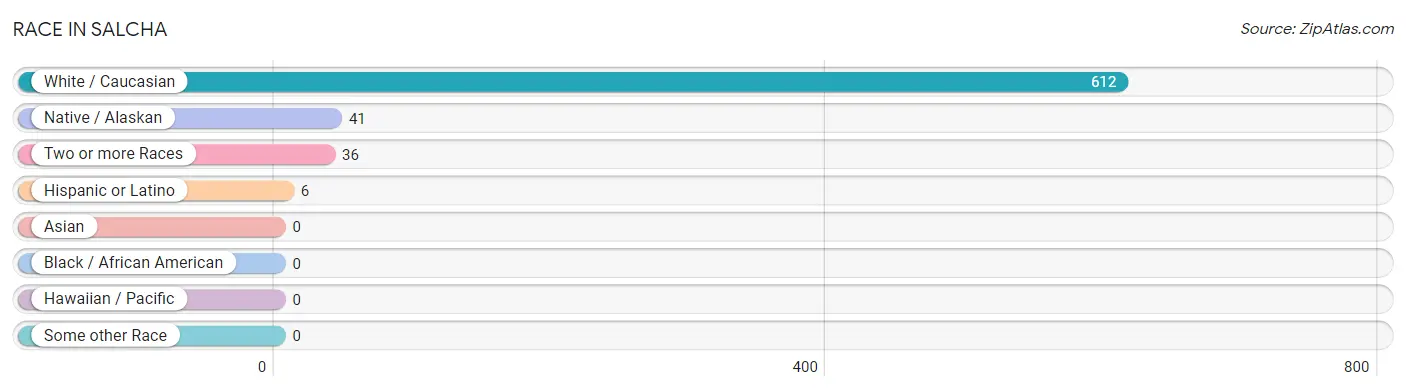
| Race | # Population | % Population |
| Asian | 0 | 0.0% |
| Black / African American | 0 | 0.0% |
| Hawaiian / Pacific | 0 | 0.0% |
| Hispanic or Latino | 6 | 0.9% |
| Native / Alaskan | 41 | 5.9% |
| White / Caucasian | 612 | 88.8% |
| Two or more Races | 36 | 5.2% |
| Some other Race | 0 | 0.0% |
| Total | 689 | 100.0% |
Ancestry in Salcha
The most populous ancestries reported in Salcha are German (110 | 16.0%), Norwegian (93 | 13.5%), English (92 | 13.4%), Irish (87 | 12.6%), and European (40 | 5.8%), together accounting for 61.3% of all Salcha residents.
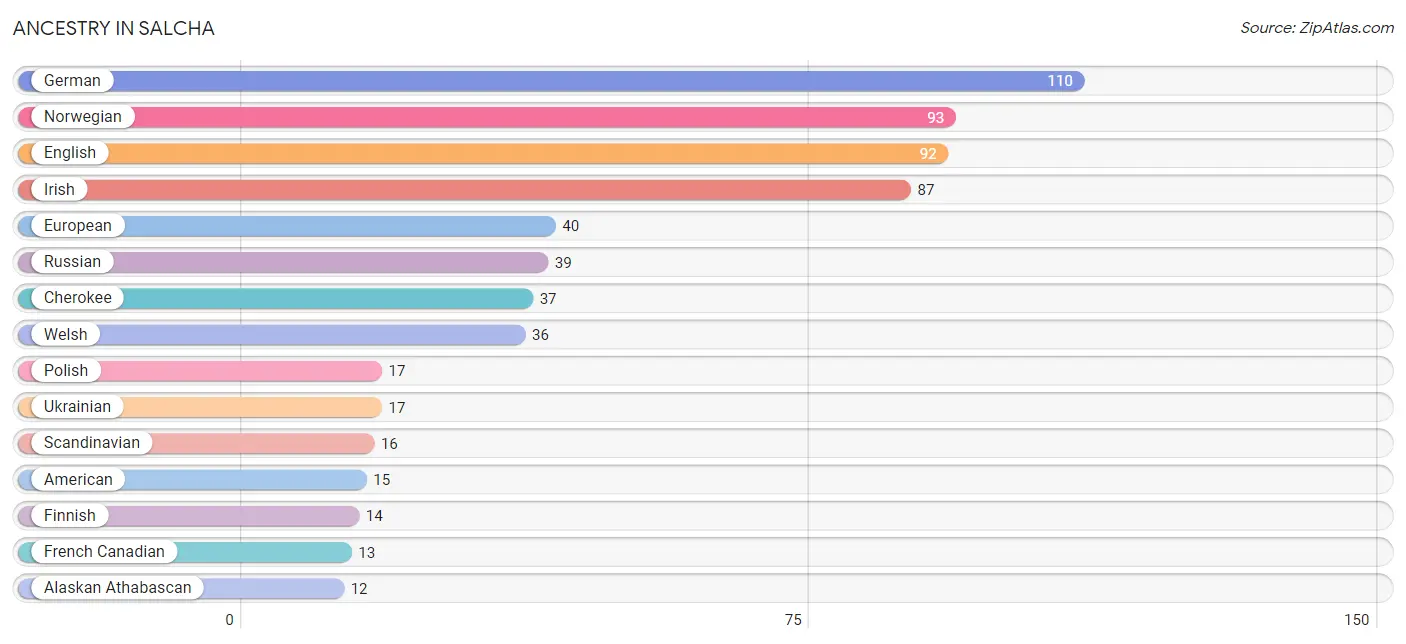
| Ancestry | # Population | % Population |
| Alaska Native | 6 | 0.9% |
| Alaskan Athabascan | 12 | 1.7% |
| American | 15 | 2.2% |
| Austrian | 8 | 1.2% |
| British | 10 | 1.5% |
| Cherokee | 37 | 5.4% |
| Danish | 6 | 0.9% |
| English | 92 | 13.4% |
| European | 40 | 5.8% |
| Finnish | 14 | 2.0% |
| French | 12 | 1.7% |
| French Canadian | 13 | 1.9% |
| German | 110 | 16.0% |
| Irish | 87 | 12.6% |
| Italian | 1 | 0.2% |
| Mexican | 6 | 0.9% |
| Northern European | 3 | 0.4% |
| Norwegian | 93 | 13.5% |
| Polish | 17 | 2.5% |
| Russian | 39 | 5.7% |
| Scandinavian | 16 | 2.3% |
| Swedish | 7 | 1.0% |
| Ukrainian | 17 | 2.5% |
| Welsh | 36 | 5.2% | View All 24 Rows |
Immigrants in Salcha
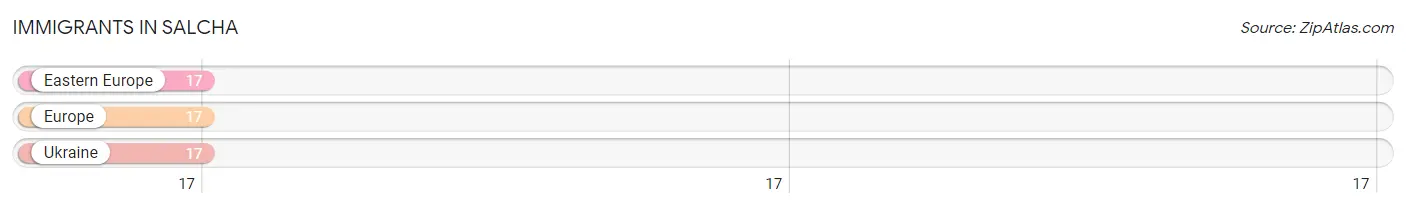
The most numerous immigrant groups reported in Salcha came from Eastern Europe (17 | 2.5%), Europe (17 | 2.5%), and Ukraine (17 | 2.5%), together accounting for 7.4% of all Salcha residents.
| Immigration Origin | # Population | % Population |
| Eastern Europe | 17 | 2.5% |
| Europe | 17 | 2.5% |
| Ukraine | 17 | 2.5% | View All 3 Rows |
Sex and Age in Salcha
Sex and Age in Salcha
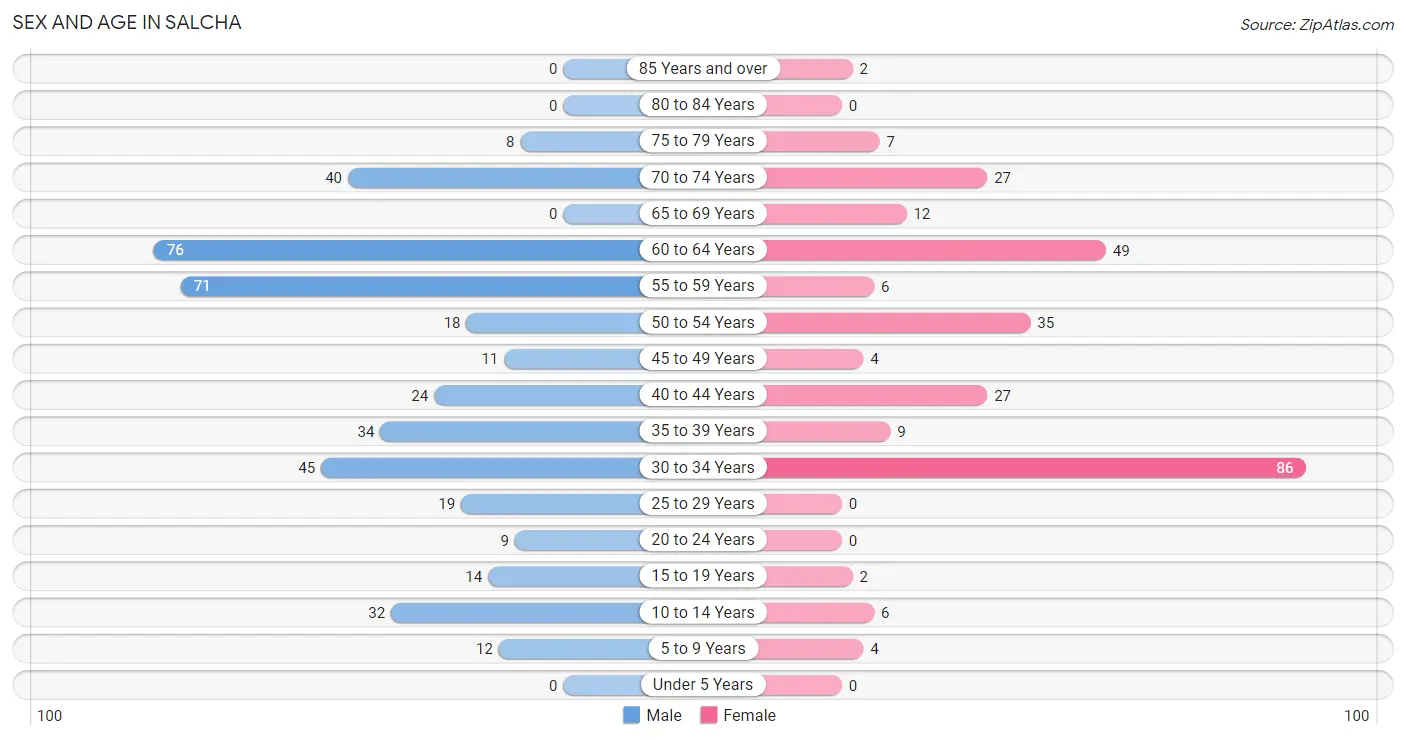
The most populous age groups in Salcha are 60 to 64 Years (76 | 18.4%) for men and 30 to 34 Years (86 | 31.2%) for women.
| Age Bracket | Male | Female |
| Under 5 Years | 0 (0.0%) | 0 (0.0%) |
| 5 to 9 Years | 12 (2.9%) | 4 (1.5%) |
| 10 to 14 Years | 32 (7.7%) | 6 (2.2%) |
| 15 to 19 Years | 14 (3.4%) | 2 (0.7%) |
| 20 to 24 Years | 9 (2.2%) | 0 (0.0%) |
| 25 to 29 Years | 19 (4.6%) | 0 (0.0%) |
| 30 to 34 Years | 45 (10.9%) | 86 (31.2%) |
| 35 to 39 Years | 34 (8.2%) | 9 (3.3%) |
| 40 to 44 Years | 24 (5.8%) | 27 (9.8%) |
| 45 to 49 Years | 11 (2.7%) | 4 (1.5%) |
| 50 to 54 Years | 18 (4.4%) | 35 (12.7%) |
| 55 to 59 Years | 71 (17.2%) | 6 (2.2%) |
| 60 to 64 Years | 76 (18.4%) | 49 (17.7%) |
| 65 to 69 Years | 0 (0.0%) | 12 (4.3%) |
| 70 to 74 Years | 40 (9.7%) | 27 (9.8%) |
| 75 to 79 Years | 8 (1.9%) | 7 (2.5%) |
| 80 to 84 Years | 0 (0.0%) | 0 (0.0%) |
| 85 Years and over | 0 (0.0%) | 2 (0.7%) |
| Total | 413 (100.0%) | 276 (100.0%) |
Families and Households in Salcha
Median Family Size in Salcha
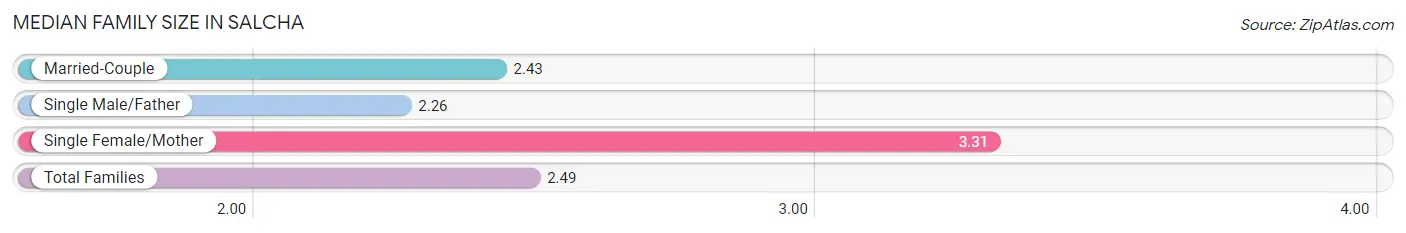
The median family size in Salcha is 2.49 persons per family, with single female/mother families (16 | 8.0%) accounting for the largest median family size of 3.31 persons per family. On the other hand, single male/father families (19 | 9.5%) represent the smallest median family size with 2.26 persons per family.
| Family Type | # Families | Family Size |
| Married-Couple | 166 (82.6%) | 2.43 |
| Single Male/Father | 19 (9.5%) | 2.26 |
| Single Female/Mother | 16 (8.0%) | 3.31 |
| Total Families | 201 (100.0%) | 2.49 |
Median Household Size in Salcha
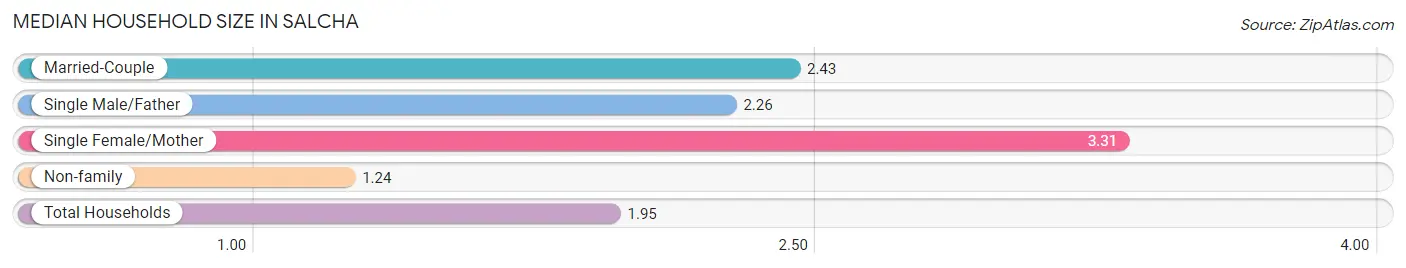
The median household size in Salcha is 1.95 persons per household, with single female/mother households (16 | 4.5%) accounting for the largest median household size of 3.31 persons per household. non-family households (152 | 43.1%) represent the smallest median household size with 1.24 persons per household.
| Household Type | # Households | Household Size |
| Married-Couple | 166 (47.0%) | 2.43 |
| Single Male/Father | 19 (5.4%) | 2.26 |
| Single Female/Mother | 16 (4.5%) | 3.31 |
| Non-family | 152 (43.1%) | 1.24 |
| Total Households | 353 (100.0%) | 1.95 |
Household Size by Marriage Status in Salcha
Out of a total of 353 households in Salcha, 201 (56.9%) are family households, while 152 (43.1%) are nonfamily households. The most numerous type of family households are 2-person households, comprising 162, and the most common type of nonfamily households are 1-person households, comprising 143.
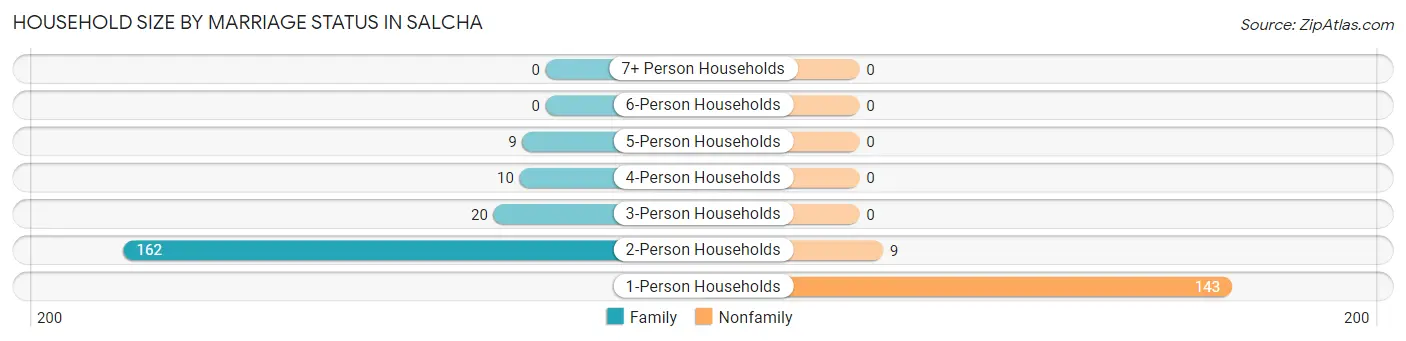
| Household Size | Family Households | Nonfamily Households |
| 1-Person Households | - | 143 (40.5%) |
| 2-Person Households | 162 (45.9%) | 9 (2.5%) |
| 3-Person Households | 20 (5.7%) | 0 (0.0%) |
| 4-Person Households | 10 (2.8%) | 0 (0.0%) |
| 5-Person Households | 9 (2.5%) | 0 (0.0%) |
| 6-Person Households | 0 (0.0%) | 0 (0.0%) |
| 7+ Person Households | 0 (0.0%) | 0 (0.0%) |
| Total | 201 (56.9%) | 152 (43.1%) |
Female Fertility in Salcha
Fertility by Age in Salcha
| Age Bracket | Women with Births | Births / 1,000 Women |
| 15 to 19 years | 0 (0.0%) | 0.0 |
| 20 to 34 years | 0 (0.0%) | 0.0 |
| 35 to 50 years | 0 (0.0%) | 0.0 |
| Total | 0 (0.0%) | 0.0 |
Fertility by Age by Marriage Status in Salcha
| Age Bracket | Married | Unmarried |
| 15 to 19 years | 0 (0.0%) | 0 (0.0%) |
| 20 to 34 years | 0 (0.0%) | 0 (0.0%) |
| 35 to 50 years | 0 (0.0%) | 0 (0.0%) |
| Total | 0 (0.0%) | 0 (0.0%) |
Fertility by Education in Salcha
| Educational Attainment | Women with Births | Births / 1,000 Women |
| Less than High School | 0 (0.0%) | 0.0 |
| High School Diploma | 0 (0.0%) | 0.0 |
| College or Associate's Degree | 0 (0.0%) | 0.0 |
| Bachelor's Degree | 0 (0.0%) | 0.0 |
| Graduate Degree | 0 (0.0%) | 0.0 |
| Total | 0 (0.0%) | 0.0 |
Fertility by Education by Marriage Status in Salcha
| Educational Attainment | Married | Unmarried |
| Less than High School | 0 (0.0%) | 0 (0.0%) |
| High School Diploma | 0 (0.0%) | 0 (0.0%) |
| College or Associate's Degree | 0 (0.0%) | 0 (0.0%) |
| Bachelor's Degree | 0 (0.0%) | 0 (0.0%) |
| Graduate Degree | 0 (0.0%) | 0 (0.0%) |
| Total | 0 (0.0%) | 0 (0.0%) |
Employment Characteristics in Salcha
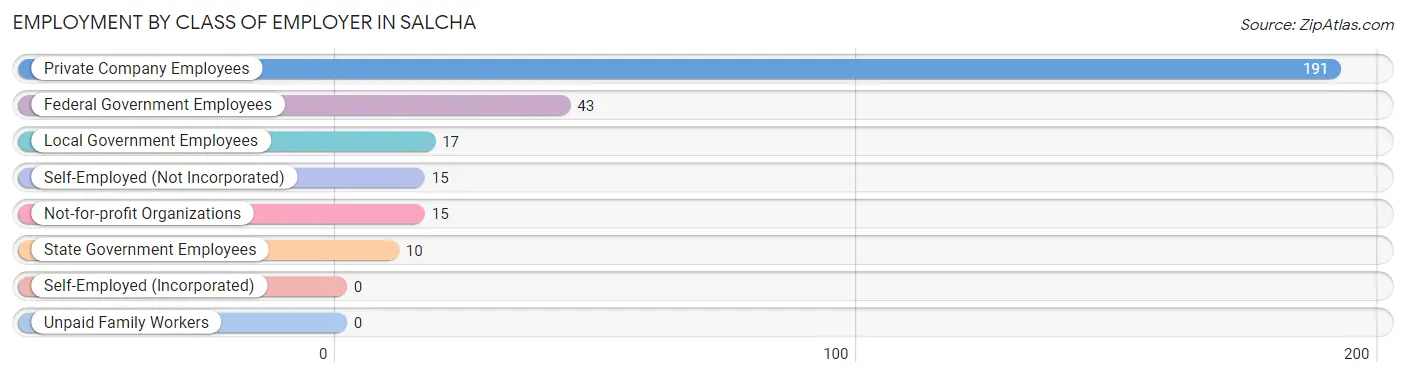
Employment by Class of Employer in Salcha
Among the 291 employed individuals in Salcha, private company employees (191 | 65.6%), federal government employees (43 | 14.8%), and local government employees (17 | 5.8%) make up the most common classes of employment.
| Employer Class | # Employees | % Employees |
| Private Company Employees | 191 | 65.6% |
| Self-Employed (Incorporated) | 0 | 0.0% |
| Self-Employed (Not Incorporated) | 15 | 5.1% |
| Not-for-profit Organizations | 15 | 5.1% |
| Local Government Employees | 17 | 5.8% |
| State Government Employees | 10 | 3.4% |
| Federal Government Employees | 43 | 14.8% |
| Unpaid Family Workers | 0 | 0.0% |
| Total | 291 | 100.0% |
Employment Status by Age in Salcha
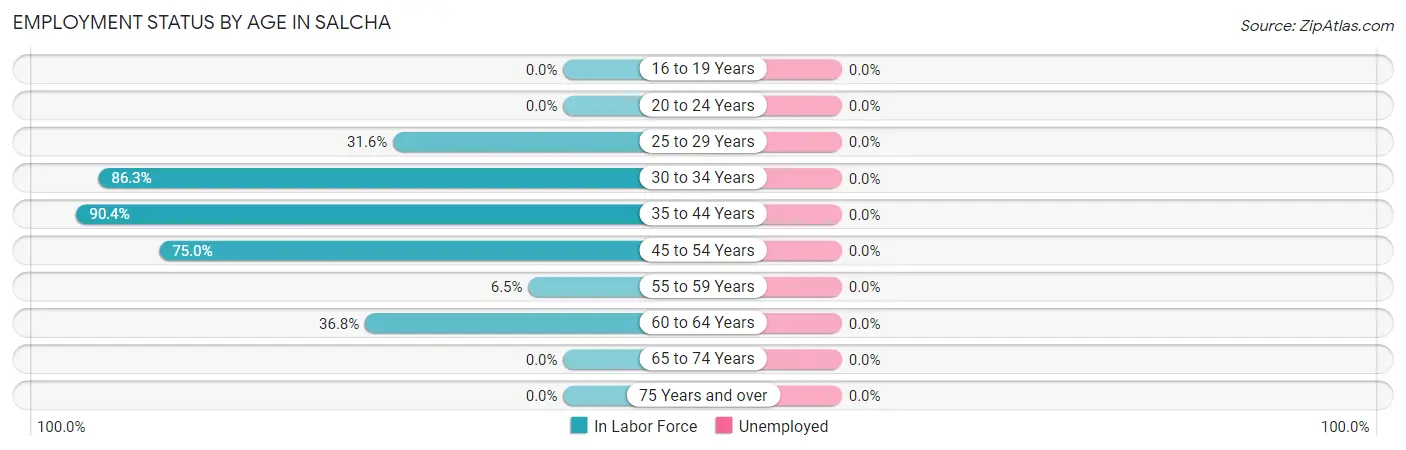
| Age Bracket | In Labor Force | Unemployed |
| 16 to 19 Years | 0 (0.0%) | 0 (0.0%) |
| 20 to 24 Years | 0 (0.0%) | 0 (0.0%) |
| 25 to 29 Years | 6 (31.6%) | 0 (0.0%) |
| 30 to 34 Years | 113 (86.3%) | 0 (0.0%) |
| 35 to 44 Years | 85 (90.4%) | 0 (0.0%) |
| 45 to 54 Years | 51 (75.0%) | 0 (0.0%) |
| 55 to 59 Years | 5 (6.5%) | 0 (0.0%) |
| 60 to 64 Years | 46 (36.8%) | 0 (0.0%) |
| 65 to 74 Years | 0 (0.0%) | 0 (0.0%) |
| 75 Years and over | 0 (0.0%) | 0 (0.0%) |
| Total | 306 (48.2%) | 0 (0.0%) |
Employment Status by Educational Attainment in Salcha
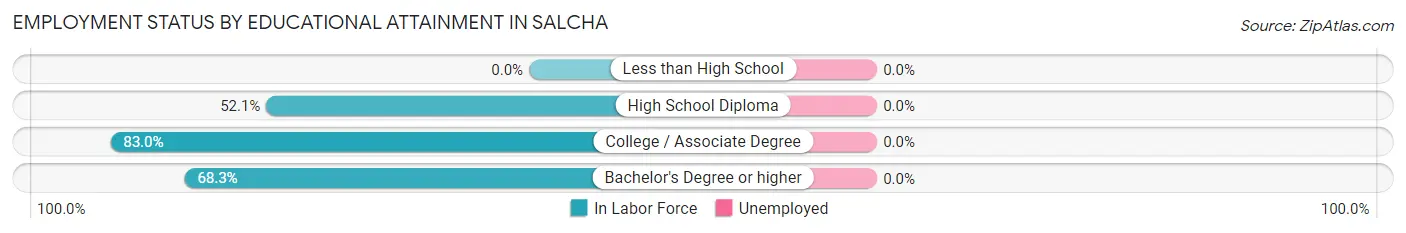
| Educational Attainment | In Labor Force | Unemployed |
| Less than High School | 0 (0.0%) | 0 (0.0%) |
| High School Diploma | 62 (52.1%) | 0 (0.0%) |
| College / Associate Degree | 132 (83.0%) | 0 (0.0%) |
| Bachelor's Degree or higher | 112 (68.3%) | 0 (0.0%) |
| Total | 306 (59.5%) | 0 (0.0%) |
Employment Occupations by Sex in Salcha
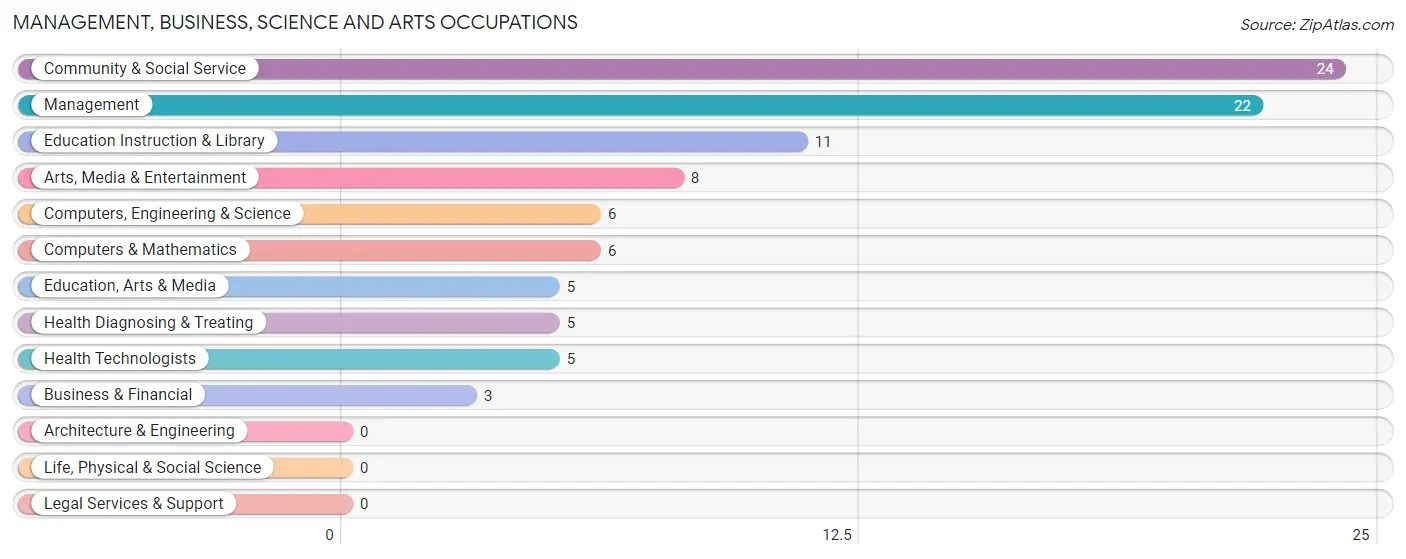
Management, Business, Science and Arts Occupations
The most common Management, Business, Science and Arts occupations in Salcha are Community & Social Service (24 | 8.3%), Management (22 | 7.6%), Education Instruction & Library (11 | 3.8%), Arts, Media & Entertainment (8 | 2.8%), and Computers, Engineering & Science (6 | 2.1%).
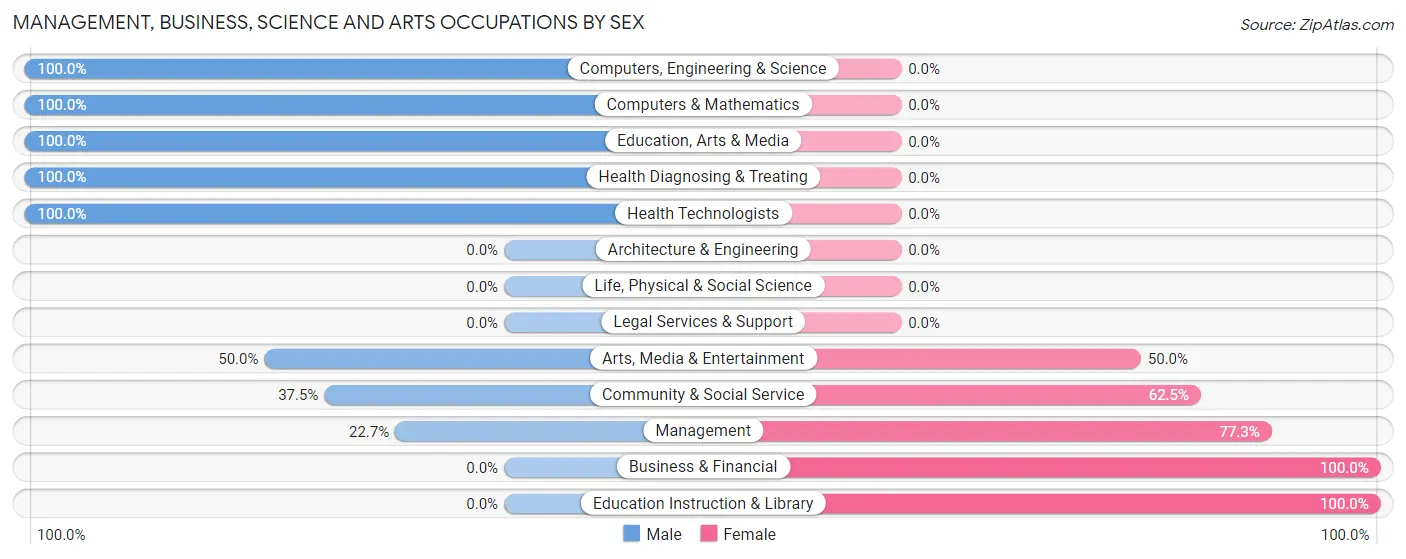
Management, Business, Science and Arts Occupations by Sex
Within the Management, Business, Science and Arts occupations in Salcha, the most male-oriented occupations are Computers, Engineering & Science (100.0%), Computers & Mathematics (100.0%), and Education, Arts & Media (100.0%), while the most female-oriented occupations are Business & Financial (100.0%), Education Instruction & Library (100.0%), and Management (77.3%).
| Occupation | Male | Female |
| Management | 5 (22.7%) | 17 (77.3%) |
| Business & Financial | 0 (0.0%) | 3 (100.0%) |
| Computers, Engineering & Science | 6 (100.0%) | 0 (0.0%) |
| Computers & Mathematics | 6 (100.0%) | 0 (0.0%) |
| Architecture & Engineering | 0 (0.0%) | 0 (0.0%) |
| Life, Physical & Social Science | 0 (0.0%) | 0 (0.0%) |
| Community & Social Service | 9 (37.5%) | 15 (62.5%) |
| Education, Arts & Media | 5 (100.0%) | 0 (0.0%) |
| Legal Services & Support | 0 (0.0%) | 0 (0.0%) |
| Education Instruction & Library | 0 (0.0%) | 11 (100.0%) |
| Arts, Media & Entertainment | 4 (50.0%) | 4 (50.0%) |
| Health Diagnosing & Treating | 5 (100.0%) | 0 (0.0%) |
| Health Technologists | 5 (100.0%) | 0 (0.0%) |
| Total (Category) | 25 (41.7%) | 35 (58.3%) |
| Total (Overall) | 155 (53.8%) | 133 (46.2%) |
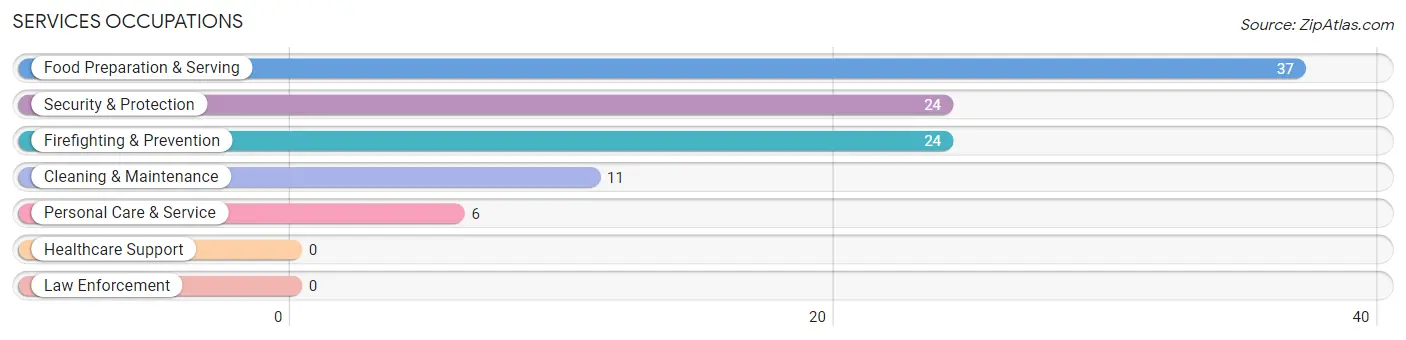
Services Occupations
The most common Services occupations in Salcha are Food Preparation & Serving (37 | 12.9%), Security & Protection (24 | 8.3%), Firefighting & Prevention (24 | 8.3%), Cleaning & Maintenance (11 | 3.8%), and Personal Care & Service (6 | 2.1%).
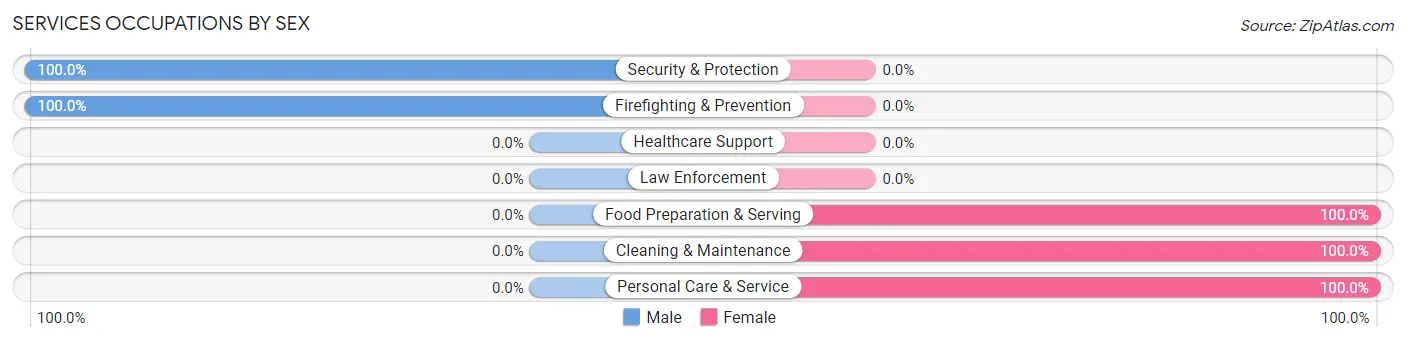
Services Occupations by Sex
Within the Services occupations in Salcha, the most male-oriented occupations are Security & Protection (100.0%), and Firefighting & Prevention (100.0%), while the most female-oriented occupations are Food Preparation & Serving (100.0%), Cleaning & Maintenance (100.0%), and Personal Care & Service (100.0%).
| Occupation | Male | Female |
| Healthcare Support | 0 (0.0%) | 0 (0.0%) |
| Security & Protection | 24 (100.0%) | 0 (0.0%) |
| Firefighting & Prevention | 24 (100.0%) | 0 (0.0%) |
| Law Enforcement | 0 (0.0%) | 0 (0.0%) |
| Food Preparation & Serving | 0 (0.0%) | 37 (100.0%) |
| Cleaning & Maintenance | 0 (0.0%) | 11 (100.0%) |
| Personal Care & Service | 0 (0.0%) | 6 (100.0%) |
| Total (Category) | 24 (30.8%) | 54 (69.2%) |
| Total (Overall) | 155 (53.8%) | 133 (46.2%) |
Sales and Office Occupations
The most common Sales and Office occupations in Salcha are Office & Administration (35 | 12.1%), and Sales & Related (33 | 11.5%).
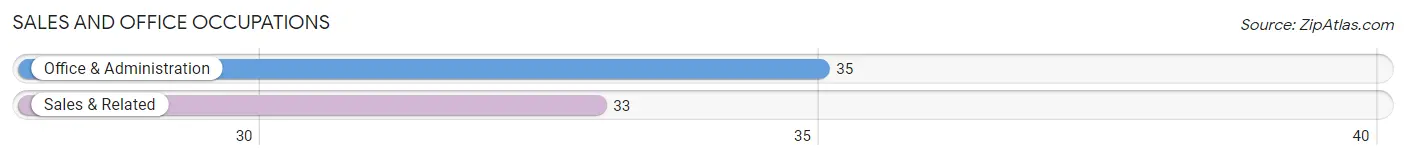
Sales and Office Occupations by Sex
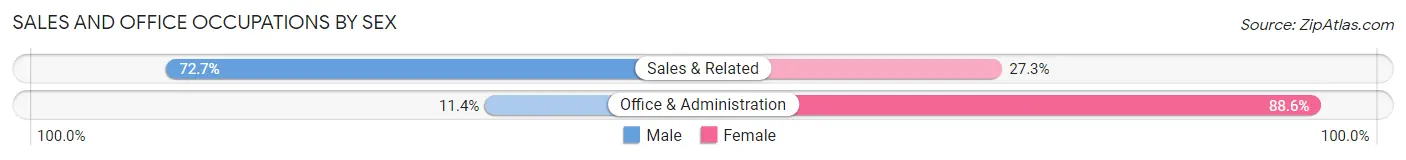
| Occupation | Male | Female |
| Sales & Related | 24 (72.7%) | 9 (27.3%) |
| Office & Administration | 4 (11.4%) | 31 (88.6%) |
| Total (Category) | 28 (41.2%) | 40 (58.8%) |
| Total (Overall) | 155 (53.8%) | 133 (46.2%) |
Natural Resources, Construction and Maintenance Occupations
The most common Natural Resources, Construction and Maintenance occupations in Salcha are Installation, Maintenance & Repair (39 | 13.5%), and Construction & Extraction (4 | 1.4%).
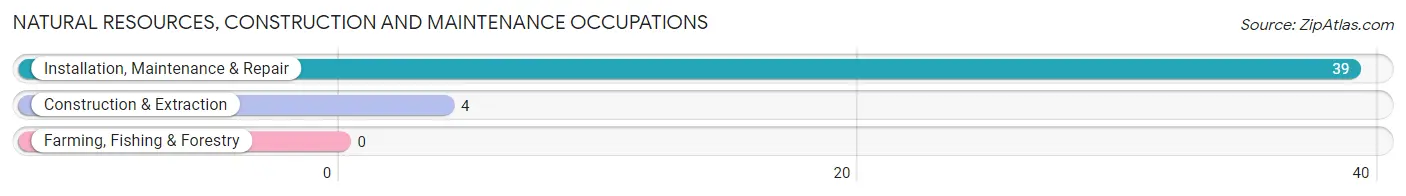
Natural Resources, Construction and Maintenance Occupations by Sex
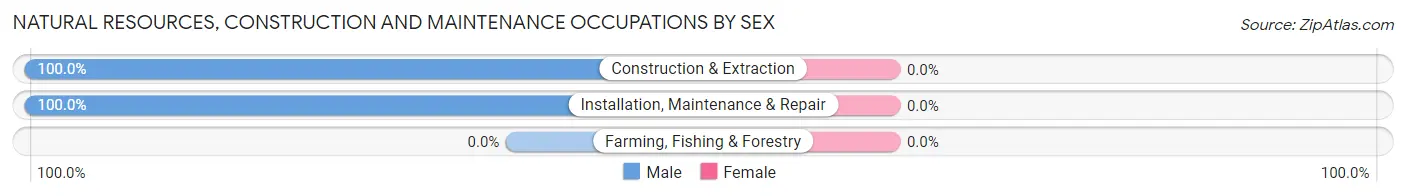
| Occupation | Male | Female |
| Farming, Fishing & Forestry | 0 (0.0%) | 0 (0.0%) |
| Construction & Extraction | 4 (100.0%) | 0 (0.0%) |
| Installation, Maintenance & Repair | 39 (100.0%) | 0 (0.0%) |
| Total (Category) | 43 (100.0%) | 0 (0.0%) |
| Total (Overall) | 155 (53.8%) | 133 (46.2%) |
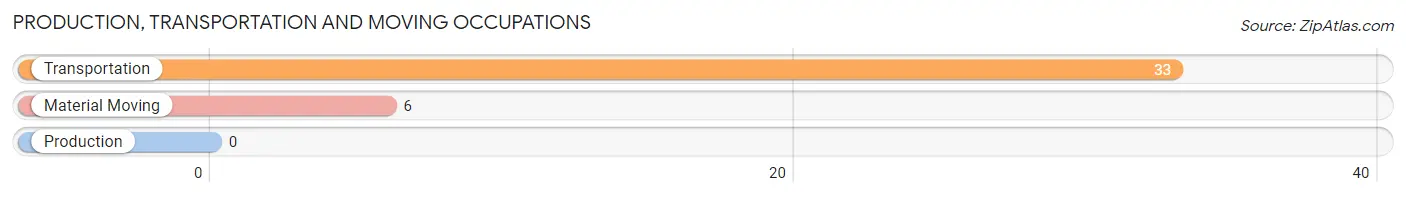
Production, Transportation and Moving Occupations
The most common Production, Transportation and Moving occupations in Salcha are Transportation (33 | 11.5%), and Material Moving (6 | 2.1%).
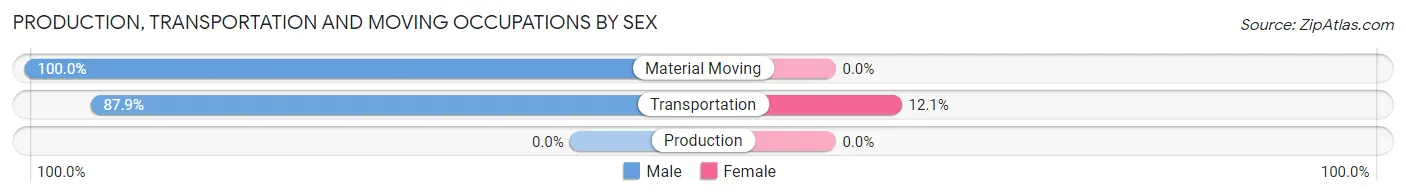
Production, Transportation and Moving Occupations by Sex
| Occupation | Male | Female |
| Production | 0 (0.0%) | 0 (0.0%) |
| Transportation | 29 (87.9%) | 4 (12.1%) |
| Material Moving | 6 (100.0%) | 0 (0.0%) |
| Total (Category) | 35 (89.7%) | 4 (10.3%) |
| Total (Overall) | 155 (53.8%) | 133 (46.2%) |
Employment Industries by Sex in Salcha
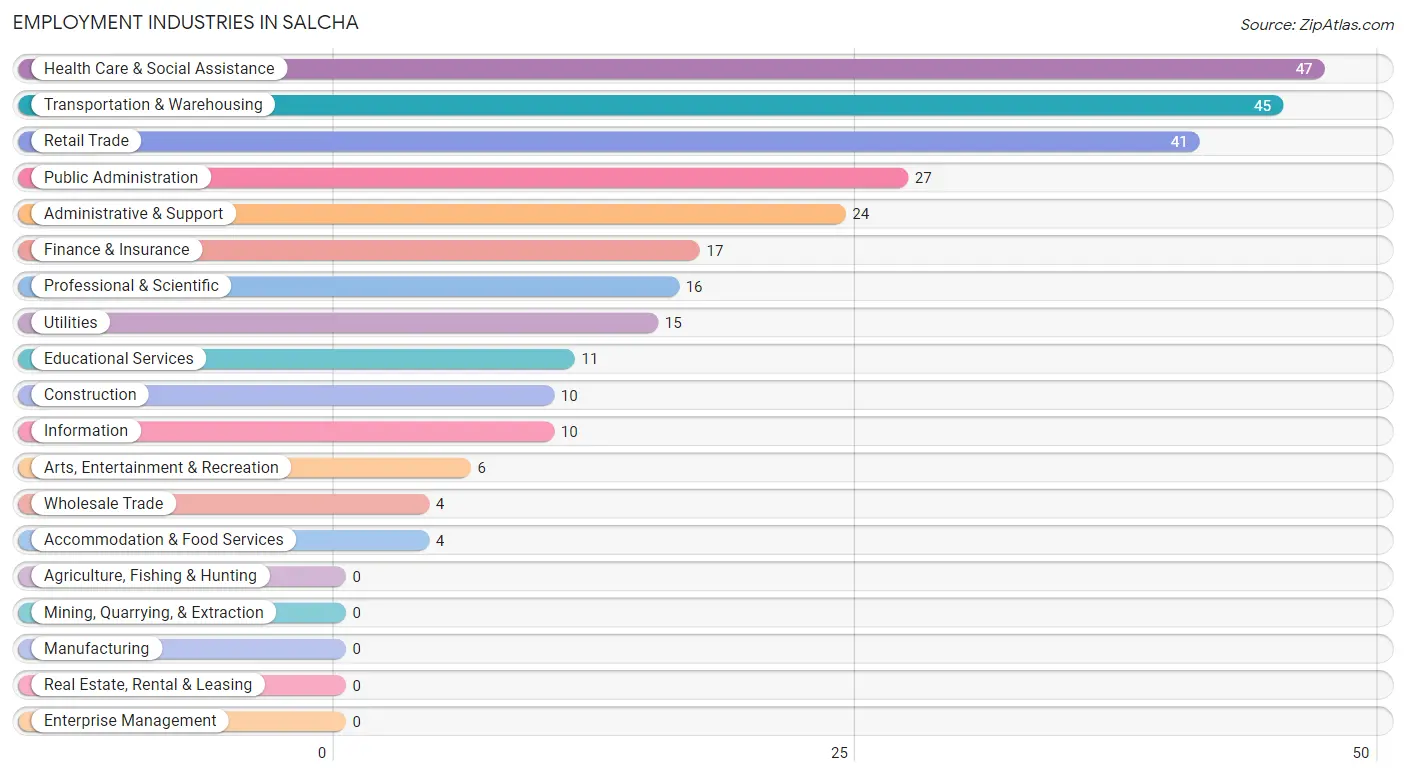
Employment Industries in Salcha
The major employment industries in Salcha include Health Care & Social Assistance (47 | 16.3%), Transportation & Warehousing (45 | 15.6%), Retail Trade (41 | 14.2%), Public Administration (27 | 9.4%), and Administrative & Support (24 | 8.3%).
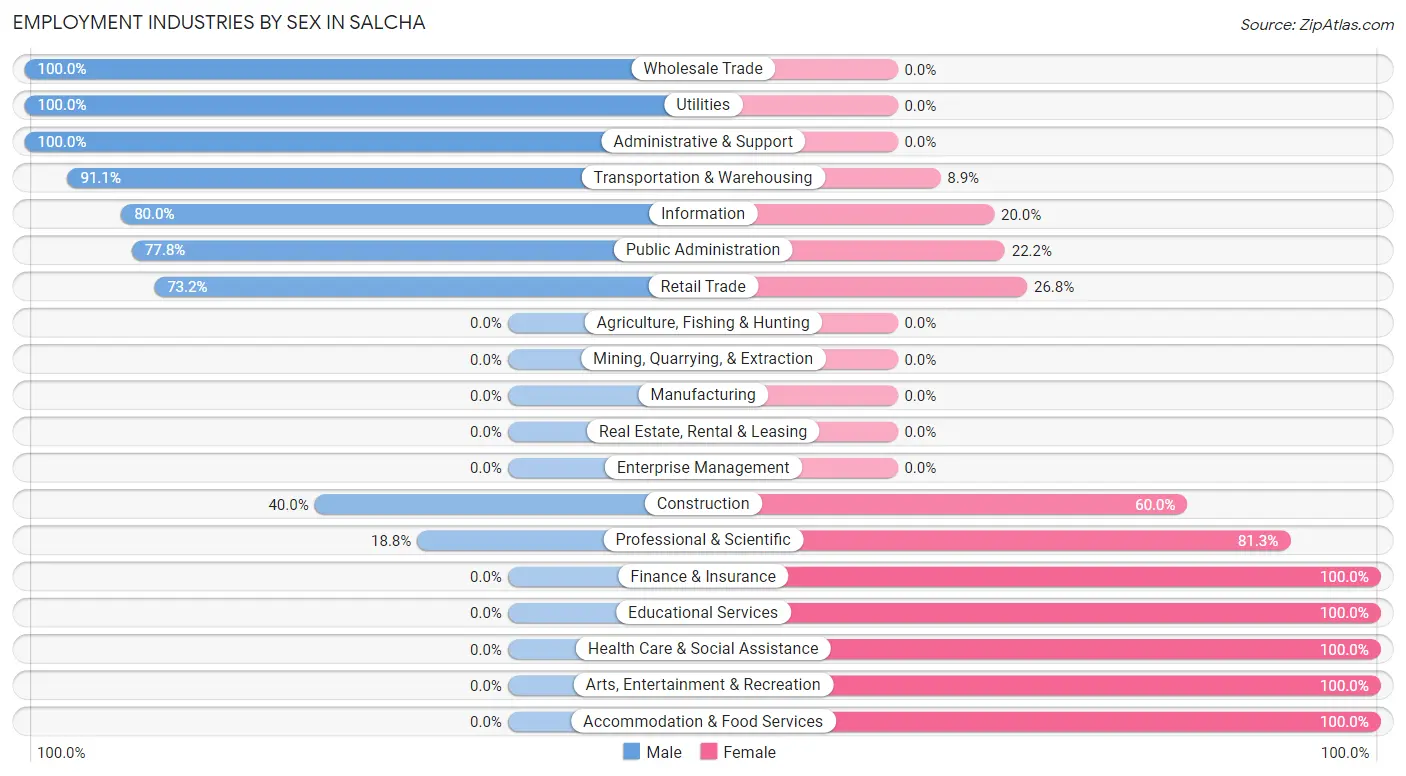
Employment Industries by Sex in Salcha
The Salcha industries that see more men than women are Wholesale Trade (100.0%), Utilities (100.0%), and Administrative & Support (100.0%), whereas the industries that tend to have a higher number of women are Finance & Insurance (100.0%), Educational Services (100.0%), and Health Care & Social Assistance (100.0%).
| Industry | Male | Female |
| Agriculture, Fishing & Hunting | 0 (0.0%) | 0 (0.0%) |
| Mining, Quarrying, & Extraction | 0 (0.0%) | 0 (0.0%) |
| Construction | 4 (40.0%) | 6 (60.0%) |
| Manufacturing | 0 (0.0%) | 0 (0.0%) |
| Wholesale Trade | 4 (100.0%) | 0 (0.0%) |
| Retail Trade | 30 (73.2%) | 11 (26.8%) |
| Transportation & Warehousing | 41 (91.1%) | 4 (8.9%) |
| Utilities | 15 (100.0%) | 0 (0.0%) |
| Information | 8 (80.0%) | 2 (20.0%) |
| Finance & Insurance | 0 (0.0%) | 17 (100.0%) |
| Real Estate, Rental & Leasing | 0 (0.0%) | 0 (0.0%) |
| Professional & Scientific | 3 (18.8%) | 13 (81.2%) |
| Enterprise Management | 0 (0.0%) | 0 (0.0%) |
| Administrative & Support | 24 (100.0%) | 0 (0.0%) |
| Educational Services | 0 (0.0%) | 11 (100.0%) |
| Health Care & Social Assistance | 0 (0.0%) | 47 (100.0%) |
| Arts, Entertainment & Recreation | 0 (0.0%) | 6 (100.0%) |
| Accommodation & Food Services | 0 (0.0%) | 4 (100.0%) |
| Public Administration | 21 (77.8%) | 6 (22.2%) |
| Total | 155 (53.8%) | 133 (46.2%) |
Education in Salcha
School Enrollment in Salcha
The most common levels of schooling among the 76 students in Salcha are middle school (29 | 38.2%), elementary school (25 | 32.9%), and high school (13 | 17.1%).
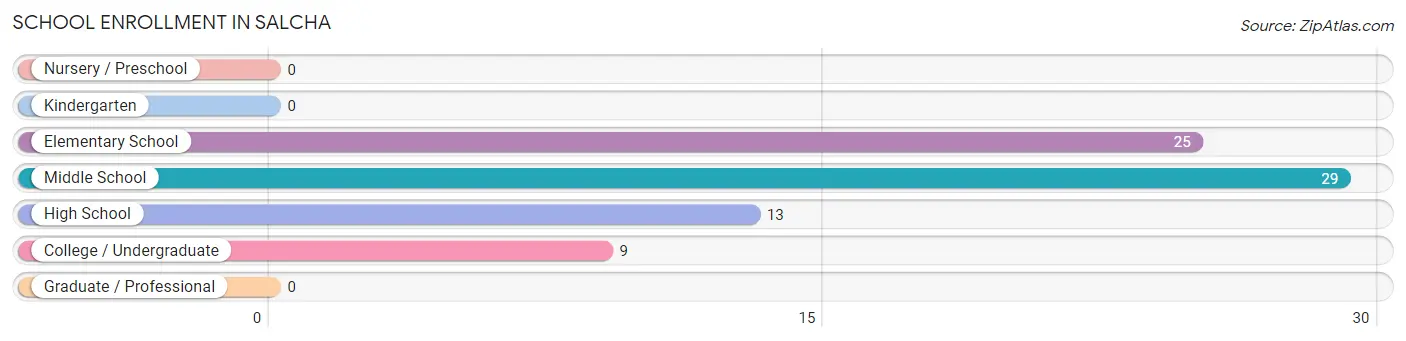
| School Level | # Students | % Students |
| Nursery / Preschool | 0 | 0.0% |
| Kindergarten | 0 | 0.0% |
| Elementary School | 25 | 32.9% |
| Middle School | 29 | 38.2% |
| High School | 13 | 17.1% |
| College / Undergraduate | 9 | 11.8% |
| Graduate / Professional | 0 | 0.0% |
| Total | 76 | 100.0% |
School Enrollment by Age by Funding Source in Salcha
Out of a total of 76 students who are enrolled in schools in Salcha, 21 (27.6%) attend a private institution, while the remaining 55 (72.4%) are enrolled in public schools. The age group of 5 to 9 year old has the highest likelihood of being enrolled in private schools, with 11 (68.8% in the age bracket) enrolled. Conversely, the age group of 18 to 19 year olds has the lowest likelihood of being enrolled in a private school, with 3 (100.0% in the age bracket) attending a public institution.
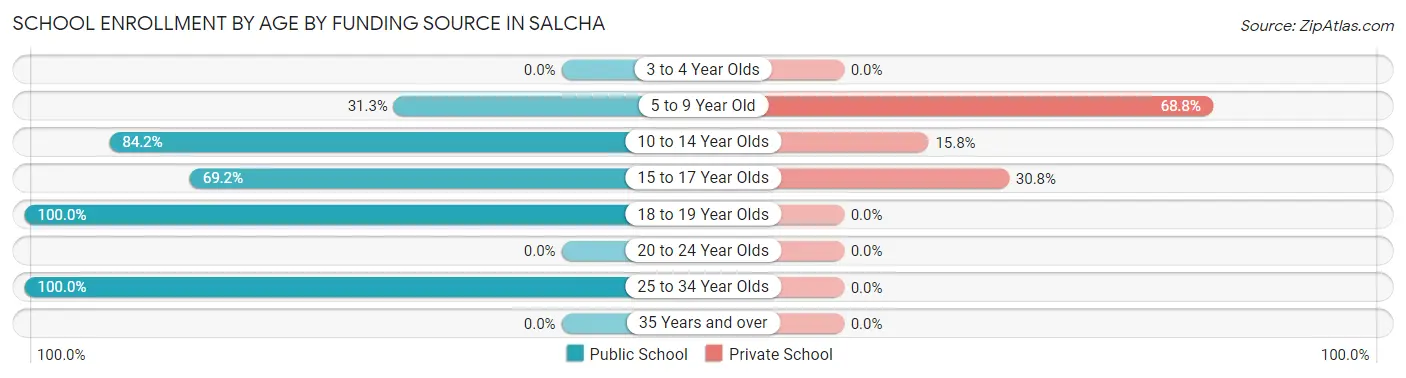
| Age Bracket | Public School | Private School |
| 3 to 4 Year Olds | 0 (0.0%) | 0 (0.0%) |
| 5 to 9 Year Old | 5 (31.2%) | 11 (68.8%) |
| 10 to 14 Year Olds | 32 (84.2%) | 6 (15.8%) |
| 15 to 17 Year Olds | 9 (69.2%) | 4 (30.8%) |
| 18 to 19 Year Olds | 3 (100.0%) | 0 (0.0%) |
| 20 to 24 Year Olds | 0 (0.0%) | 0 (0.0%) |
| 25 to 34 Year Olds | 6 (100.0%) | 0 (0.0%) |
| 35 Years and over | 0 (0.0%) | 0 (0.0%) |
| Total | 55 (72.4%) | 21 (27.6%) |
Educational Attainment by Field of Study in Salcha
Arts & humanities (59 | 31.2%), business (35 | 18.5%), education (23 | 12.2%), literature & languages (15 | 7.9%), and science & technology (14 | 7.4%) are the most common fields of study among 189 individuals in Salcha who have obtained a bachelor's degree or higher.
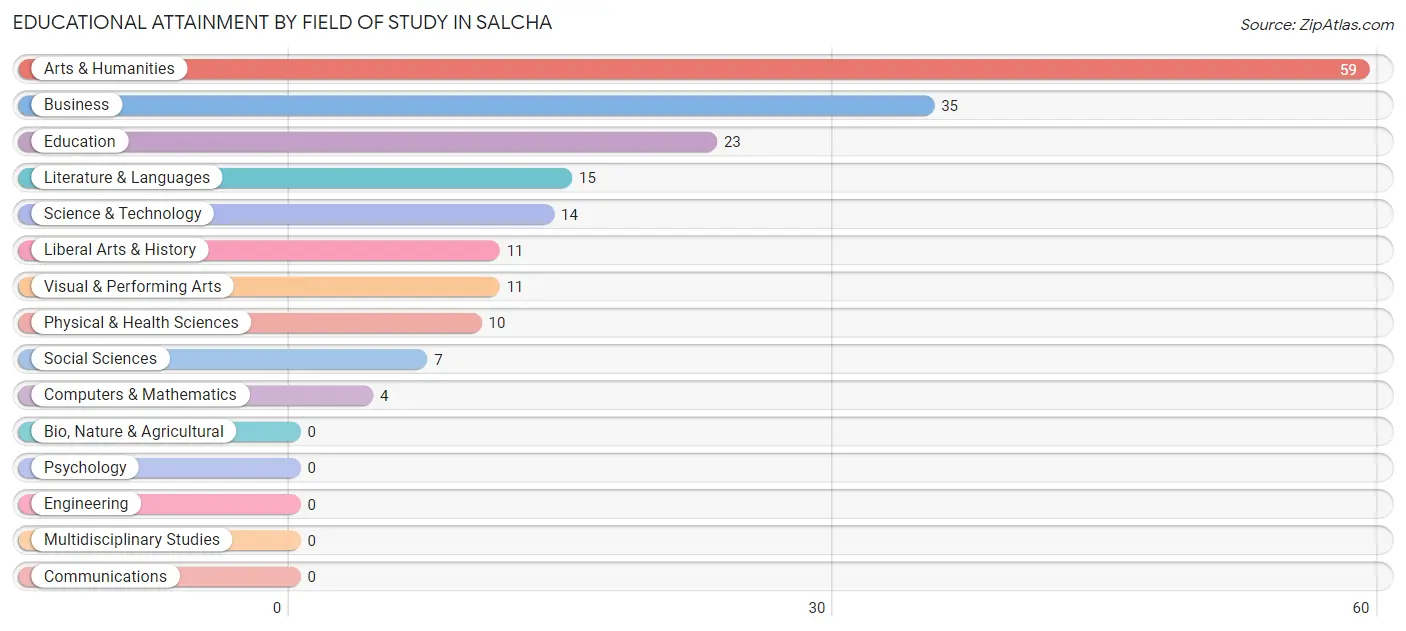
| Field of Study | # Graduates | % Graduates |
| Computers & Mathematics | 4 | 2.1% |
| Bio, Nature & Agricultural | 0 | 0.0% |
| Physical & Health Sciences | 10 | 5.3% |
| Psychology | 0 | 0.0% |
| Social Sciences | 7 | 3.7% |
| Engineering | 0 | 0.0% |
| Multidisciplinary Studies | 0 | 0.0% |
| Science & Technology | 14 | 7.4% |
| Business | 35 | 18.5% |
| Education | 23 | 12.2% |
| Literature & Languages | 15 | 7.9% |
| Liberal Arts & History | 11 | 5.8% |
| Visual & Performing Arts | 11 | 5.8% |
| Communications | 0 | 0.0% |
| Arts & Humanities | 59 | 31.2% |
| Total | 189 | 100.0% |
Transportation & Commute in Salcha
Vehicle Availability by Sex in Salcha
The most prevalent vehicle ownership categories in Salcha are males with 5 or more vehicles (43, accounting for 30.1%) and females with 5 or more vehicles (4, making up 29.0%).
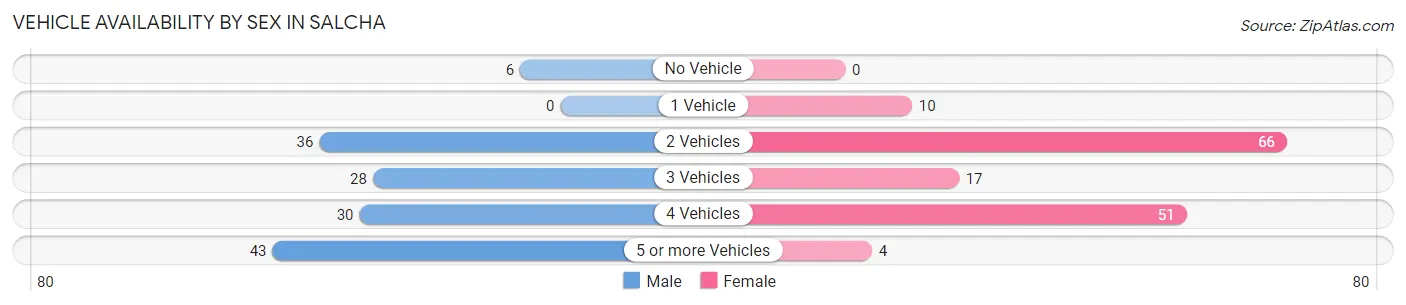
| Vehicles Available | Male | Female |
| No Vehicle | 6 (4.2%) | 0 (0.0%) |
| 1 Vehicle | 0 (0.0%) | 10 (6.8%) |
| 2 Vehicles | 36 (25.2%) | 66 (44.6%) |
| 3 Vehicles | 28 (19.6%) | 17 (11.5%) |
| 4 Vehicles | 30 (21.0%) | 51 (34.5%) |
| 5 or more Vehicles | 43 (30.1%) | 4 (2.7%) |
| Total | 143 (100.0%) | 148 (100.0%) |
Commute Time in Salcha
The most frequently occuring commute durations in Salcha are 45 to 59 minutes (95 commuters, 32.7%), 30 to 34 minutes (62 commuters, 21.3%), and 40 to 44 minutes (27 commuters, 9.3%).
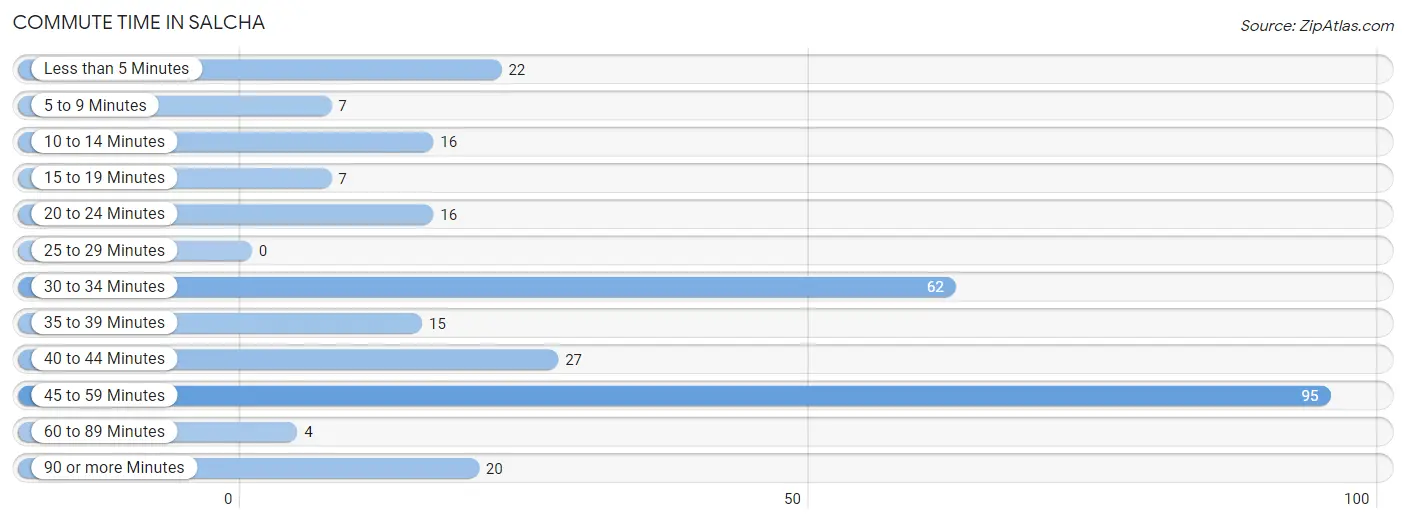
| Commute Time | # Commuters | % Commuters |
| Less than 5 Minutes | 22 | 7.6% |
| 5 to 9 Minutes | 7 | 2.4% |
| 10 to 14 Minutes | 16 | 5.5% |
| 15 to 19 Minutes | 7 | 2.4% |
| 20 to 24 Minutes | 16 | 5.5% |
| 25 to 29 Minutes | 0 | 0.0% |
| 30 to 34 Minutes | 62 | 21.3% |
| 35 to 39 Minutes | 15 | 5.1% |
| 40 to 44 Minutes | 27 | 9.3% |
| 45 to 59 Minutes | 95 | 32.7% |
| 60 to 89 Minutes | 4 | 1.4% |
| 90 or more Minutes | 20 | 6.9% |
Commute Time by Sex in Salcha
The most common commute times in Salcha are 45 to 59 minutes (45 commuters, 31.5%) for males and 45 to 59 minutes (50 commuters, 33.8%) for females.
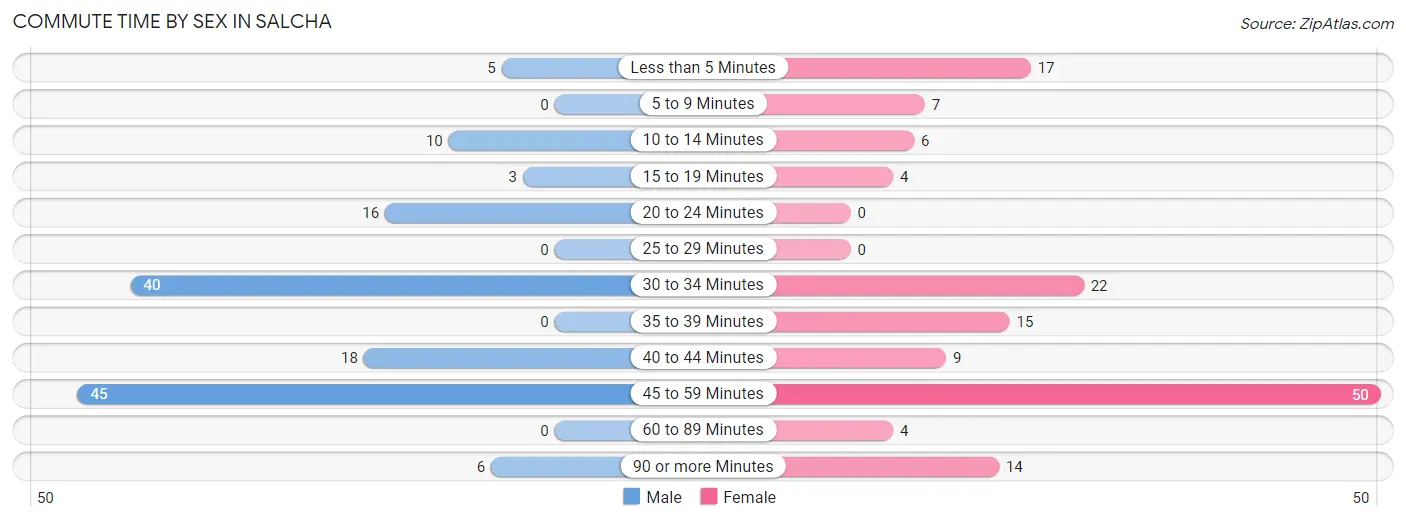
| Commute Time | Male | Female |
| Less than 5 Minutes | 5 (3.5%) | 17 (11.5%) |
| 5 to 9 Minutes | 0 (0.0%) | 7 (4.7%) |
| 10 to 14 Minutes | 10 (7.0%) | 6 (4.1%) |
| 15 to 19 Minutes | 3 (2.1%) | 4 (2.7%) |
| 20 to 24 Minutes | 16 (11.2%) | 0 (0.0%) |
| 25 to 29 Minutes | 0 (0.0%) | 0 (0.0%) |
| 30 to 34 Minutes | 40 (28.0%) | 22 (14.9%) |
| 35 to 39 Minutes | 0 (0.0%) | 15 (10.1%) |
| 40 to 44 Minutes | 18 (12.6%) | 9 (6.1%) |
| 45 to 59 Minutes | 45 (31.5%) | 50 (33.8%) |
| 60 to 89 Minutes | 0 (0.0%) | 4 (2.7%) |
| 90 or more Minutes | 6 (4.2%) | 14 (9.5%) |
Time of Departure to Work by Sex in Salcha
The most frequent times of departure to work in Salcha are 4:00 PM to 11:59 PM (43, 30.1%) for males and 6:30 AM to 6:59 AM (38, 25.7%) for females.
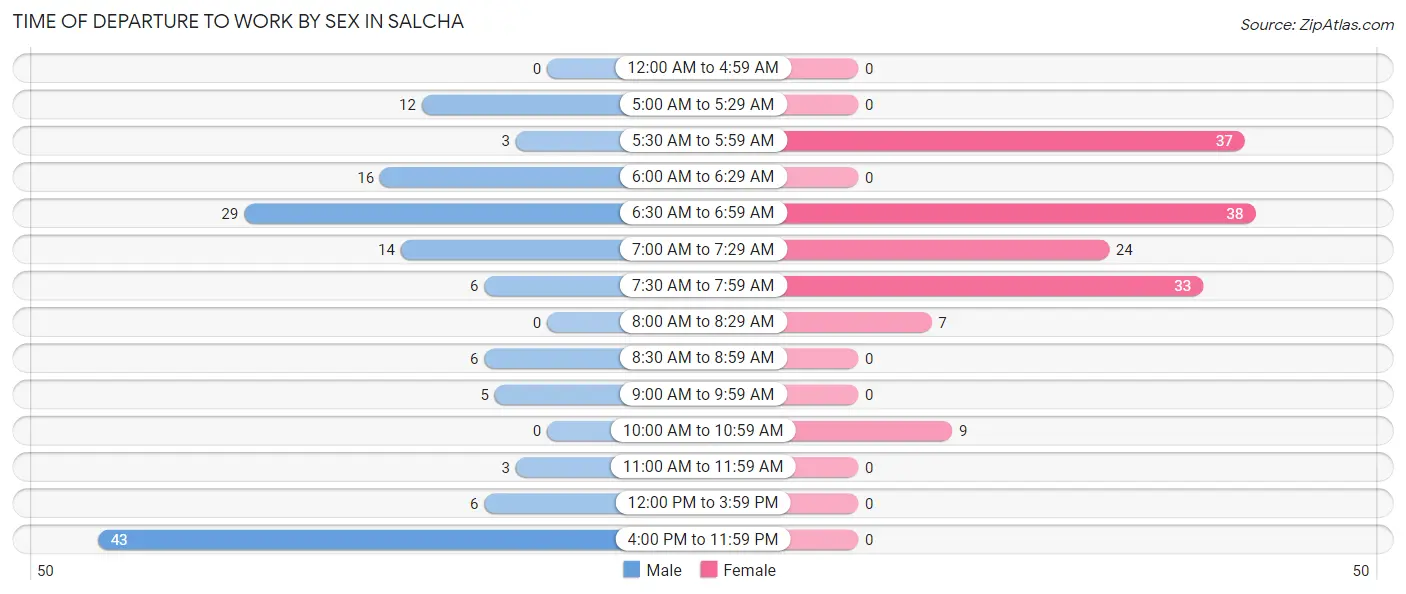
| Time of Departure | Male | Female |
| 12:00 AM to 4:59 AM | 0 (0.0%) | 0 (0.0%) |
| 5:00 AM to 5:29 AM | 12 (8.4%) | 0 (0.0%) |
| 5:30 AM to 5:59 AM | 3 (2.1%) | 37 (25.0%) |
| 6:00 AM to 6:29 AM | 16 (11.2%) | 0 (0.0%) |
| 6:30 AM to 6:59 AM | 29 (20.3%) | 38 (25.7%) |
| 7:00 AM to 7:29 AM | 14 (9.8%) | 24 (16.2%) |
| 7:30 AM to 7:59 AM | 6 (4.2%) | 33 (22.3%) |
| 8:00 AM to 8:29 AM | 0 (0.0%) | 7 (4.7%) |
| 8:30 AM to 8:59 AM | 6 (4.2%) | 0 (0.0%) |
| 9:00 AM to 9:59 AM | 5 (3.5%) | 0 (0.0%) |
| 10:00 AM to 10:59 AM | 0 (0.0%) | 9 (6.1%) |
| 11:00 AM to 11:59 AM | 3 (2.1%) | 0 (0.0%) |
| 12:00 PM to 3:59 PM | 6 (4.2%) | 0 (0.0%) |
| 4:00 PM to 11:59 PM | 43 (30.1%) | 0 (0.0%) |
| Total | 143 (100.0%) | 148 (100.0%) |
Housing Occupancy in Salcha
Occupancy by Ownership in Salcha
Of the total 353 dwellings in Salcha, owner-occupied units account for 314 (88.9%), while renter-occupied units make up 39 (11.1%).
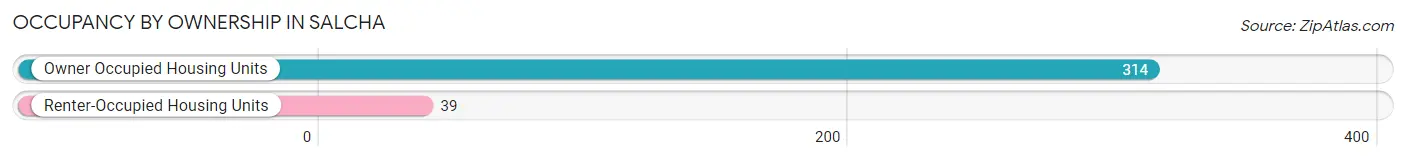
| Occupancy | # Housing Units | % Housing Units |
| Owner Occupied Housing Units | 314 | 88.9% |
| Renter-Occupied Housing Units | 39 | 11.1% |
| Total Occupied Housing Units | 353 | 100.0% |
Occupancy by Household Size in Salcha
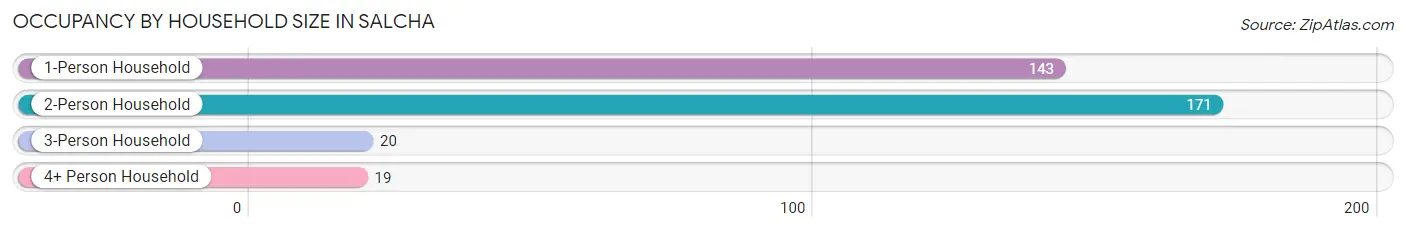
| Household Size | # Housing Units | % Housing Units |
| 1-Person Household | 143 | 40.5% |
| 2-Person Household | 171 | 48.4% |
| 3-Person Household | 20 | 5.7% |
| 4+ Person Household | 19 | 5.4% |
| Total Housing Units | 353 | 100.0% |
Occupancy by Ownership by Household Size in Salcha
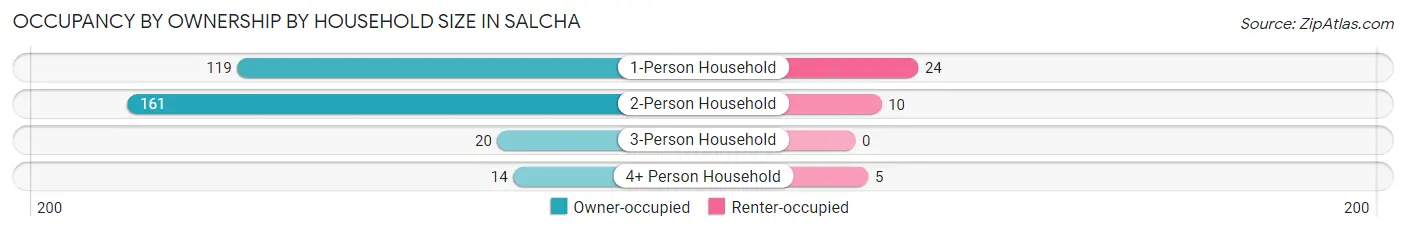
| Household Size | Owner-occupied | Renter-occupied |
| 1-Person Household | 119 (83.2%) | 24 (16.8%) |
| 2-Person Household | 161 (94.2%) | 10 (5.9%) |
| 3-Person Household | 20 (100.0%) | 0 (0.0%) |
| 4+ Person Household | 14 (73.7%) | 5 (26.3%) |
| Total Housing Units | 314 (88.9%) | 39 (11.1%) |
Occupancy by Educational Attainment in Salcha
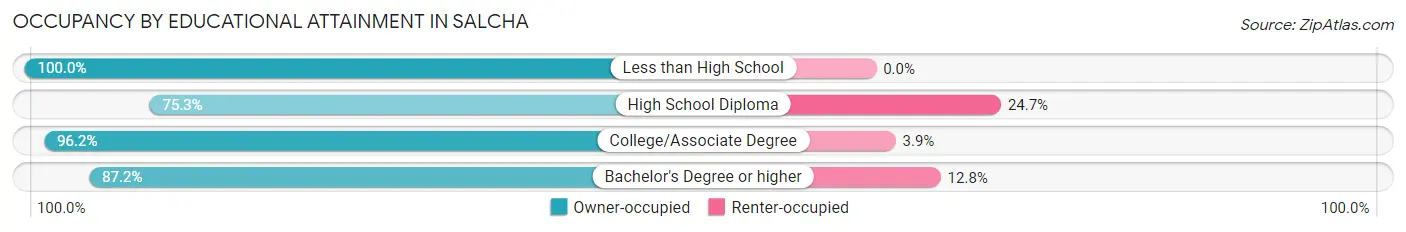
| Household Size | Owner-occupied | Renter-occupied |
| Less than High School | 66 (100.0%) | 0 (0.0%) |
| High School Diploma | 73 (75.3%) | 24 (24.7%) |
| College/Associate Degree | 100 (96.2%) | 4 (3.8%) |
| Bachelor's Degree or higher | 75 (87.2%) | 11 (12.8%) |
Occupancy by Age of Householder in Salcha
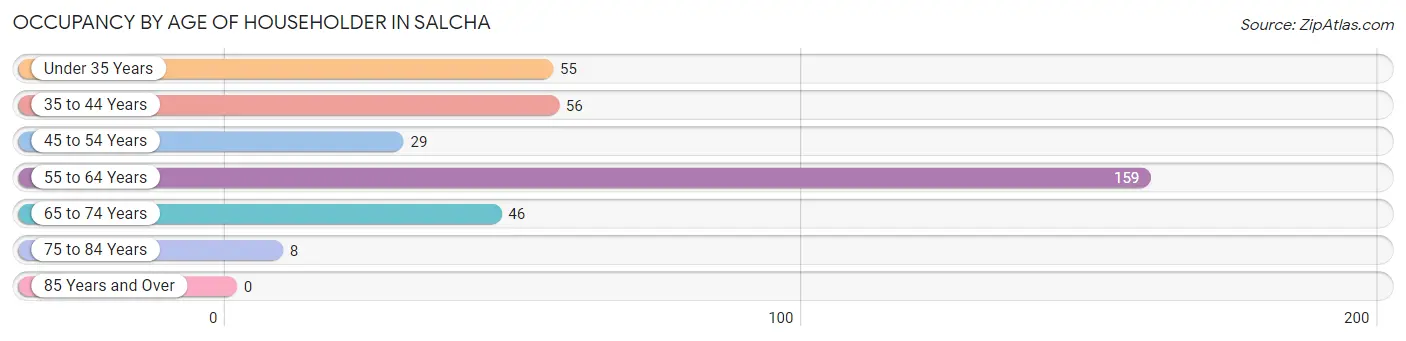
| Age Bracket | # Households | % Households |
| Under 35 Years | 55 | 15.6% |
| 35 to 44 Years | 56 | 15.9% |
| 45 to 54 Years | 29 | 8.2% |
| 55 to 64 Years | 159 | 45.0% |
| 65 to 74 Years | 46 | 13.0% |
| 75 to 84 Years | 8 | 2.3% |
| 85 Years and Over | 0 | 0.0% |
| Total | 353 | 100.0% |
Housing Finances in Salcha
Median Income by Occupancy in Salcha
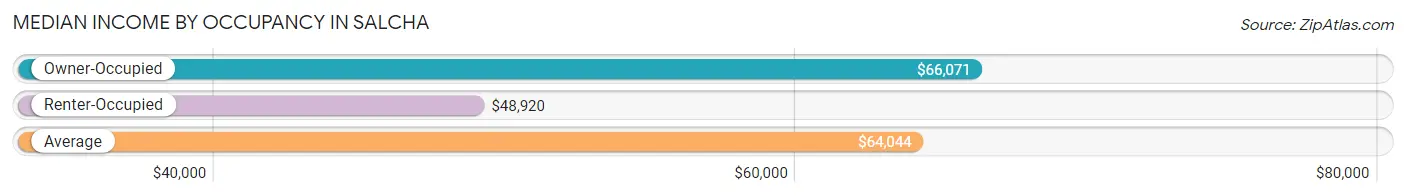
| Occupancy Type | # Households | Median Income |
| Owner-Occupied | 314 (88.9%) | $66,071 |
| Renter-Occupied | 39 (11.1%) | $48,920 |
| Average | 353 (100.0%) | $64,044 |
Occupancy by Householder Income Bracket in Salcha
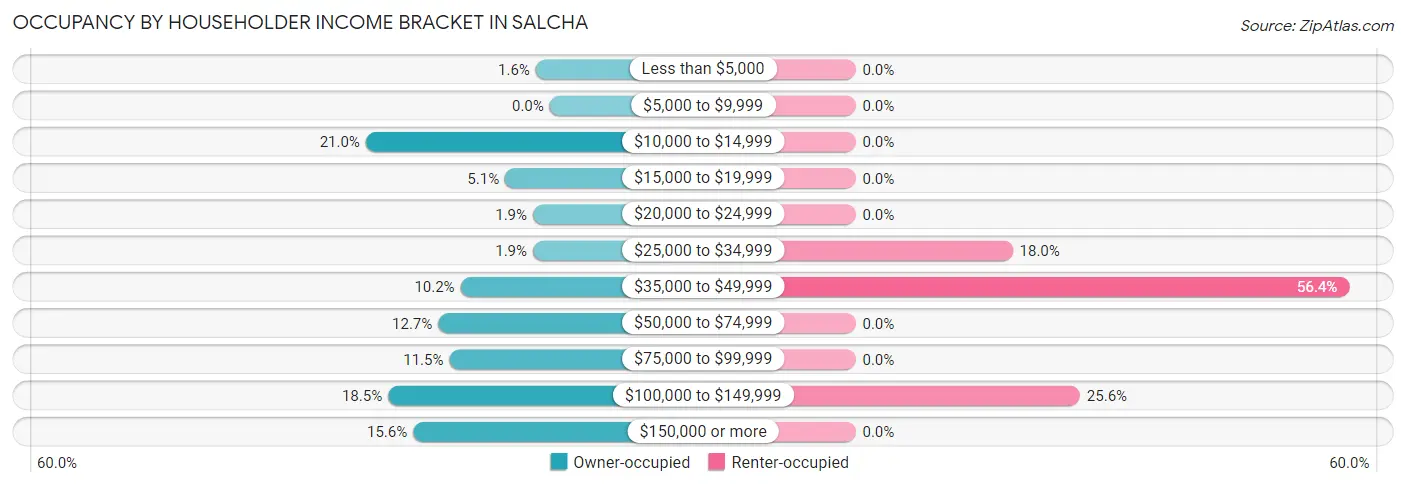
| Income Bracket | Owner-occupied | Renter-occupied |
| Less than $5,000 | 5 (1.6%) | 0 (0.0%) |
| $5,000 to $9,999 | 0 (0.0%) | 0 (0.0%) |
| $10,000 to $14,999 | 66 (21.0%) | 0 (0.0%) |
| $15,000 to $19,999 | 16 (5.1%) | 0 (0.0%) |
| $20,000 to $24,999 | 6 (1.9%) | 0 (0.0%) |
| $25,000 to $34,999 | 6 (1.9%) | 7 (17.9%) |
| $35,000 to $49,999 | 32 (10.2%) | 22 (56.4%) |
| $50,000 to $74,999 | 40 (12.7%) | 0 (0.0%) |
| $75,000 to $99,999 | 36 (11.5%) | 0 (0.0%) |
| $100,000 to $149,999 | 58 (18.5%) | 10 (25.6%) |
| $150,000 or more | 49 (15.6%) | 0 (0.0%) |
| Total | 314 (100.0%) | 39 (100.0%) |
Monthly Housing Cost Tiers in Salcha
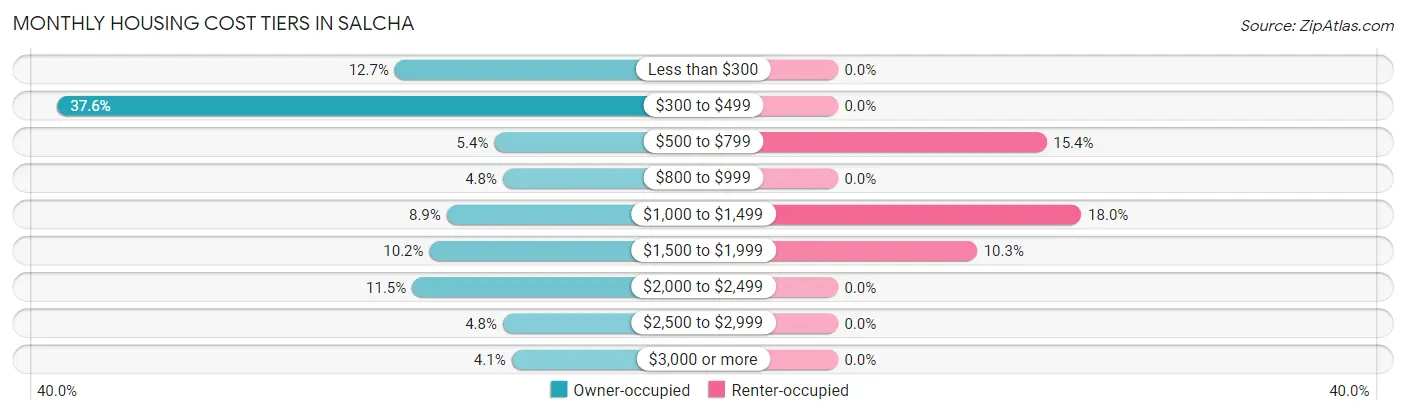
| Monthly Cost | Owner-occupied | Renter-occupied |
| Less than $300 | 40 (12.7%) | 0 (0.0%) |
| $300 to $499 | 118 (37.6%) | 0 (0.0%) |
| $500 to $799 | 17 (5.4%) | 6 (15.4%) |
| $800 to $999 | 15 (4.8%) | 0 (0.0%) |
| $1,000 to $1,499 | 28 (8.9%) | 7 (17.9%) |
| $1,500 to $1,999 | 32 (10.2%) | 4 (10.3%) |
| $2,000 to $2,499 | 36 (11.5%) | 0 (0.0%) |
| $2,500 to $2,999 | 15 (4.8%) | 0 (0.0%) |
| $3,000 or more | 13 (4.1%) | 0 (0.0%) |
| Total | 314 (100.0%) | 39 (100.0%) |
Physical Housing Characteristics in Salcha
Housing Structures in Salcha
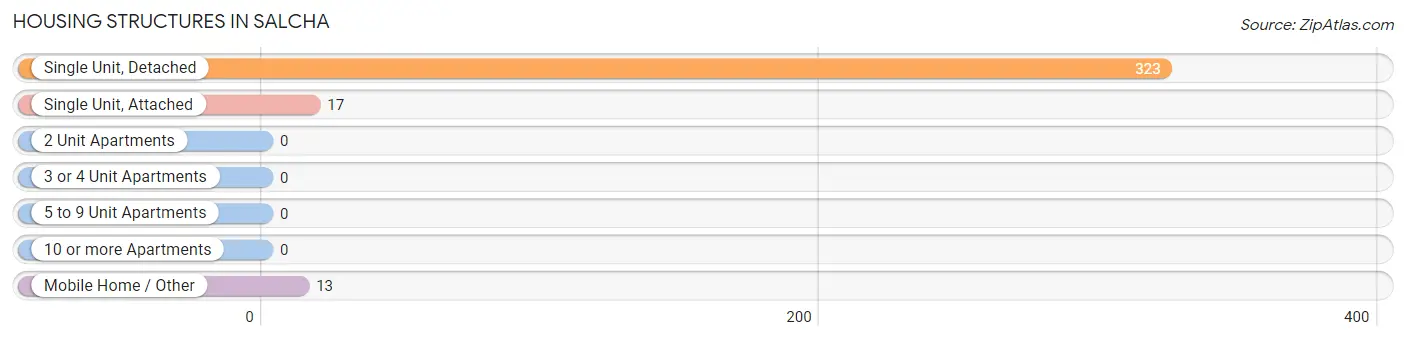
| Structure Type | # Housing Units | % Housing Units |
| Single Unit, Detached | 323 | 91.5% |
| Single Unit, Attached | 17 | 4.8% |
| 2 Unit Apartments | 0 | 0.0% |
| 3 or 4 Unit Apartments | 0 | 0.0% |
| 5 to 9 Unit Apartments | 0 | 0.0% |
| 10 or more Apartments | 0 | 0.0% |
| Mobile Home / Other | 13 | 3.7% |
| Total | 353 | 100.0% |
Housing Structures by Occupancy in Salcha
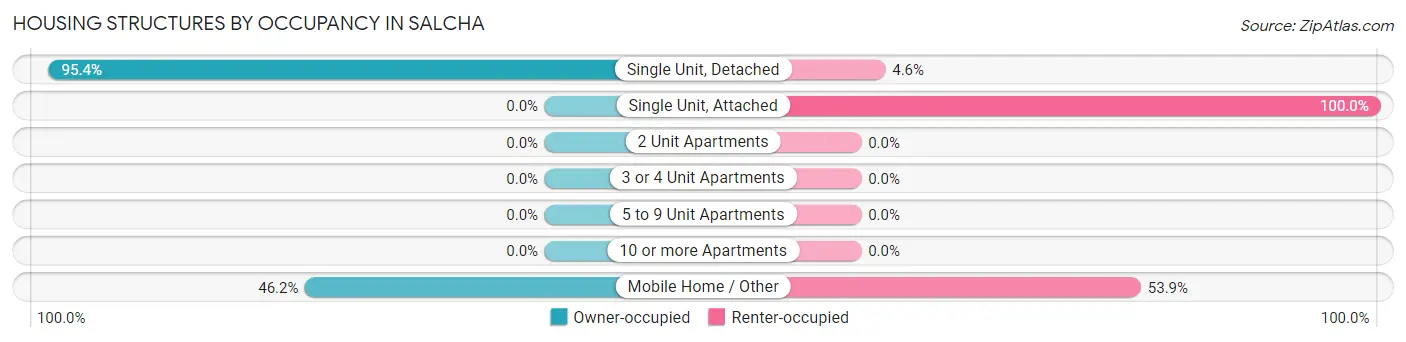
| Structure Type | Owner-occupied | Renter-occupied |
| Single Unit, Detached | 308 (95.4%) | 15 (4.6%) |
| Single Unit, Attached | 0 (0.0%) | 17 (100.0%) |
| 2 Unit Apartments | 0 (0.0%) | 0 (0.0%) |
| 3 or 4 Unit Apartments | 0 (0.0%) | 0 (0.0%) |
| 5 to 9 Unit Apartments | 0 (0.0%) | 0 (0.0%) |
| 10 or more Apartments | 0 (0.0%) | 0 (0.0%) |
| Mobile Home / Other | 6 (46.2%) | 7 (53.8%) |
| Total | 314 (88.9%) | 39 (11.1%) |
Housing Structures by Number of Rooms in Salcha
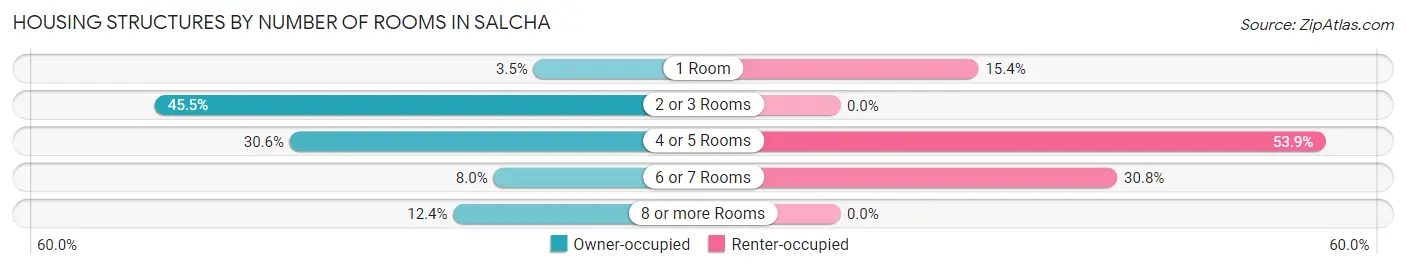
| Number of Rooms | Owner-occupied | Renter-occupied |
| 1 Room | 11 (3.5%) | 6 (15.4%) |
| 2 or 3 Rooms | 143 (45.5%) | 0 (0.0%) |
| 4 or 5 Rooms | 96 (30.6%) | 21 (53.8%) |
| 6 or 7 Rooms | 25 (8.0%) | 12 (30.8%) |
| 8 or more Rooms | 39 (12.4%) | 0 (0.0%) |
| Total | 314 (100.0%) | 39 (100.0%) |
Housing Structure by Heating Type in Salcha
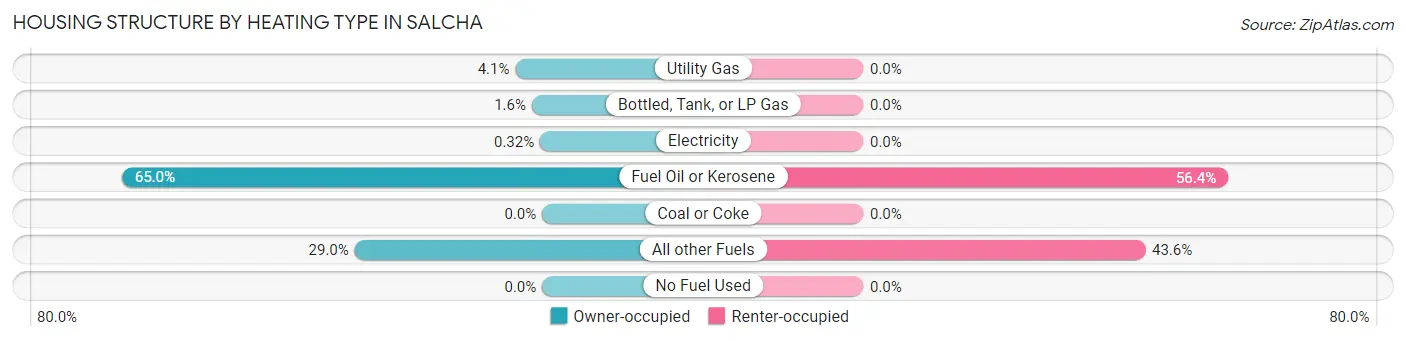
| Heating Type | Owner-occupied | Renter-occupied |
| Utility Gas | 13 (4.1%) | 0 (0.0%) |
| Bottled, Tank, or LP Gas | 5 (1.6%) | 0 (0.0%) |
| Electricity | 1 (0.3%) | 0 (0.0%) |
| Fuel Oil or Kerosene | 204 (65.0%) | 22 (56.4%) |
| Coal or Coke | 0 (0.0%) | 0 (0.0%) |
| All other Fuels | 91 (29.0%) | 17 (43.6%) |
| No Fuel Used | 0 (0.0%) | 0 (0.0%) |
| Total | 314 (100.0%) | 39 (100.0%) |
Household Vehicle Usage in Salcha
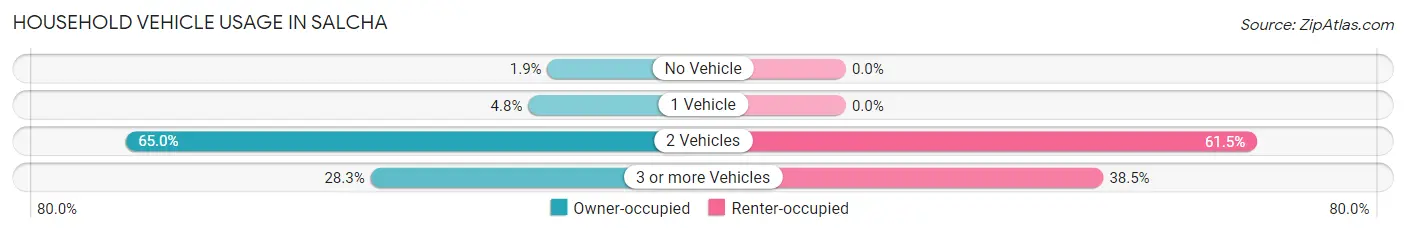
| Vehicles per Household | Owner-occupied | Renter-occupied |
| No Vehicle | 6 (1.9%) | 0 (0.0%) |
| 1 Vehicle | 15 (4.8%) | 0 (0.0%) |
| 2 Vehicles | 204 (65.0%) | 24 (61.5%) |
| 3 or more Vehicles | 89 (28.3%) | 15 (38.5%) |
| Total | 314 (100.0%) | 39 (100.0%) |
Real Estate & Mortgages in Salcha
Real Estate and Mortgage Overview in Salcha
| Characteristic | Without Mortgage | With Mortgage |
| Housing Units | 178 | 136 |
| Median Property Value | $257,100 | $222,200 |
| Median Household Income | - | - |
| Monthly Housing Costs | $428 | $13 |
| Real Estate Taxes | $2,301 | $45 |
Property Value by Mortgage Status in Salcha
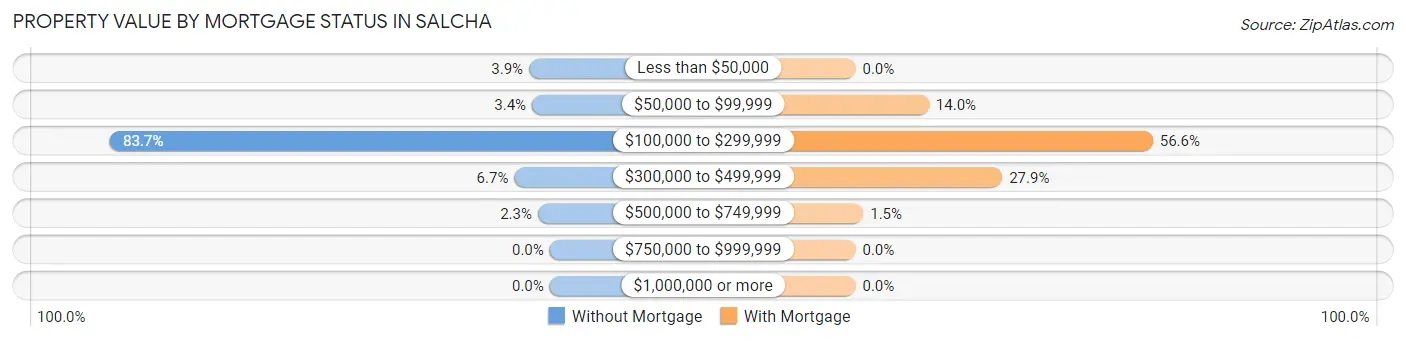
| Property Value | Without Mortgage | With Mortgage |
| Less than $50,000 | 7 (3.9%) | 0 (0.0%) |
| $50,000 to $99,999 | 6 (3.4%) | 19 (14.0%) |
| $100,000 to $299,999 | 149 (83.7%) | 77 (56.6%) |
| $300,000 to $499,999 | 12 (6.7%) | 38 (27.9%) |
| $500,000 to $749,999 | 4 (2.2%) | 2 (1.5%) |
| $750,000 to $999,999 | 0 (0.0%) | 0 (0.0%) |
| $1,000,000 or more | 0 (0.0%) | 0 (0.0%) |
| Total | 178 (100.0%) | 136 (100.0%) |
Household Income by Mortgage Status in Salcha
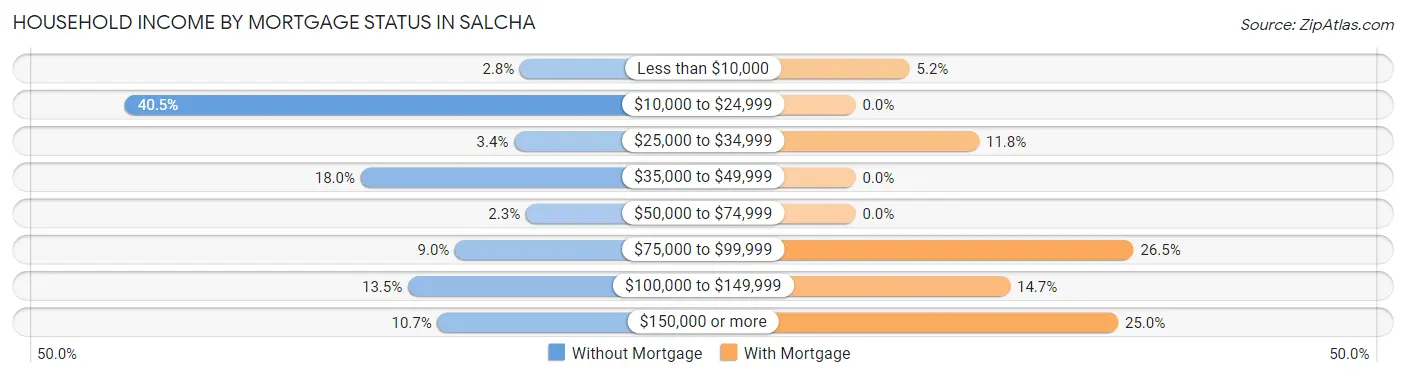
| Household Income | Without Mortgage | With Mortgage |
| Less than $10,000 | 5 (2.8%) | 7 (5.1%) |
| $10,000 to $24,999 | 72 (40.5%) | 0 (0.0%) |
| $25,000 to $34,999 | 6 (3.4%) | 16 (11.8%) |
| $35,000 to $49,999 | 32 (18.0%) | 0 (0.0%) |
| $50,000 to $74,999 | 4 (2.2%) | 0 (0.0%) |
| $75,000 to $99,999 | 16 (9.0%) | 36 (26.5%) |
| $100,000 to $149,999 | 24 (13.5%) | 20 (14.7%) |
| $150,000 or more | 19 (10.7%) | 34 (25.0%) |
| Total | 178 (100.0%) | 136 (100.0%) |
Property Value to Household Income Ratio in Salcha
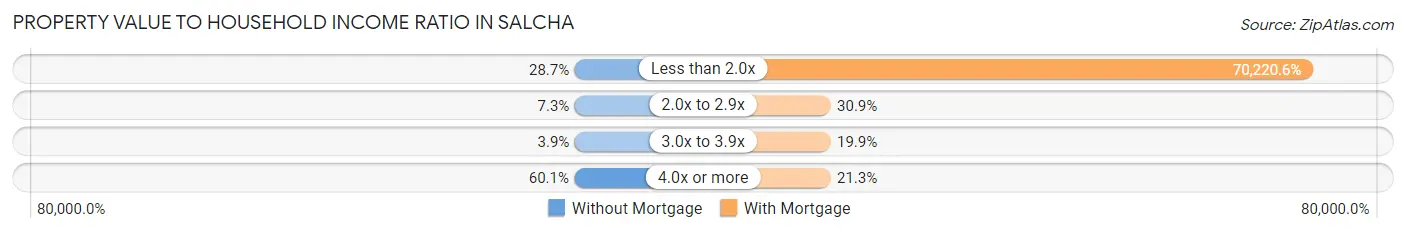
| Value-to-Income Ratio | Without Mortgage | With Mortgage |
| Less than 2.0x | 51 (28.6%) | 95,500 (70,220.6%) |
| 2.0x to 2.9x | 13 (7.3%) | 42 (30.9%) |
| 3.0x to 3.9x | 7 (3.9%) | 27 (19.9%) |
| 4.0x or more | 107 (60.1%) | 29 (21.3%) |
| Total | 178 (100.0%) | 136 (100.0%) |
Real Estate Taxes by Mortgage Status in Salcha
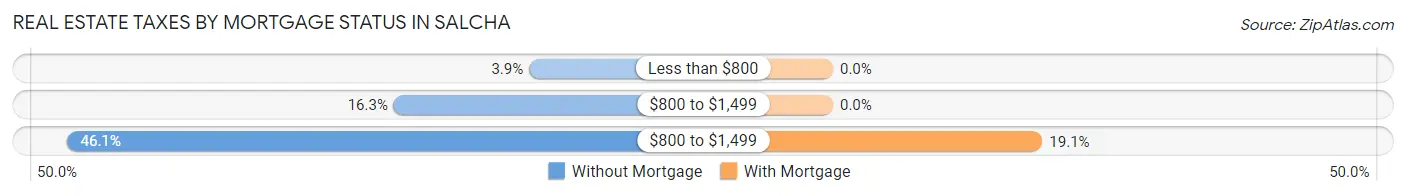
| Property Taxes | Without Mortgage | With Mortgage |
| Less than $800 | 7 (3.9%) | 0 (0.0%) |
| $800 to $1,499 | 29 (16.3%) | 0 (0.0%) |
| $800 to $1,499 | 82 (46.1%) | 26 (19.1%) |
| Total | 178 (100.0%) | 136 (100.0%) |
Health & Disability in Salcha
Health Insurance Coverage by Age in Salcha
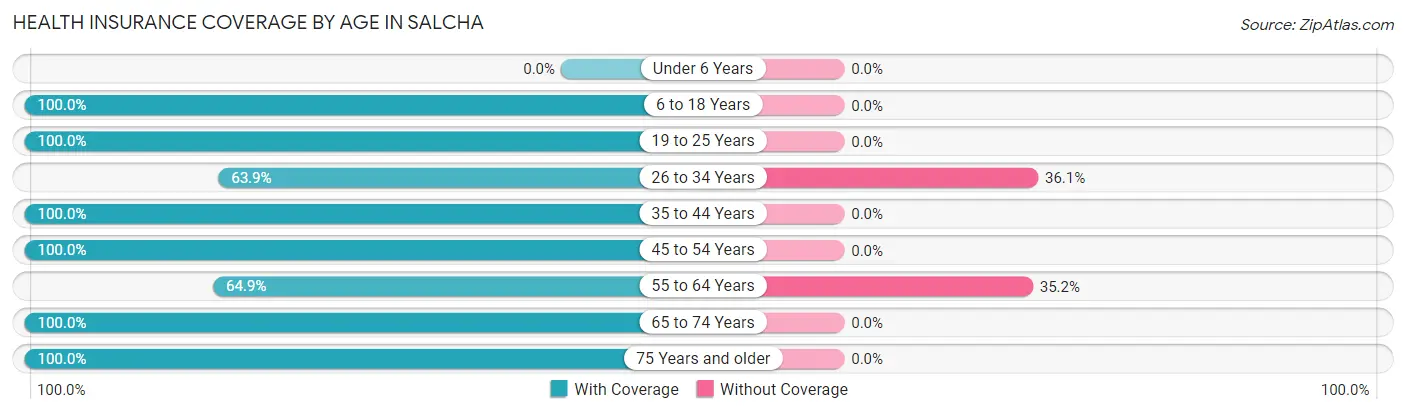
| Age Bracket | With Coverage | Without Coverage |
| Under 6 Years | 0 (0.0%) | 0 (0.0%) |
| 6 to 18 Years | 70 (100.0%) | 0 (0.0%) |
| 19 to 25 Years | 22 (100.0%) | 0 (0.0%) |
| 26 to 34 Years | 76 (63.9%) | 43 (36.1%) |
| 35 to 44 Years | 94 (100.0%) | 0 (0.0%) |
| 45 to 54 Years | 68 (100.0%) | 0 (0.0%) |
| 55 to 64 Years | 131 (64.8%) | 71 (35.1%) |
| 65 to 74 Years | 79 (100.0%) | 0 (0.0%) |
| 75 Years and older | 17 (100.0%) | 0 (0.0%) |
| Total | 557 (83.0%) | 114 (17.0%) |
Health Insurance Coverage by Citizenship Status in Salcha
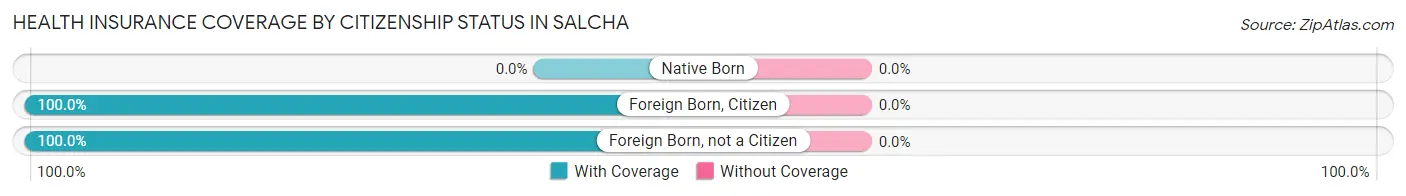
| Citizenship Status | With Coverage | Without Coverage |
| Native Born | 0 (0.0%) | 0 (0.0%) |
| Foreign Born, Citizen | 70 (100.0%) | 0 (0.0%) |
| Foreign Born, not a Citizen | 22 (100.0%) | 0 (0.0%) |
Health Insurance Coverage by Household Income in Salcha
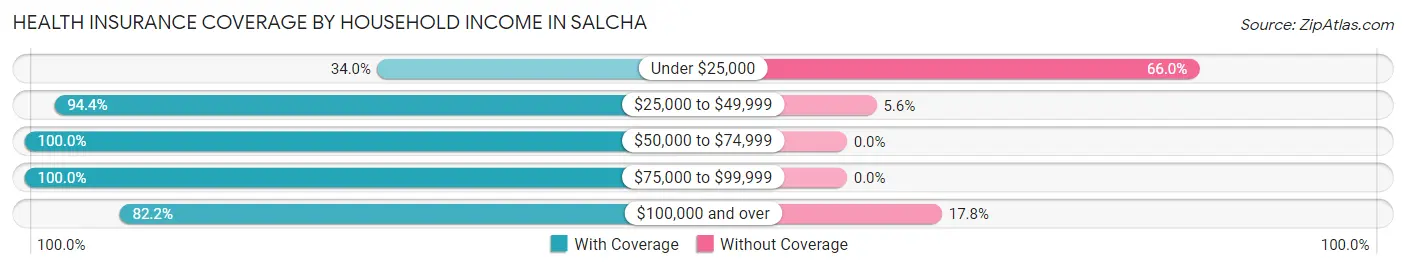
| Household Income | With Coverage | Without Coverage |
| Under $25,000 | 34 (34.0%) | 66 (66.0%) |
| $25,000 to $49,999 | 102 (94.4%) | 6 (5.6%) |
| $50,000 to $74,999 | 132 (100.0%) | 0 (0.0%) |
| $75,000 to $99,999 | 95 (100.0%) | 0 (0.0%) |
| $100,000 and over | 194 (82.2%) | 42 (17.8%) |
Public vs Private Health Insurance Coverage by Age in Salcha
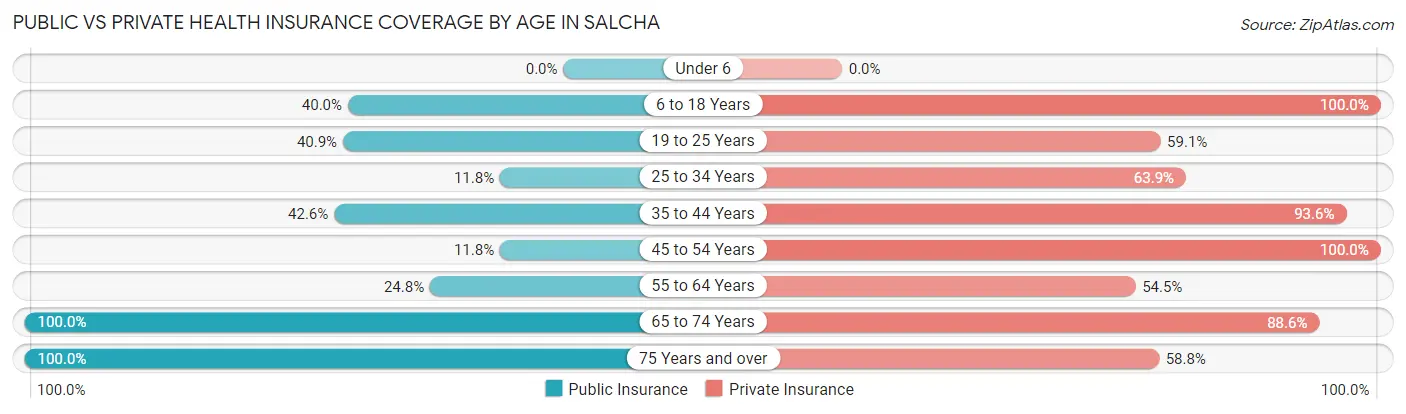
| Age Bracket | Public Insurance | Private Insurance |
| Under 6 | 0 (0.0%) | 0 (0.0%) |
| 6 to 18 Years | 28 (40.0%) | 70 (100.0%) |
| 19 to 25 Years | 9 (40.9%) | 13 (59.1%) |
| 25 to 34 Years | 14 (11.8%) | 76 (63.9%) |
| 35 to 44 Years | 40 (42.5%) | 88 (93.6%) |
| 45 to 54 Years | 8 (11.8%) | 68 (100.0%) |
| 55 to 64 Years | 50 (24.7%) | 110 (54.5%) |
| 65 to 74 Years | 79 (100.0%) | 70 (88.6%) |
| 75 Years and over | 17 (100.0%) | 10 (58.8%) |
| Total | 245 (36.5%) | 505 (75.3%) |
Disability Status by Sex by Age in Salcha
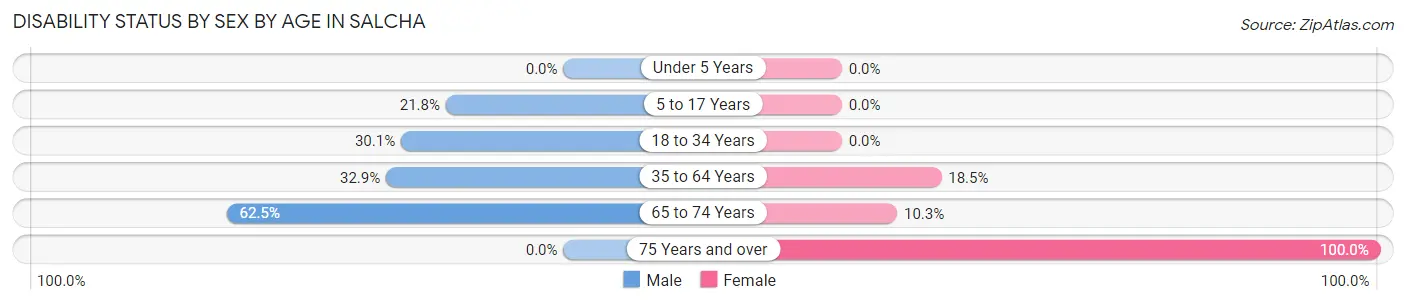
| Age Bracket | Male | Female |
| Under 5 Years | 0 (0.0%) | 0 (0.0%) |
| 5 to 17 Years | 12 (21.8%) | 0 (0.0%) |
| 18 to 34 Years | 22 (30.1%) | 0 (0.0%) |
| 35 to 64 Years | 77 (32.9%) | 24 (18.5%) |
| 65 to 74 Years | 25 (62.5%) | 4 (10.3%) |
| 75 Years and over | 0 (0.0%) | 9 (100.0%) |
Disability Class by Sex by Age in Salcha
Disability Class: Hearing Difficulty
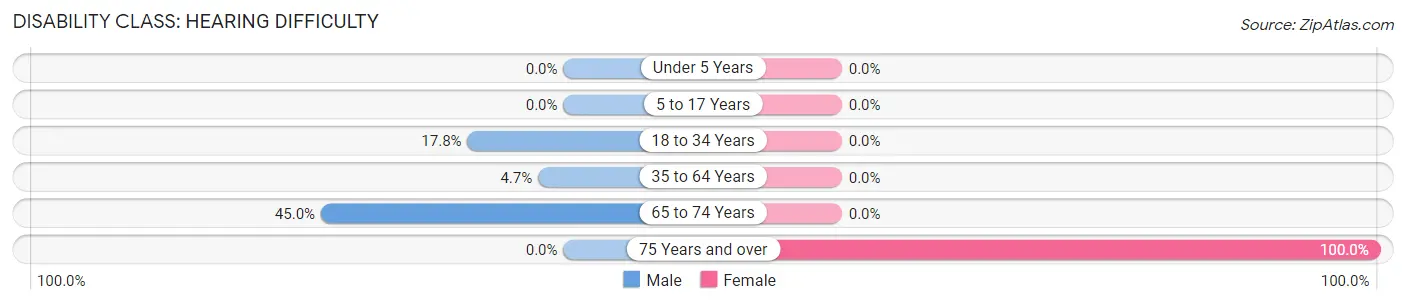
| Age Bracket | Male | Female |
| Under 5 Years | 0 (0.0%) | 0 (0.0%) |
| 5 to 17 Years | 0 (0.0%) | 0 (0.0%) |
| 18 to 34 Years | 13 (17.8%) | 0 (0.0%) |
| 35 to 64 Years | 11 (4.7%) | 0 (0.0%) |
| 65 to 74 Years | 18 (45.0%) | 0 (0.0%) |
| 75 Years and over | 0 (0.0%) | 9 (100.0%) |
Disability Class: Vision Difficulty
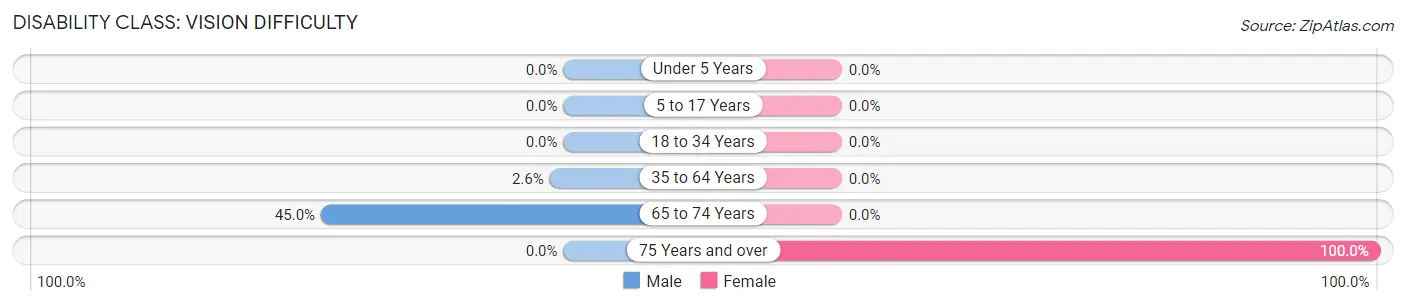
| Age Bracket | Male | Female |
| Under 5 Years | 0 (0.0%) | 0 (0.0%) |
| 5 to 17 Years | 0 (0.0%) | 0 (0.0%) |
| 18 to 34 Years | 0 (0.0%) | 0 (0.0%) |
| 35 to 64 Years | 6 (2.6%) | 0 (0.0%) |
| 65 to 74 Years | 18 (45.0%) | 0 (0.0%) |
| 75 Years and over | 0 (0.0%) | 9 (100.0%) |
Disability Class: Cognitive Difficulty
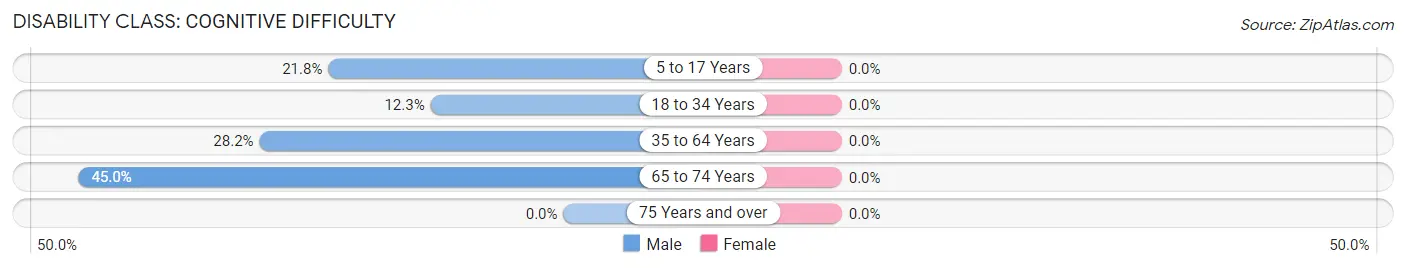
| Age Bracket | Male | Female |
| 5 to 17 Years | 12 (21.8%) | 0 (0.0%) |
| 18 to 34 Years | 9 (12.3%) | 0 (0.0%) |
| 35 to 64 Years | 66 (28.2%) | 0 (0.0%) |
| 65 to 74 Years | 18 (45.0%) | 0 (0.0%) |
| 75 Years and over | 0 (0.0%) | 0 (0.0%) |
Disability Class: Ambulatory Difficulty
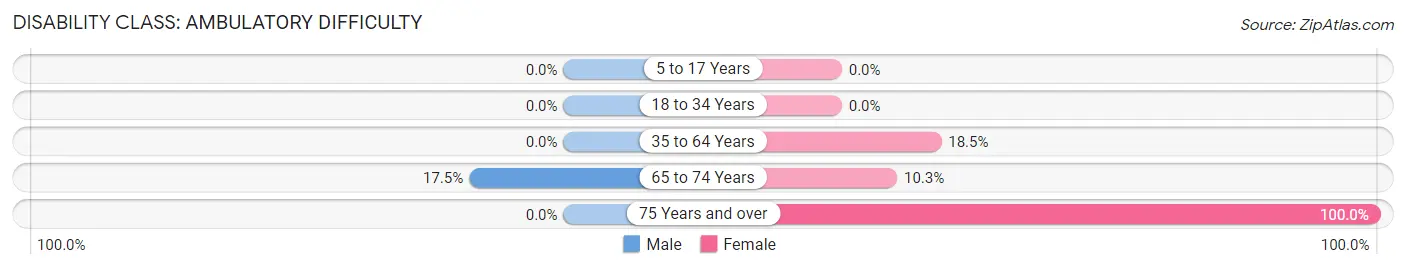
| Age Bracket | Male | Female |
| 5 to 17 Years | 0 (0.0%) | 0 (0.0%) |
| 18 to 34 Years | 0 (0.0%) | 0 (0.0%) |
| 35 to 64 Years | 0 (0.0%) | 24 (18.5%) |
| 65 to 74 Years | 7 (17.5%) | 4 (10.3%) |
| 75 Years and over | 0 (0.0%) | 9 (100.0%) |
Disability Class: Self-Care Difficulty
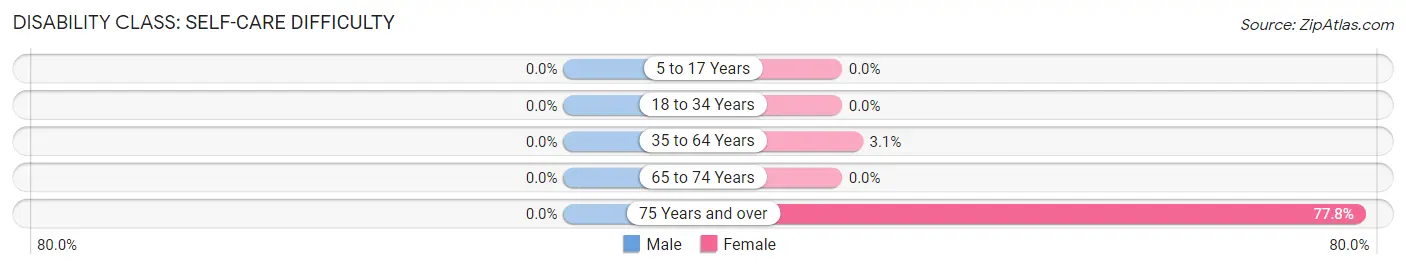
| Age Bracket | Male | Female |
| 5 to 17 Years | 0 (0.0%) | 0 (0.0%) |
| 18 to 34 Years | 0 (0.0%) | 0 (0.0%) |
| 35 to 64 Years | 0 (0.0%) | 4 (3.1%) |
| 65 to 74 Years | 0 (0.0%) | 0 (0.0%) |
| 75 Years and over | 0 (0.0%) | 7 (77.8%) |
Technology Access in Salcha
Computing Device Access in Salcha
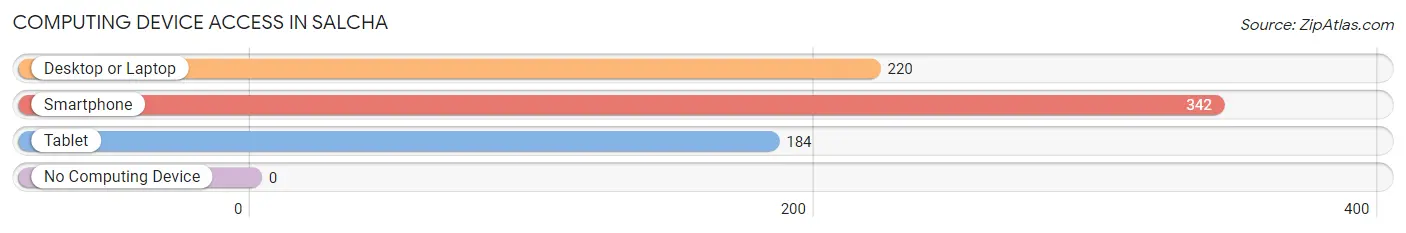
| Device Type | # Households | % Households |
| Desktop or Laptop | 220 | 62.3% |
| Smartphone | 342 | 96.9% |
| Tablet | 184 | 52.1% |
| No Computing Device | 0 | 0.0% |
| Total | 353 | 100.0% |
Internet Access in Salcha
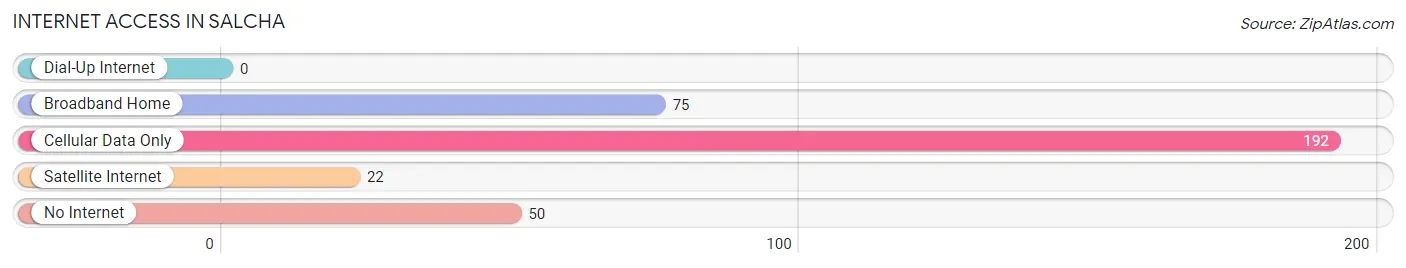
| Internet Type | # Households | % Households |
| Dial-Up Internet | 0 | 0.0% |
| Broadband Home | 75 | 21.2% |
| Cellular Data Only | 192 | 54.4% |
| Satellite Internet | 22 | 6.2% |
| No Internet | 50 | 14.2% |
| Total | 353 | 100.0% |
Salcha Summary
Salcha is a small unincorporated community located in the Fairbanks North Star Borough of Alaska. It is situated on the banks of the Salcha River, approximately 40 miles southeast of Fairbanks. The population of Salcha was estimated to be 545 in 2020.
History
The area around Salcha has been inhabited by the Athabascan people for thousands of years. The first non-native settlers arrived in the area in the late 1800s, and the community was officially established in 1902. The name Salcha is derived from the Athabascan word for “sandy river”.
The early settlers of Salcha were primarily miners and trappers, and the community was largely isolated until the Alaska Railroad was built in 1923. The railroad brought new settlers to the area, and the community began to grow.
In the 1950s, the U.S. Army built a missile launch site near Salcha, which brought new jobs and economic opportunities to the area. The launch site was decommissioned in the 1970s, but the economic impact of the military presence is still felt in the community today.
Geography
Salcha is located in the Tanana Valley, which is part of the Interior of Alaska. The Tanana Valley is a large, flat area surrounded by mountains. The Salcha River runs through the valley, and the community is situated on its banks.
The climate in Salcha is subarctic, with cold winters and mild summers. The average temperature in January is -15°F, and the average temperature in July is 65°F. The area receives an average of 16 inches of precipitation per year.
Economy
The economy of Salcha is largely based on agriculture and tourism. The area is known for its abundant wildlife, and hunting and fishing are popular activities in the area. The community also has a small retail sector, with a few stores and restaurants.
The military presence in the area has also had a positive economic impact on the community. The decommissioned missile launch site is now used as a training facility for the Alaska National Guard, and the military provides jobs and economic opportunities for the residents of Salcha.
Demographics
The population of Salcha is estimated to be 545 in 2020. The racial makeup of the community is predominantly white, with a small percentage of Native American and African American residents. The median household income in Salcha is $50,000, and the median age is 37.
The majority of the population is employed in the agricultural and tourism sectors. The military presence in the area also provides jobs for many of the residents.
Conclusion
Salcha is a small unincorporated community located in the Fairbanks North Star Borough of Alaska. It is situated on the banks of the Salcha River, approximately 40 miles southeast of Fairbanks. The population of Salcha was estimated to be 545 in 2020. The economy of Salcha is largely based on agriculture and tourism, and the military presence in the area has also had a positive economic impact on the community. The racial makeup of the community is predominantly white, with a small percentage of Native American and African American residents.
Common Questions
What is Per Capita Income in Salcha?
Per Capita income in Salcha is $41,694.
What is the Median Family Income in Salcha?
Median Family Income in Salcha is $84,353.
What is the Median Household income in Salcha?
Median Household Income in Salcha is $64,044.
What is Inequality or Gini Index in Salcha?
Inequality or Gini Index in Salcha is 0.41.
What is the Total Population of Salcha?
Total Population of Salcha is 689.
What is the Total Male Population of Salcha?
Total Male Population of Salcha is 413.
What is the Total Female Population of Salcha?
Total Female Population of Salcha is 276.
What is the Ratio of Males per 100 Females in Salcha?
There are 149.64 Males per 100 Females in Salcha.
What is the Ratio of Females per 100 Males in Salcha?
There are 66.83 Females per 100 Males in Salcha.
What is the Median Population Age in Salcha?
Median Population Age in Salcha is 50.7 Years.
What is the Average Family Size in Salcha
Average Family Size in Salcha is 2.5 People.
What is the Average Household Size in Salcha
Average Household Size in Salcha is 1.9 People.
How Large is the Labor Force in Salcha?
There are 306 People in the Labor Forcein in Salcha.
What is the Percentage of People in the Labor Force in Salcha?
48.2% of People are in the Labor Force in Salcha.