Cities with the Highest Percentage of Population Employed in Administrative & Support Services in Oklahoma
RELATED REPORTS & OPTIONS
Administrative & Support Services
Oklahoma
Compare Cities
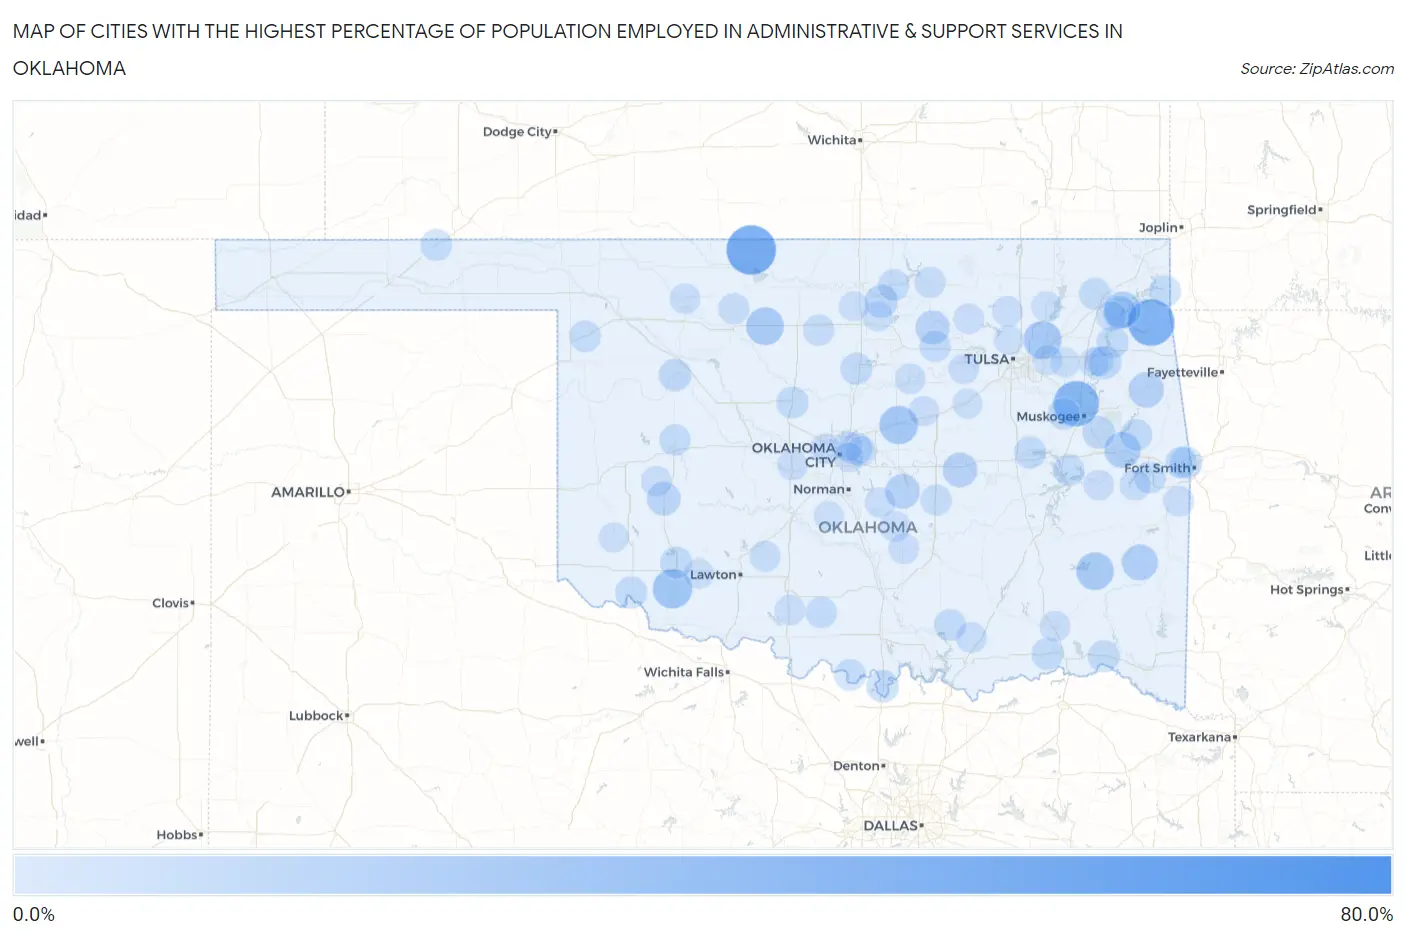
Map of Cities with the Highest Percentage of Population Employed in Administrative & Support Services in Oklahoma
0.0%
80.0%
Cities with the Highest Percentage of Population Employed in Administrative & Support Services in Oklahoma
| City | % Employed | vs State | vs National | |
| 1. | Nelagoney | 66.7% | 3.6%(+63.0)#1 | 4.1%(+62.5)#29 |
| 2. | Amorita | 46.2% | 3.6%(+42.5)#2 | 4.1%(+42.0)#73 |
| 3. | Brush Creek | 40.2% | 3.6%(+36.6)#3 | 4.1%(+36.0)#108 |
| 4. | Tullahassee | 37.5% | 3.6%(+33.9)#4 | 4.1%(+33.4)#119 |
| 5. | Manitou | 25.0% | 3.6%(+21.4)#5 | 4.1%(+20.9)#277 |
| 6. | Elohim | 25.0% | 3.6%(+21.4)#6 | 4.1%(+20.9)#288 |
| 7. | Middleberg | 24.2% | 3.6%(+20.6)#7 | 4.1%(+20.1)#306 |
| 8. | Warwick | 23.2% | 3.6%(+19.6)#8 | 4.1%(+19.0)#334 |
| 9. | Valley Park | 22.2% | 3.6%(+18.6)#9 | 4.1%(+18.1)#370 |
| 10. | Meno | 21.7% | 3.6%(+18.1)#10 | 4.1%(+17.5)#387 |
| 11. | Tuskahoma | 21.4% | 3.6%(+17.8)#11 | 4.1%(+17.3)#395 |
| 12. | Sportmans Shores | 20.8% | 3.6%(+17.2)#12 | 4.1%(+16.7)#411 |
| 13. | Grand Lake Towne | 19.2% | 3.6%(+15.6)#13 | 4.1%(+15.1)#476 |
| 14. | Carlisle | 18.3% | 3.6%(+14.7)#14 | 4.1%(+14.2)#517 |
| 15. | Whitesboro | 17.9% | 3.6%(+14.3)#15 | 4.1%(+13.8)#548 |
| 16. | Eldon | 16.7% | 3.6%(+13.0)#16 | 4.1%(+12.5)#630 |
| 17. | Brooksville | 15.8% | 3.6%(+12.2)#17 | 4.1%(+11.6)#703 |
| 18. | Washita | 15.6% | 3.6%(+11.9)#18 | 4.1%(+11.4)#728 |
| 19. | Cromwell | 15.4% | 3.6%(+11.8)#19 | 4.1%(+11.2)#755 |
| 20. | Welty | 14.9% | 3.6%(+11.3)#20 | 4.1%(+10.7)#810 |
| 21. | Skedee | 14.3% | 3.6%(+10.7)#21 | 4.1%(+10.1)#907 |
| 22. | Rocky | 13.6% | 3.6%(+10.0)#22 | 4.1%(+9.49)#1,008 |
| 23. | Mallard Bay | 12.7% | 3.6%(+9.08)#23 | 4.1%(+8.55)#1,177 |
| 24. | Langley | 12.2% | 3.6%(+8.54)#24 | 4.1%(+8.01)#1,275 |
| 25. | Marland | 12.0% | 3.6%(+8.38)#25 | 4.1%(+7.85)#1,311 |
| 26. | Cedar Crest | 11.5% | 3.6%(+7.92)#26 | 4.1%(+7.39)#1,419 |
| 27. | Spencer | 11.4% | 3.6%(+7.77)#27 | 4.1%(+7.23)#1,446 |
| 28. | River Bottom | 11.4% | 3.6%(+7.75)#28 | 4.1%(+7.21)#1,453 |
| 29. | Taloga | 11.1% | 3.6%(+7.49)#29 | 4.1%(+6.96)#1,514 |
| 30. | Haywood | 11.1% | 3.6%(+7.49)#30 | 4.1%(+6.96)#1,515 |
| 31. | Thackerville | 10.9% | 3.6%(+7.33)#31 | 4.1%(+6.80)#1,572 |
| 32. | Moffett | 10.5% | 3.6%(+6.91)#32 | 4.1%(+6.38)#1,691 |
| 33. | Swink | 10.5% | 3.6%(+6.91)#33 | 4.1%(+6.38)#1,693 |
| 34. | Pump Back | 10.5% | 3.6%(+6.85)#34 | 4.1%(+6.32)#1,715 |
| 35. | Mountain Park | 10.4% | 3.6%(+6.78)#35 | 4.1%(+6.25)#1,744 |
| 36. | Hoffman | 10.3% | 3.6%(+6.73)#36 | 4.1%(+6.20)#1,766 |
| 37. | Kingfisher | 10.3% | 3.6%(+6.71)#37 | 4.1%(+6.17)#1,773 |
| 38. | Taft | 10.3% | 3.6%(+6.64)#38 | 4.1%(+6.11)#1,799 |
| 39. | Mulhall | 10.2% | 3.6%(+6.55)#39 | 4.1%(+6.02)#1,829 |
| 40. | Evening Shade | 10.0% | 3.6%(+6.38)#40 | 4.1%(+5.85)#1,900 |
| 41. | Soper | 10.0% | 3.6%(+6.38)#41 | 4.1%(+5.85)#1,903 |
| 42. | Fittstown | 10.0% | 3.6%(+6.38)#42 | 4.1%(+5.85)#1,916 |
| 43. | Elmer | 10.0% | 3.6%(+6.38)#43 | 4.1%(+5.85)#1,918 |
| 44. | Gage | 9.9% | 3.6%(+6.25)#44 | 4.1%(+5.72)#1,964 |
| 45. | White Oak | 9.9% | 3.6%(+6.24)#45 | 4.1%(+5.71)#1,968 |
| 46. | Tyrone | 9.6% | 3.6%(+5.97)#46 | 4.1%(+5.43)#2,084 |
| 47. | Milburn | 9.5% | 3.6%(+5.91)#47 | 4.1%(+5.37)#2,109 |
| 48. | Little Rock | 9.5% | 3.6%(+5.91)#48 | 4.1%(+5.37)#2,112 |
| 49. | Cowlington | 9.5% | 3.6%(+5.91)#49 | 4.1%(+5.37)#2,113 |
| 50. | Leon | 9.5% | 3.6%(+5.91)#50 | 4.1%(+5.37)#2,115 |
| 51. | Cayuga | 9.4% | 3.6%(+5.76)#51 | 4.1%(+5.23)#2,183 |
| 52. | Roland | 9.2% | 3.6%(+5.56)#52 | 4.1%(+5.03)#2,274 |
| 53. | Loco | 9.1% | 3.6%(+5.47)#53 | 4.1%(+4.94)#2,331 |
| 54. | Maramec | 9.1% | 3.6%(+5.47)#54 | 4.1%(+4.94)#2,332 |
| 55. | Texanna | 9.1% | 3.6%(+5.44)#55 | 4.1%(+4.90)#2,348 |
| 56. | Mccord | 9.1% | 3.6%(+5.43)#56 | 4.1%(+4.90)#2,350 |
| 57. | Arapaho | 8.9% | 3.6%(+5.29)#57 | 4.1%(+4.76)#2,427 |
| 58. | Bowlegs | 8.9% | 3.6%(+5.25)#58 | 4.1%(+4.72)#2,457 |
| 59. | Fairmont | 8.7% | 3.6%(+5.13)#59 | 4.1%(+4.60)#2,527 |
| 60. | Baron | 8.5% | 3.6%(+4.87)#60 | 4.1%(+4.34)#2,690 |
| 61. | Aline | 8.5% | 3.6%(+4.86)#61 | 4.1%(+4.32)#2,695 |
| 62. | Burbank | 8.3% | 3.6%(+4.72)#62 | 4.1%(+4.18)#2,794 |
| 63. | Keota | 8.3% | 3.6%(+4.67)#63 | 4.1%(+4.13)#2,818 |
| 64. | Toppers | 8.2% | 3.6%(+4.61)#64 | 4.1%(+4.08)#2,849 |
| 65. | Kenefic | 8.1% | 3.6%(+4.45)#65 | 4.1%(+3.91)#2,956 |
| 66. | Sterling | 8.1% | 3.6%(+4.44)#66 | 4.1%(+3.91)#2,959 |
| 67. | Dill City | 7.8% | 3.6%(+4.18)#67 | 4.1%(+3.65)#3,146 |
| 68. | Taylor Ferry | 7.8% | 3.6%(+4.18)#68 | 4.1%(+3.65)#3,149 |
| 69. | Wanette | 7.8% | 3.6%(+4.16)#69 | 4.1%(+3.63)#3,162 |
| 70. | Waynoka | 7.7% | 3.6%(+4.10)#70 | 4.1%(+3.57)#3,205 |
| 71. | Lawrence Creek | 7.7% | 3.6%(+4.07)#71 | 4.1%(+3.54)#3,229 |
| 72. | Hominy | 7.7% | 3.6%(+4.06)#72 | 4.1%(+3.53)#3,239 |
| 73. | Avant | 7.6% | 3.6%(+3.99)#73 | 4.1%(+3.46)#3,301 |
| 74. | Ripley | 7.5% | 3.6%(+3.93)#74 | 4.1%(+3.40)#3,342 |
| 75. | Kendrick | 7.5% | 3.6%(+3.88)#75 | 4.1%(+3.35)#3,400 |
| 76. | Antlers | 7.5% | 3.6%(+3.87)#76 | 4.1%(+3.34)#3,410 |
| 77. | Stratford | 7.4% | 3.6%(+3.83)#77 | 4.1%(+3.30)#3,453 |
| 78. | Whitefield | 7.4% | 3.6%(+3.81)#78 | 4.1%(+3.28)#3,473 |
| 79. | Etowah | 7.4% | 3.6%(+3.79)#79 | 4.1%(+3.26)#3,494 |
| 80. | Lake Aluma | 7.4% | 3.6%(+3.79)#80 | 4.1%(+3.26)#3,496 |
| 81. | Union City | 7.3% | 3.6%(+3.69)#81 | 4.1%(+3.15)#3,586 |
| 82. | Cameron | 7.3% | 3.6%(+3.64)#82 | 4.1%(+3.11)#3,622 |
| 83. | Bethany | 7.2% | 3.6%(+3.62)#83 | 4.1%(+3.09)#3,647 |
| 84. | Comanche | 7.2% | 3.6%(+3.57)#84 | 4.1%(+3.04)#3,694 |
| 85. | Indiahoma | 6.8% | 3.6%(+3.20)#85 | 4.1%(+2.67)#4,076 |
| 86. | Fair Oaks | 6.8% | 3.6%(+3.20)#86 | 4.1%(+2.67)#4,078 |
| 87. | Talala | 6.7% | 3.6%(+3.10)#87 | 4.1%(+2.57)#4,172 |
| 88. | Pin Oak Acres | 6.7% | 3.6%(+3.07)#88 | 4.1%(+2.54)#4,197 |
| 89. | Bristow | 6.7% | 3.6%(+3.07)#89 | 4.1%(+2.53)#4,204 |
| 90. | Red Rock | 6.7% | 3.6%(+3.05)#90 | 4.1%(+2.52)#4,233 |
| 91. | Sperry | 6.7% | 3.6%(+3.03)#91 | 4.1%(+2.50)#4,259 |
| 92. | Nicoma Park | 6.6% | 3.6%(+3.02)#92 | 4.1%(+2.49)#4,277 |
| 93. | Dibble | 6.5% | 3.6%(+2.90)#93 | 4.1%(+2.37)#4,410 |
| 94. | Pensacola | 6.5% | 3.6%(+2.90)#94 | 4.1%(+2.37)#4,420 |
| 95. | Billings | 6.5% | 3.6%(+2.89)#95 | 4.1%(+2.36)#4,436 |
| 96. | Mangum | 6.5% | 3.6%(+2.88)#96 | 4.1%(+2.35)#4,444 |
| 97. | Inola | 6.4% | 3.6%(+2.80)#97 | 4.1%(+2.26)#4,556 |
| 98. | Del City | 6.4% | 3.6%(+2.78)#98 | 4.1%(+2.25)#4,572 |
| 99. | Tonkawa Tribal Housing | 6.4% | 3.6%(+2.77)#99 | 4.1%(+2.23)#4,580 |
| 100. | Murphy | 6.4% | 3.6%(+2.77)#100 | 4.1%(+2.23)#4,585 |
Common Questions
What are the Top 10 Cities with the Highest Percentage of Population Employed in Administrative & Support Services in Oklahoma?
Top 10 Cities with the Highest Percentage of Population Employed in Administrative & Support Services in Oklahoma are:
#1
46.2%
#2
40.2%
#3
37.5%
#4
25.0%
#5
23.2%
#6
22.2%
#7
21.7%
#8
21.4%
#9
19.2%
#10
18.3%
What city has the Highest Percentage of Population Employed in Administrative & Support Services in Oklahoma?
Amorita has the Highest Percentage of Population Employed in Administrative & Support Services in Oklahoma with 46.2%.
What is the Percentage of Population Employed in Administrative & Support Services in the State of Oklahoma?
Percentage of Population Employed in Administrative & Support Services in Oklahoma is 3.6%.
What is the Percentage of Population Employed in Administrative & Support Services in the United States?
Percentage of Population Employed in Administrative & Support Services in the United States is 4.1%.