Kivalina, AK Map & Demographics
Kivalina Map
Kivalina Overview
$17,922
PER CAPITA INCOME
$69,375
AVG FAMILY INCOME
$68,750
AVG HOUSEHOLD INCOME
4.0%
WAGE / INCOME GAP [ % ]
96.0¢/ $1
WAGE / INCOME GAP [ $ ]
0.39
INEQUALITY / GINI INDEX
769
TOTAL POPULATION
457
MALE POPULATION
312
FEMALE POPULATION
146.47
MALES / 100 FEMALES
68.27
FEMALES / 100 MALES
24.3
MEDIAN AGE
5.7
AVG FAMILY SIZE
5.3
AVG HOUSEHOLD SIZE
260
LABOR FORCE [ PEOPLE ]
56.4%
PERCENT IN LABOR FORCE
22.5%
UNEMPLOYMENT RATE
Kivalina Zip Codes
Kivalina Area Codes
Income in Kivalina
Income Overview in Kivalina
Per Capita Income in Kivalina is $17,922, while median incomes of families and households are $69,375 and $68,750 respectively.
| Characteristic | Number | Measure |
| Per Capita Income | 769 | $17,922 |
| Median Family Income | 123 | $69,375 |
| Mean Family Income | 123 | $83,346 |
| Median Household Income | 144 | $68,750 |
| Mean Household Income | 144 | $81,782 |
| Income Deficit | 123 | $0 |
| Wage / Income Gap (%) | 769 | 4.03% |
| Wage / Income Gap ($) | 769 | 95.97¢ per $1 |
| Gini / Inequality Index | 769 | 0.39 |
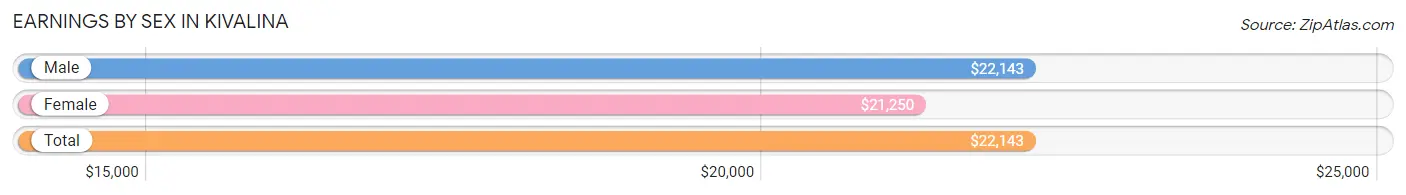
Earnings by Sex in Kivalina
Average Earnings in Kivalina are $22,143, $22,143 for men and $21,250 for women, a difference of 4.0%.
| Sex | Number | Average Earnings |
| Male | 194 (63.4%) | $22,143 |
| Female | 112 (36.6%) | $21,250 |
| Total | 306 (100.0%) | $22,143 |
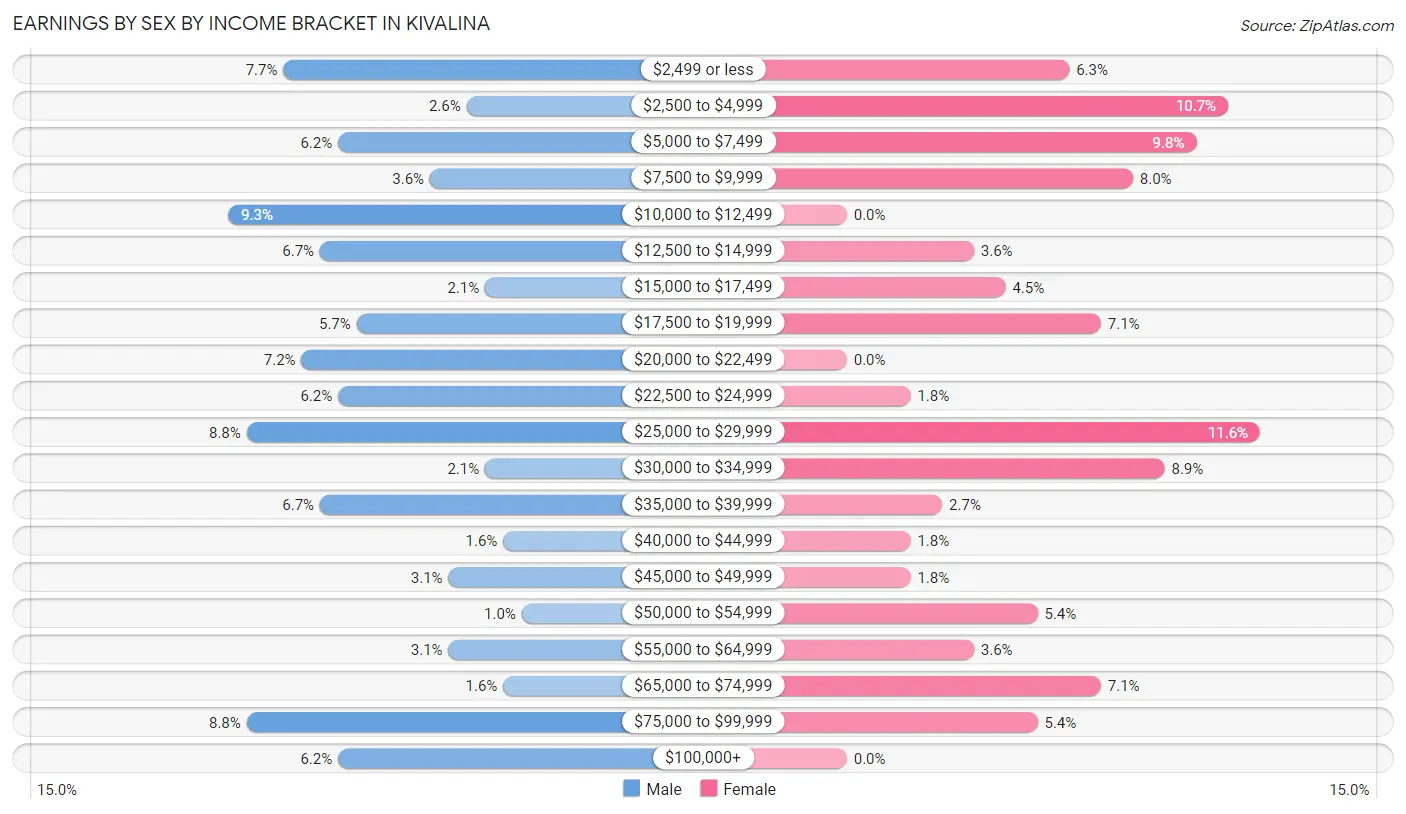
Earnings by Sex by Income Bracket in Kivalina
The most common earnings brackets in Kivalina are $10,000 to $12,499 for men (18 | 9.3%) and $25,000 to $29,999 for women (13 | 11.6%).
| Income | Male | Female |
| $2,499 or less | 15 (7.7%) | 7 (6.2%) |
| $2,500 to $4,999 | 5 (2.6%) | 12 (10.7%) |
| $5,000 to $7,499 | 12 (6.2%) | 11 (9.8%) |
| $7,500 to $9,999 | 7 (3.6%) | 9 (8.0%) |
| $10,000 to $12,499 | 18 (9.3%) | 0 (0.0%) |
| $12,500 to $14,999 | 13 (6.7%) | 4 (3.6%) |
| $15,000 to $17,499 | 4 (2.1%) | 5 (4.5%) |
| $17,500 to $19,999 | 11 (5.7%) | 8 (7.1%) |
| $20,000 to $22,499 | 14 (7.2%) | 0 (0.0%) |
| $22,500 to $24,999 | 12 (6.2%) | 2 (1.8%) |
| $25,000 to $29,999 | 17 (8.8%) | 13 (11.6%) |
| $30,000 to $34,999 | 4 (2.1%) | 10 (8.9%) |
| $35,000 to $39,999 | 13 (6.7%) | 3 (2.7%) |
| $40,000 to $44,999 | 3 (1.5%) | 2 (1.8%) |
| $45,000 to $49,999 | 6 (3.1%) | 2 (1.8%) |
| $50,000 to $54,999 | 2 (1.0%) | 6 (5.4%) |
| $55,000 to $64,999 | 6 (3.1%) | 4 (3.6%) |
| $65,000 to $74,999 | 3 (1.5%) | 8 (7.1%) |
| $75,000 to $99,999 | 17 (8.8%) | 6 (5.4%) |
| $100,000+ | 12 (6.2%) | 0 (0.0%) |
| Total | 194 (100.0%) | 112 (100.0%) |
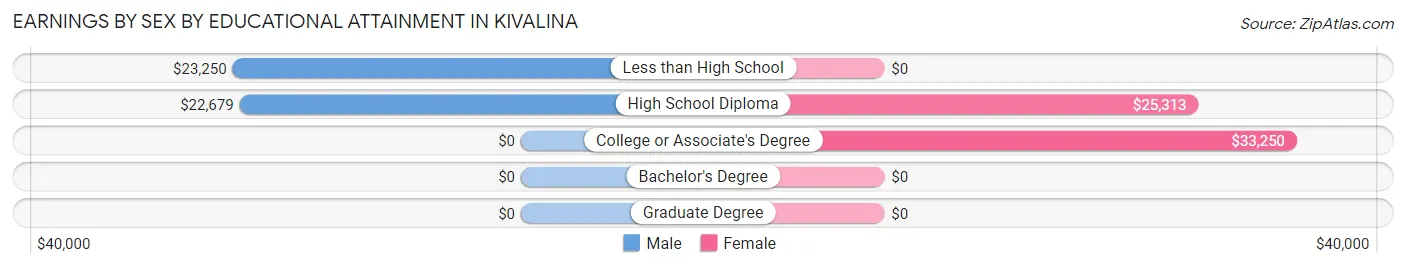
Earnings by Sex by Educational Attainment in Kivalina
Average earnings in Kivalina are $23,646 for men and $25,313 for women, a difference of 6.6%. Men with an educational attainment of less than high school enjoy the highest average annual earnings of $23,250, while those with high school diploma education earn the least with $22,679. Women with an educational attainment of college or associate's degree earn the most with the average annual earnings of $33,250, while those with high school diploma education have the smallest earnings of $25,313.
| Educational Attainment | Male Income | Female Income |
| Less than High School | $23,250 | $0 |
| High School Diploma | $22,679 | $25,313 |
| College or Associate's Degree | - | - |
| Bachelor's Degree | - | - |
| Graduate Degree | - | - |
| Total | $23,646 | $25,313 |
Family Income in Kivalina
Family Income Brackets in Kivalina
According to the Kivalina family income data, there are 30 families falling into the $50,000 to $74,999 income range, which is the most common income bracket and makes up 24.4% of all families. Conversely, the less than $10,000 income bracket is the least frequent group with only 4 families (3.3%) belonging to this category.
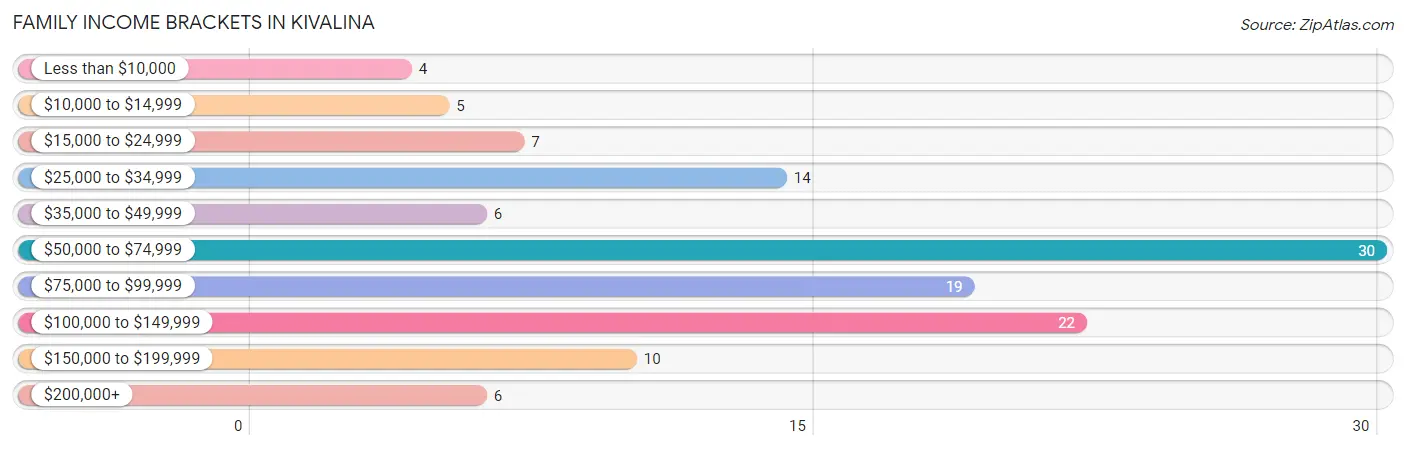
| Income Bracket | # Families | % Families |
| Less than $10,000 | 4 | 3.3% |
| $10,000 to $14,999 | 5 | 4.1% |
| $15,000 to $24,999 | 7 | 5.7% |
| $25,000 to $34,999 | 14 | 11.4% |
| $35,000 to $49,999 | 6 | 4.9% |
| $50,000 to $74,999 | 30 | 24.4% |
| $75,000 to $99,999 | 19 | 15.4% |
| $100,000 to $149,999 | 22 | 17.9% |
| $150,000 to $199,999 | 10 | 8.1% |
| $200,000+ | 6 | 4.9% |
Family Income by Famaliy Size in Kivalina
6-person families (12 | 9.8%) account for the highest median family income in Kivalina with $135,357 per family, while 2-person families (8 | 6.5%) have the highest median income of $29,375 per family member.
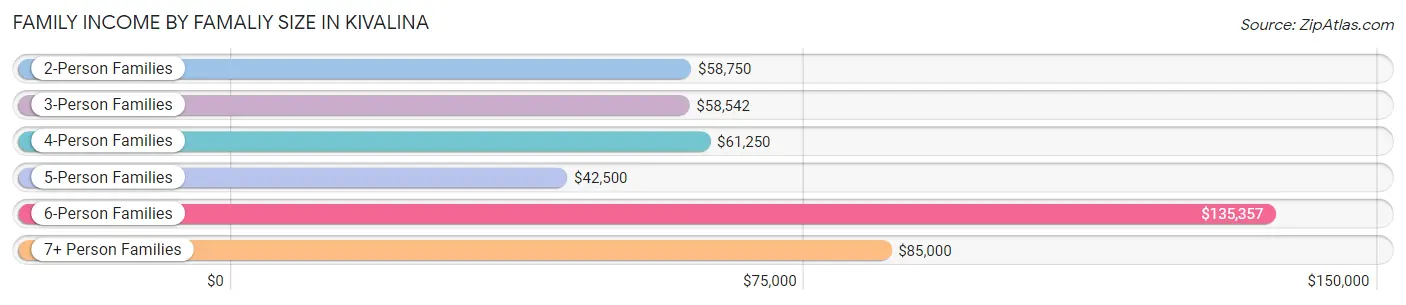
| Income Bracket | # Families | Median Income |
| 2-Person Families | 8 (6.5%) | $58,750 |
| 3-Person Families | 19 (15.4%) | $58,542 |
| 4-Person Families | 32 (26.0%) | $61,250 |
| 5-Person Families | 20 (16.3%) | $42,500 |
| 6-Person Families | 12 (9.8%) | $135,357 |
| 7+ Person Families | 32 (26.0%) | $85,000 |
| Total | 123 (100.0%) | $69,375 |
Family Income by Number of Earners in Kivalina
The median family income in Kivalina is $69,375, with families comprising 3+ earners (36) having the highest median family income of $105,000, while families with no earners (16) have the lowest median family income of $15,833, accounting for 29.3% and 13.0% of families, respectively.
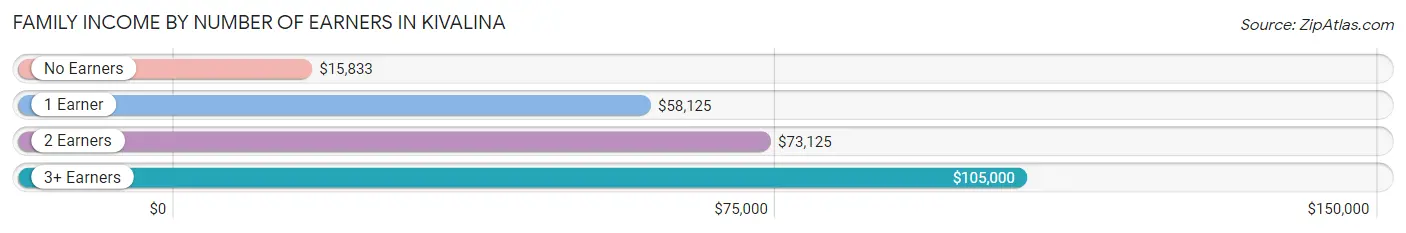
| Number of Earners | # Families | Median Income |
| No Earners | 16 (13.0%) | $15,833 |
| 1 Earner | 34 (27.6%) | $58,125 |
| 2 Earners | 37 (30.1%) | $73,125 |
| 3+ Earners | 36 (29.3%) | $105,000 |
| Total | 123 (100.0%) | $69,375 |
Household Income in Kivalina
Household Income Brackets in Kivalina
With 30 households falling in the category, the $50,000 to $74,999 income range is the most frequent in Kivalina, accounting for 20.8% of all households. In contrast, only 5 households (3.5%) fall into the $10,000 to $14,999 income bracket, making it the least populous group.
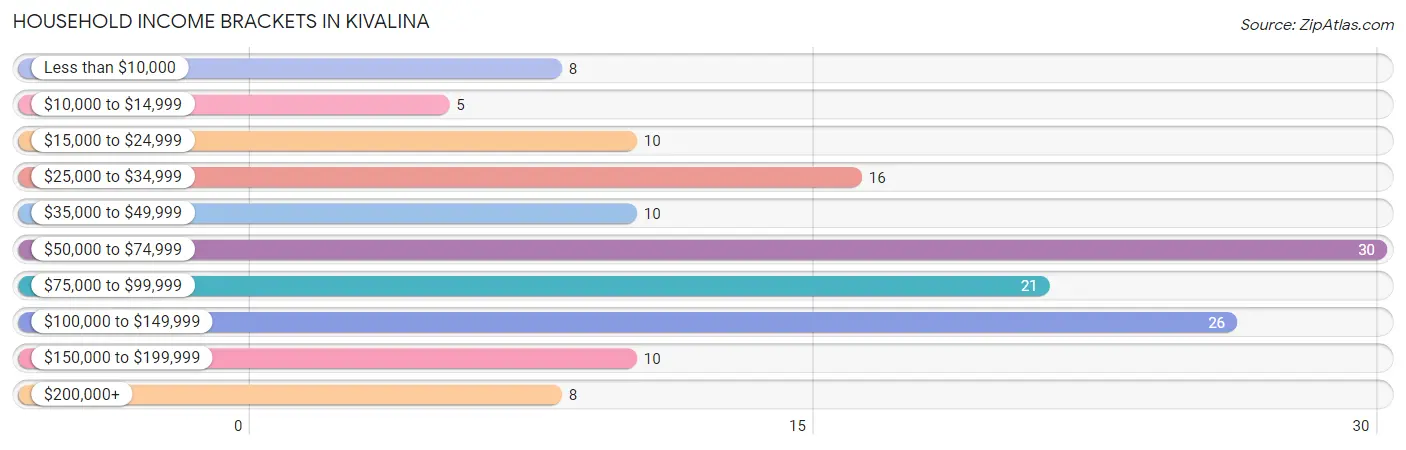
| Income Bracket | # Households | % Households |
| Less than $10,000 | 8 | 5.6% |
| $10,000 to $14,999 | 5 | 3.5% |
| $15,000 to $24,999 | 10 | 6.9% |
| $25,000 to $34,999 | 16 | 11.1% |
| $35,000 to $49,999 | 10 | 6.9% |
| $50,000 to $74,999 | 30 | 20.8% |
| $75,000 to $99,999 | 21 | 14.6% |
| $100,000 to $149,999 | 26 | 18.1% |
| $150,000 to $199,999 | 10 | 6.9% |
| $200,000+ | 8 | 5.6% |
Household Income by Householder Age in Kivalina
The median household income in Kivalina is $68,750, with the highest median household income of $78,125 found in the 45 to 64 years age bracket for the primary householder. A total of 69 households (47.9%) fall into this category. Meanwhile, the 15 to 24 years age bracket for the primary householder has the lowest median household income of $0, with 6 households (4.2%) in this group.
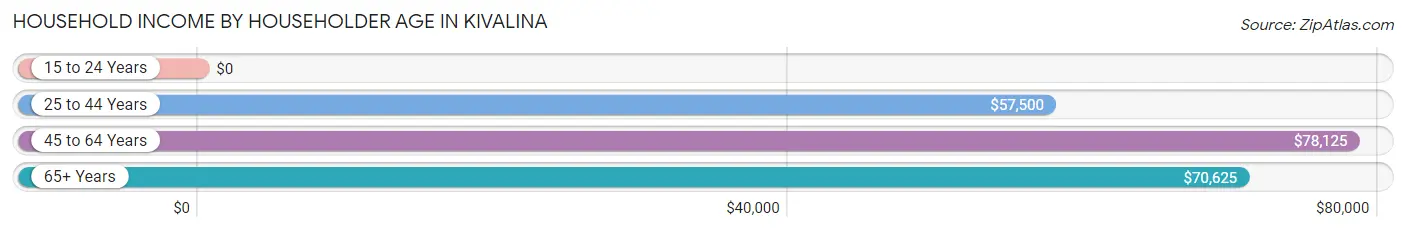
| Income Bracket | # Households | Median Income |
| 15 to 24 Years | 6 (4.2%) | $0 |
| 25 to 44 Years | 46 (31.9%) | $57,500 |
| 45 to 64 Years | 69 (47.9%) | $78,125 |
| 65+ Years | 23 (16.0%) | $70,625 |
| Total | 144 (100.0%) | $68,750 |
Poverty in Kivalina
Income Below Poverty by Sex and Age in Kivalina
With 21.2% poverty level for males and 24.3% for females among the residents of Kivalina, 15 year old males and 5 year old females are the most vulnerable to poverty, with 3 males (60.0%) and 4 females (66.7%) in their respective age groups living below the poverty level.
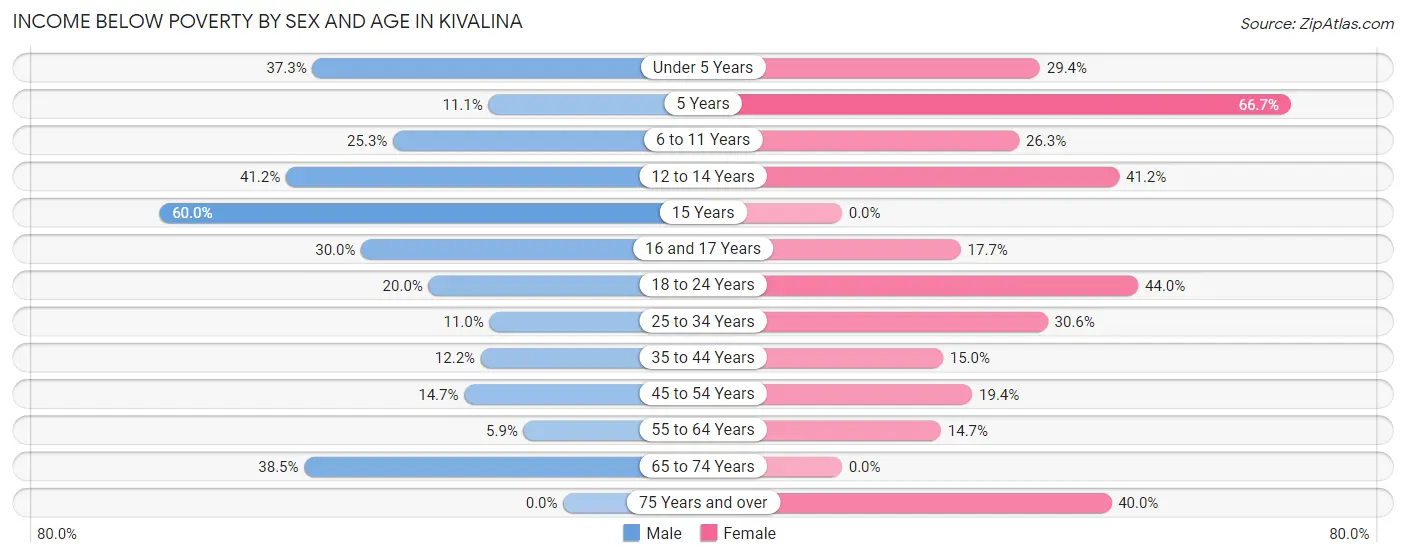
| Age Bracket | Male | Female |
| Under 5 Years | 19 (37.2%) | 10 (29.4%) |
| 5 Years | 2 (11.1%) | 4 (66.7%) |
| 6 to 11 Years | 23 (25.3%) | 10 (26.3%) |
| 12 to 14 Years | 14 (41.2%) | 7 (41.2%) |
| 15 Years | 3 (60.0%) | 0 (0.0%) |
| 16 and 17 Years | 3 (30.0%) | 3 (17.6%) |
| 18 to 24 Years | 7 (20.0%) | 11 (44.0%) |
| 25 to 34 Years | 8 (11.0%) | 11 (30.6%) |
| 35 to 44 Years | 6 (12.2%) | 6 (15.0%) |
| 45 to 54 Years | 5 (14.7%) | 6 (19.4%) |
| 55 to 64 Years | 2 (5.9%) | 5 (14.7%) |
| 65 to 74 Years | 5 (38.5%) | 0 (0.0%) |
| 75 Years and over | 0 (0.0%) | 2 (40.0%) |
| Total | 97 (21.2%) | 75 (24.3%) |
Income Above Poverty by Sex and Age in Kivalina
According to the poverty statistics in Kivalina, males aged 75 years and over and females aged 15 years are the age groups that are most secure financially, with 100.0% of males and 100.0% of females in these age groups living above the poverty line.
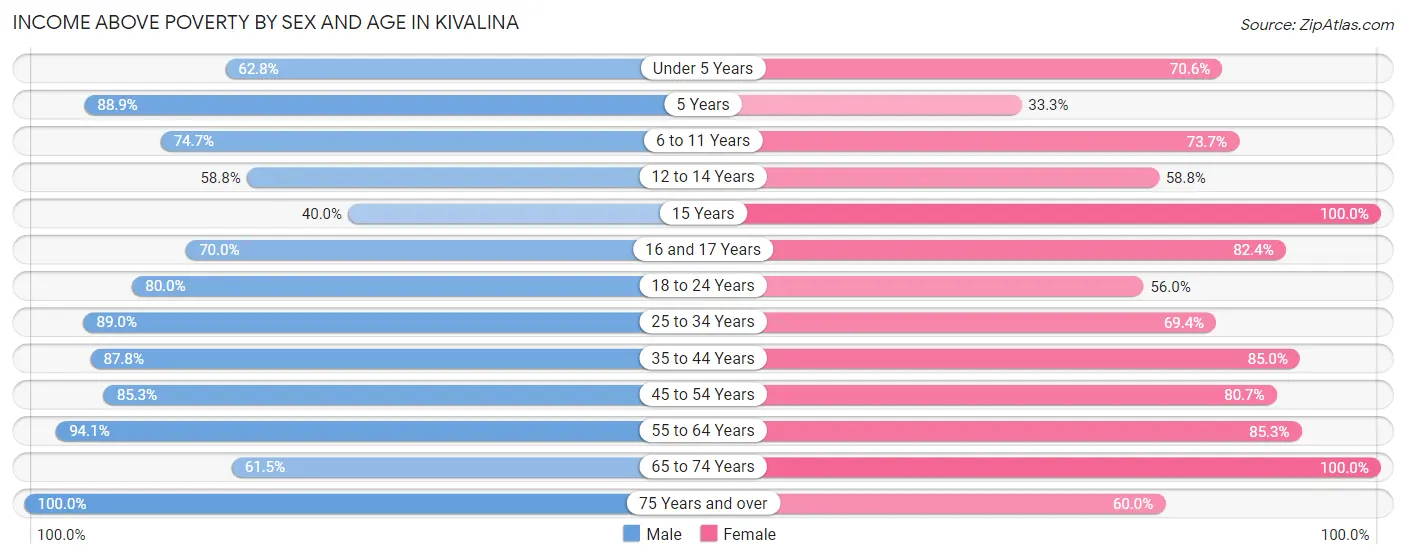
| Age Bracket | Male | Female |
| Under 5 Years | 32 (62.7%) | 24 (70.6%) |
| 5 Years | 16 (88.9%) | 2 (33.3%) |
| 6 to 11 Years | 68 (74.7%) | 28 (73.7%) |
| 12 to 14 Years | 20 (58.8%) | 10 (58.8%) |
| 15 Years | 2 (40.0%) | 11 (100.0%) |
| 16 and 17 Years | 7 (70.0%) | 14 (82.4%) |
| 18 to 24 Years | 28 (80.0%) | 14 (56.0%) |
| 25 to 34 Years | 65 (89.0%) | 25 (69.4%) |
| 35 to 44 Years | 43 (87.8%) | 34 (85.0%) |
| 45 to 54 Years | 29 (85.3%) | 25 (80.6%) |
| 55 to 64 Years | 32 (94.1%) | 29 (85.3%) |
| 65 to 74 Years | 8 (61.5%) | 15 (100.0%) |
| 75 Years and over | 10 (100.0%) | 3 (60.0%) |
| Total | 360 (78.8%) | 234 (75.7%) |
Income Below Poverty Among Married-Couple Families in Kivalina
The poverty statistics for married-couple families in Kivalina show that 7.2% or 5 of the total 69 families live below the poverty line. Families with 5 or more children have the highest poverty rate of 45.5%, comprising of 5 families. On the other hand, families with no children have the lowest poverty rate of 0.0%, which includes 0 families.
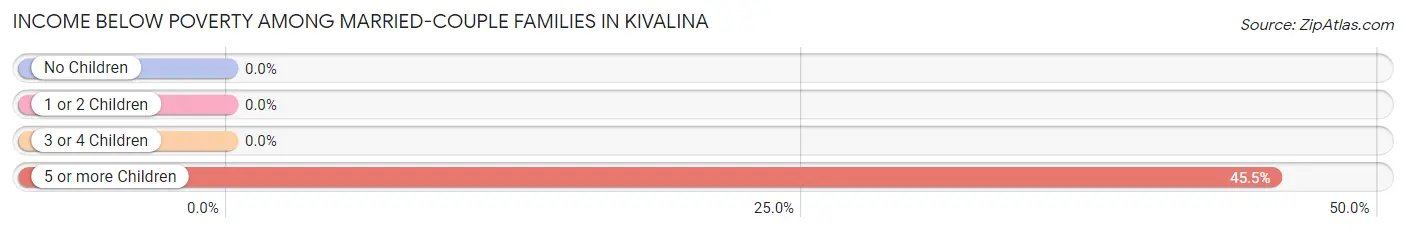
| Children | Above Poverty | Below Poverty |
| No Children | 7 (100.0%) | 0 (0.0%) |
| 1 or 2 Children | 35 (100.0%) | 0 (0.0%) |
| 3 or 4 Children | 16 (100.0%) | 0 (0.0%) |
| 5 or more Children | 6 (54.5%) | 5 (45.5%) |
| Total | 64 (92.7%) | 5 (7.2%) |
Income Below Poverty Among Single-Parent Households in Kivalina
According to the poverty data in Kivalina, 34.8% or 8 single-father households and 29.0% or 9 single-mother households are living below the poverty line. Among single-father households, those with 5 or more children have the highest poverty rate, with 2 households (100.0%) experiencing poverty. Likewise, among single-mother households, those with 5 or more children have the highest poverty rate, with 3 households (50.0%) falling below the poverty line.
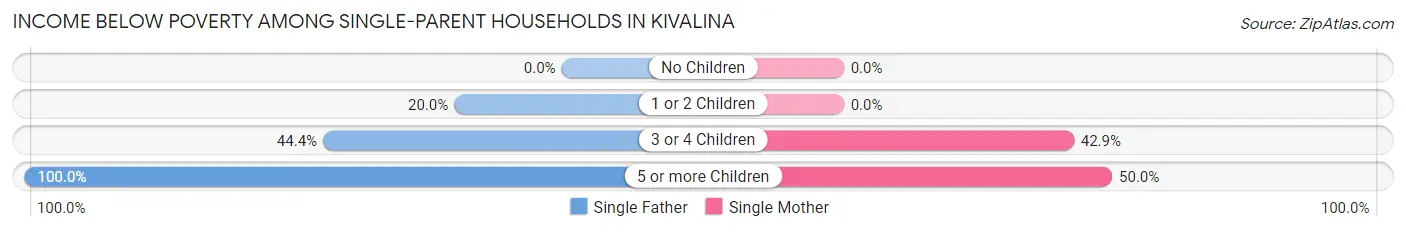
| Children | Single Father | Single Mother |
| No Children | 0 (0.0%) | 0 (0.0%) |
| 1 or 2 Children | 2 (20.0%) | 0 (0.0%) |
| 3 or 4 Children | 4 (44.4%) | 6 (42.9%) |
| 5 or more Children | 2 (100.0%) | 3 (50.0%) |
| Total | 8 (34.8%) | 9 (29.0%) |
Income Below Poverty Among Married-Couple vs Single-Parent Households in Kivalina
The poverty data for Kivalina shows that 5 of the married-couple family households (7.2%) and 17 of the single-parent households (31.5%) are living below the poverty level. Within the married-couple family households, those with 5 or more children have the highest poverty rate, with 5 households (45.5%) falling below the poverty line. Among the single-parent households, those with 5 or more children have the highest poverty rate, with 5 household (62.5%) living below poverty.
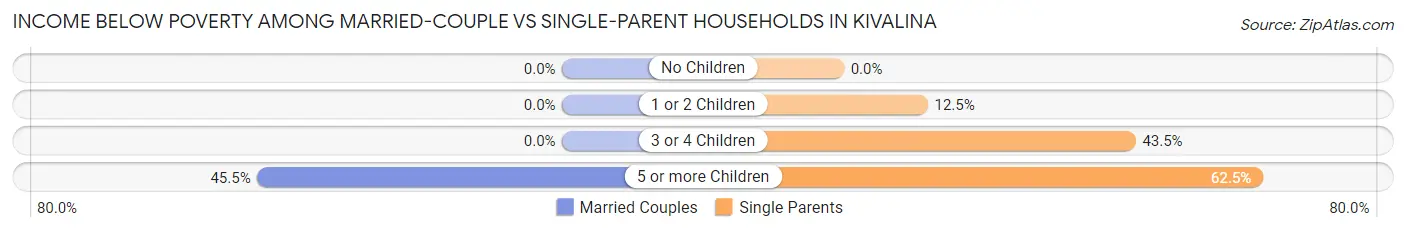
| Children | Married-Couple Families | Single-Parent Households |
| No Children | 0 (0.0%) | 0 (0.0%) |
| 1 or 2 Children | 0 (0.0%) | 2 (12.5%) |
| 3 or 4 Children | 0 (0.0%) | 10 (43.5%) |
| 5 or more Children | 5 (45.5%) | 5 (62.5%) |
| Total | 5 (7.2%) | 17 (31.5%) |
Race in Kivalina
The most populous races in Kivalina are Native / Alaskan (738 | 96.0%), Two or more Races (16 | 2.1%), and White / Caucasian (15 | 1.9%).
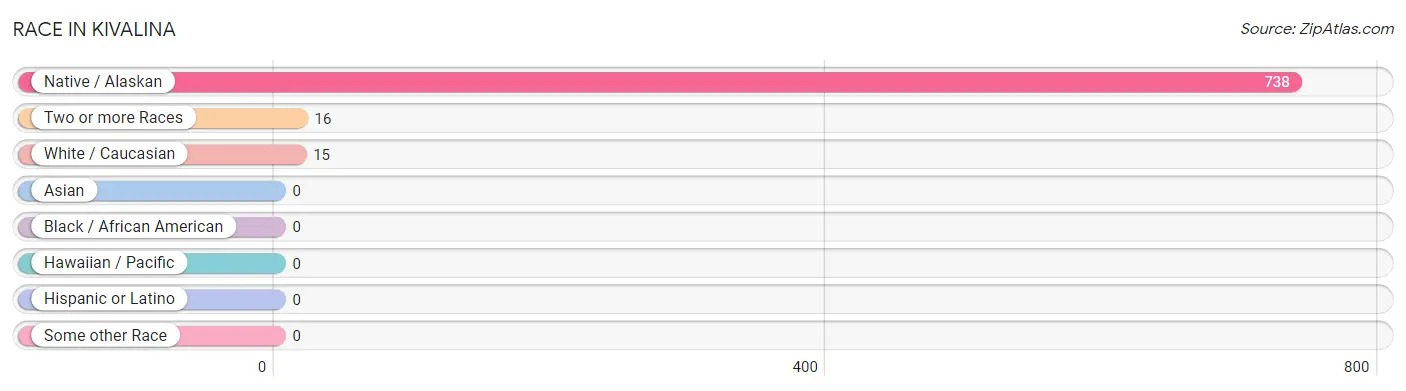
| Race | # Population | % Population |
| Asian | 0 | 0.0% |
| Black / African American | 0 | 0.0% |
| Hawaiian / Pacific | 0 | 0.0% |
| Hispanic or Latino | 0 | 0.0% |
| Native / Alaskan | 738 | 96.0% |
| White / Caucasian | 15 | 1.9% |
| Two or more Races | 16 | 2.1% |
| Some other Race | 0 | 0.0% |
| Total | 769 | 100.0% |
Ancestry in Kivalina
The most populous ancestries reported in Kivalina are Inupiat (747 | 97.1%), English (8 | 1.0%), Irish (6 | 0.8%), Aleut (5 | 0.6%), and German (4 | 0.5%), together accounting for 100.1% of all Kivalina residents.
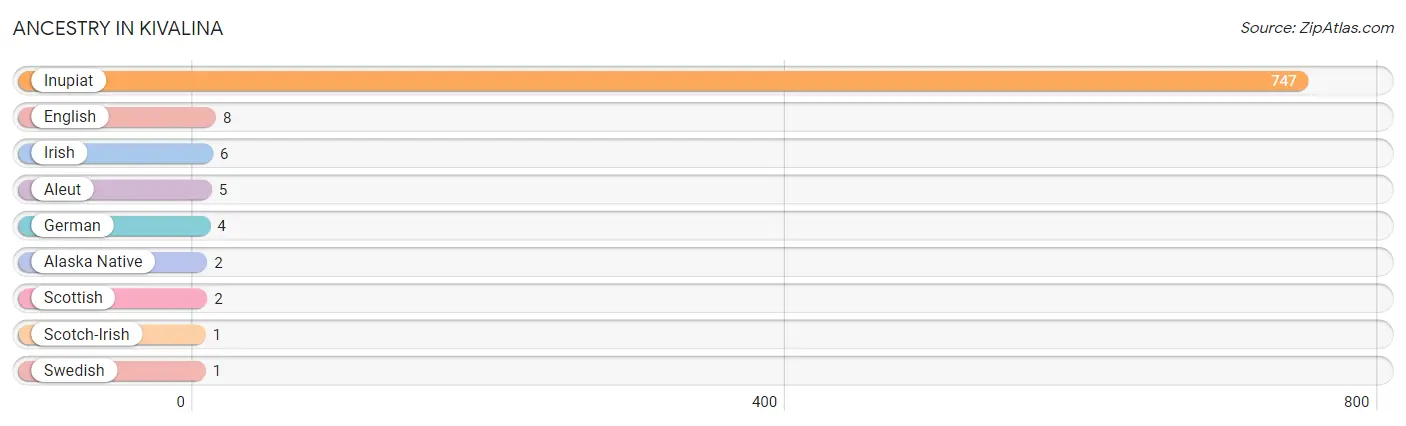
| Ancestry | # Population | % Population |
| Alaska Native | 2 | 0.3% |
| Aleut | 5 | 0.6% |
| English | 8 | 1.0% |
| German | 4 | 0.5% |
| Inupiat | 747 | 97.1% |
| Irish | 6 | 0.8% |
| Scotch-Irish | 1 | 0.1% |
| Scottish | 2 | 0.3% |
| Swedish | 1 | 0.1% | View All 9 Rows |
Immigrants in Kivalina

| Immigration Origin | # Population | % Population | View All 0 Rows |
Sex and Age in Kivalina
Sex and Age in Kivalina
The most populous age groups in Kivalina are 5 to 9 Years (79 | 17.3%) for men and 10 to 14 Years (42 | 13.5%) for women.
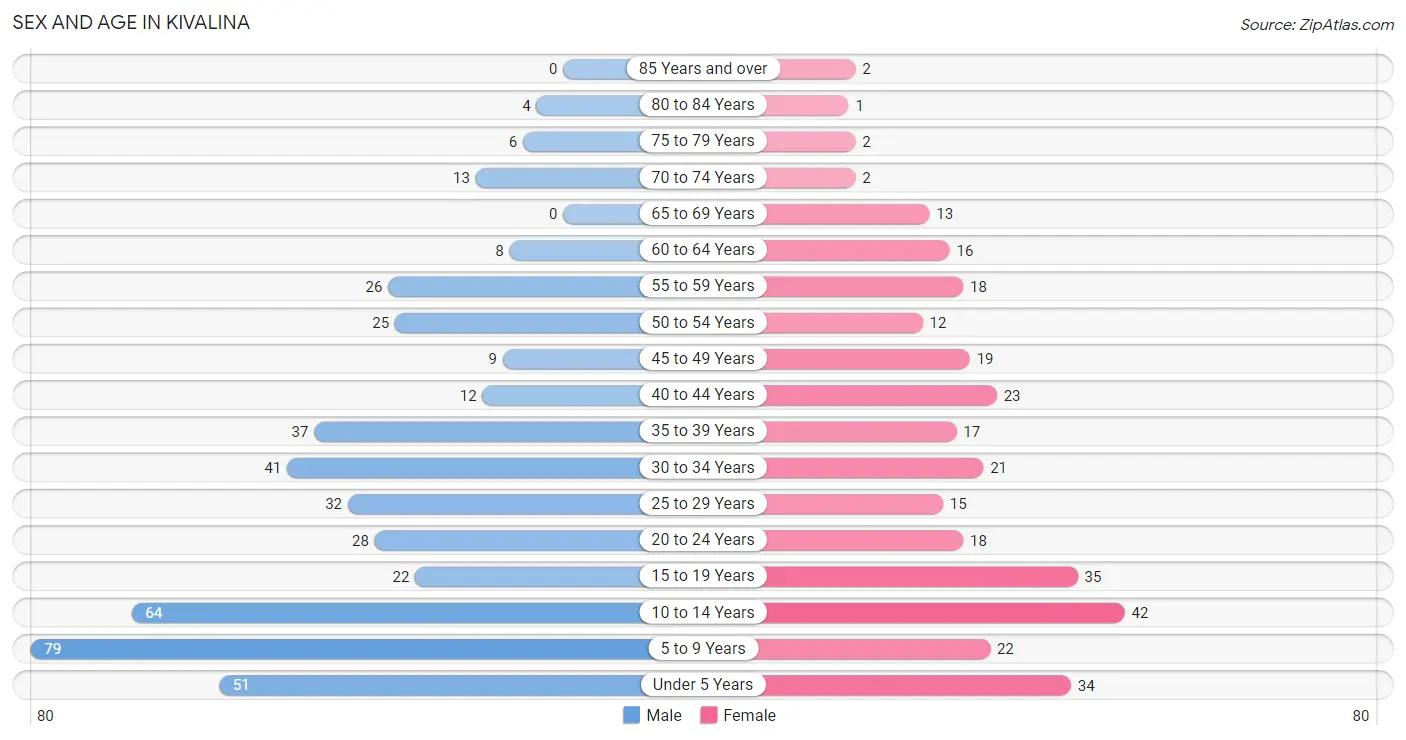
| Age Bracket | Male | Female |
| Under 5 Years | 51 (11.2%) | 34 (10.9%) |
| 5 to 9 Years | 79 (17.3%) | 22 (7.0%) |
| 10 to 14 Years | 64 (14.0%) | 42 (13.5%) |
| 15 to 19 Years | 22 (4.8%) | 35 (11.2%) |
| 20 to 24 Years | 28 (6.1%) | 18 (5.8%) |
| 25 to 29 Years | 32 (7.0%) | 15 (4.8%) |
| 30 to 34 Years | 41 (9.0%) | 21 (6.7%) |
| 35 to 39 Years | 37 (8.1%) | 17 (5.4%) |
| 40 to 44 Years | 12 (2.6%) | 23 (7.4%) |
| 45 to 49 Years | 9 (2.0%) | 19 (6.1%) |
| 50 to 54 Years | 25 (5.5%) | 12 (3.8%) |
| 55 to 59 Years | 26 (5.7%) | 18 (5.8%) |
| 60 to 64 Years | 8 (1.8%) | 16 (5.1%) |
| 65 to 69 Years | 0 (0.0%) | 13 (4.2%) |
| 70 to 74 Years | 13 (2.8%) | 2 (0.6%) |
| 75 to 79 Years | 6 (1.3%) | 2 (0.6%) |
| 80 to 84 Years | 4 (0.9%) | 1 (0.3%) |
| 85 Years and over | 0 (0.0%) | 2 (0.6%) |
| Total | 457 (100.0%) | 312 (100.0%) |
Families and Households in Kivalina
Median Family Size in Kivalina
The median family size in Kivalina is 5.67 persons per family, with single female/mother families (31 | 25.2%) accounting for the largest median family size of 5.94 persons per family. On the other hand, single male/father families (23 | 18.7%) represent the smallest median family size with 4.57 persons per family.
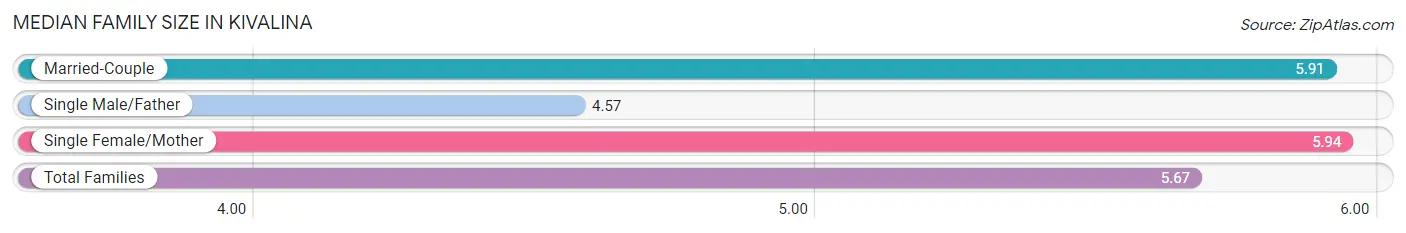
| Family Type | # Families | Family Size |
| Married-Couple | 69 (56.1%) | 5.91 |
| Single Male/Father | 23 (18.7%) | 4.57 |
| Single Female/Mother | 31 (25.2%) | 5.94 |
| Total Families | 123 (100.0%) | 5.67 |
Median Household Size in Kivalina
The median household size in Kivalina is 5.34 persons per household, with single female/mother households (31 | 21.5%) accounting for the largest median household size of 6.42 persons per household. non-family households (21 | 14.6%) represent the smallest median household size with 1.43 persons per household.
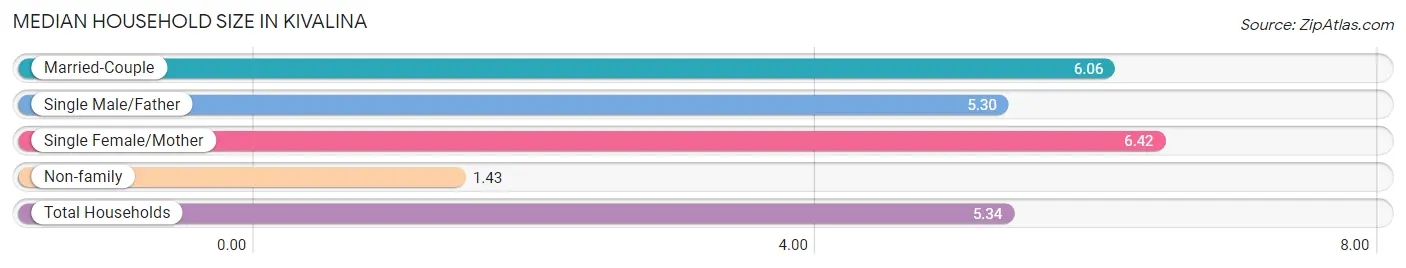
| Household Type | # Households | Household Size |
| Married-Couple | 69 (47.9%) | 6.06 |
| Single Male/Father | 23 (16.0%) | 5.30 |
| Single Female/Mother | 31 (21.5%) | 6.42 |
| Non-family | 21 (14.6%) | 1.43 |
| Total Households | 144 (100.0%) | 5.34 |
Household Size by Marriage Status in Kivalina
Out of a total of 144 households in Kivalina, 123 (85.4%) are family households, while 21 (14.6%) are nonfamily households. The most numerous type of family households are 7+ person households, comprising 37, and the most common type of nonfamily households are 1-person households, comprising 17.
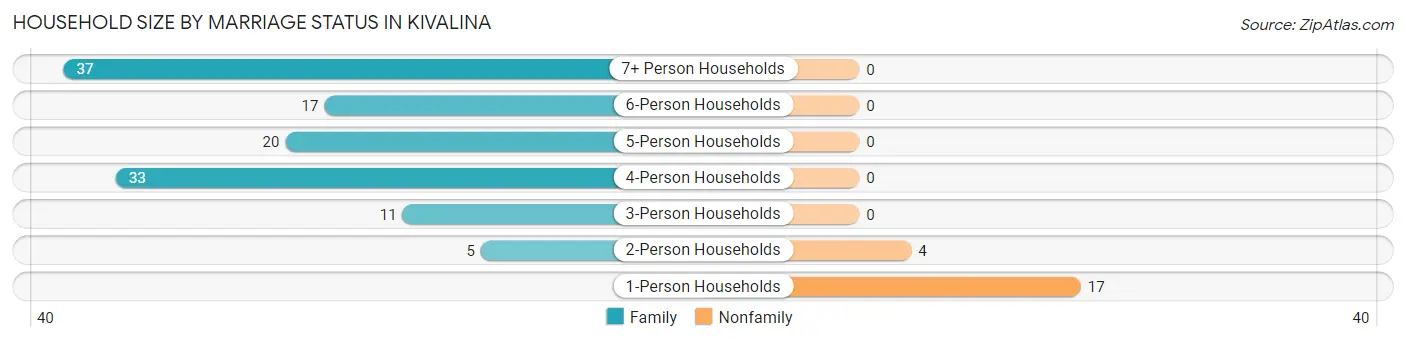
| Household Size | Family Households | Nonfamily Households |
| 1-Person Households | - | 17 (11.8%) |
| 2-Person Households | 5 (3.5%) | 4 (2.8%) |
| 3-Person Households | 11 (7.6%) | 0 (0.0%) |
| 4-Person Households | 33 (22.9%) | 0 (0.0%) |
| 5-Person Households | 20 (13.9%) | 0 (0.0%) |
| 6-Person Households | 17 (11.8%) | 0 (0.0%) |
| 7+ Person Households | 37 (25.7%) | 0 (0.0%) |
| Total | 123 (85.4%) | 21 (14.6%) |
Female Fertility in Kivalina
Fertility by Age in Kivalina
Average fertility rate in Kivalina is 168.0 births per 1,000 women. Women in the age bracket of 20 to 34 years have the highest fertility rate with 426.0 births per 1,000 women. Women in the age bracket of 20 to 34 years acount for 92.0% of all women with births.
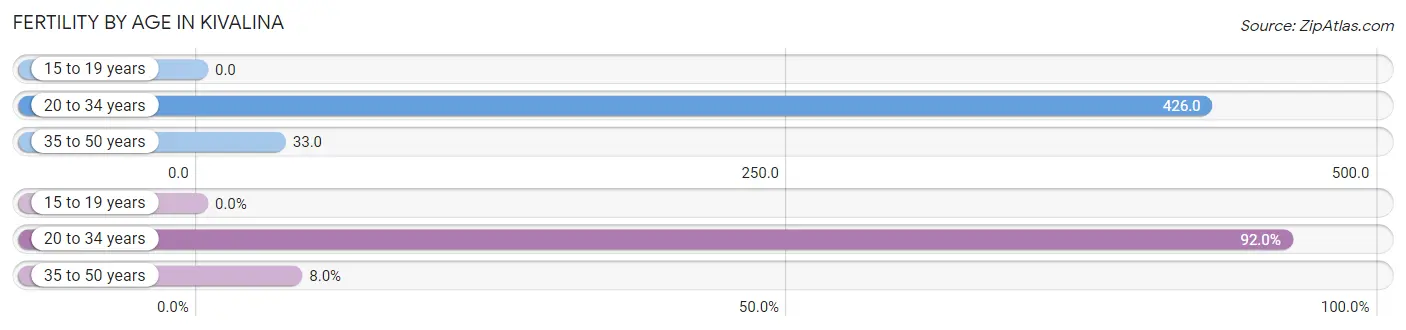
| Age Bracket | Women with Births | Births / 1,000 Women |
| 15 to 19 years | 0 (0.0%) | 0.0 |
| 20 to 34 years | 23 (92.0%) | 426.0 |
| 35 to 50 years | 2 (8.0%) | 33.0 |
| Total | 25 (100.0%) | 168.0 |
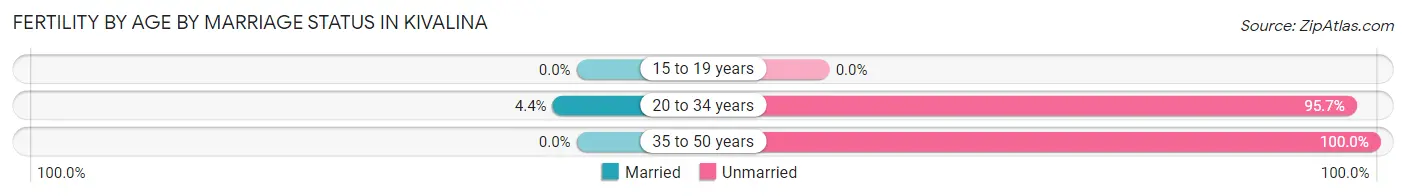
Fertility by Age by Marriage Status in Kivalina
4.0% of women with births (25) in Kivalina are married. The highest percentage of unmarried women with births falls into 35 to 50 years age bracket with 100.0% of them unmarried at the time of birth, while the lowest percentage of unmarried women with births belong to 20 to 34 years age bracket with 95.7% of them unmarried.
| Age Bracket | Married | Unmarried |
| 15 to 19 years | 0 (0.0%) | 0 (0.0%) |
| 20 to 34 years | 1 (4.3%) | 22 (95.7%) |
| 35 to 50 years | 0 (0.0%) | 2 (100.0%) |
| Total | 1 (4.0%) | 24 (96.0%) |
Fertility by Education in Kivalina
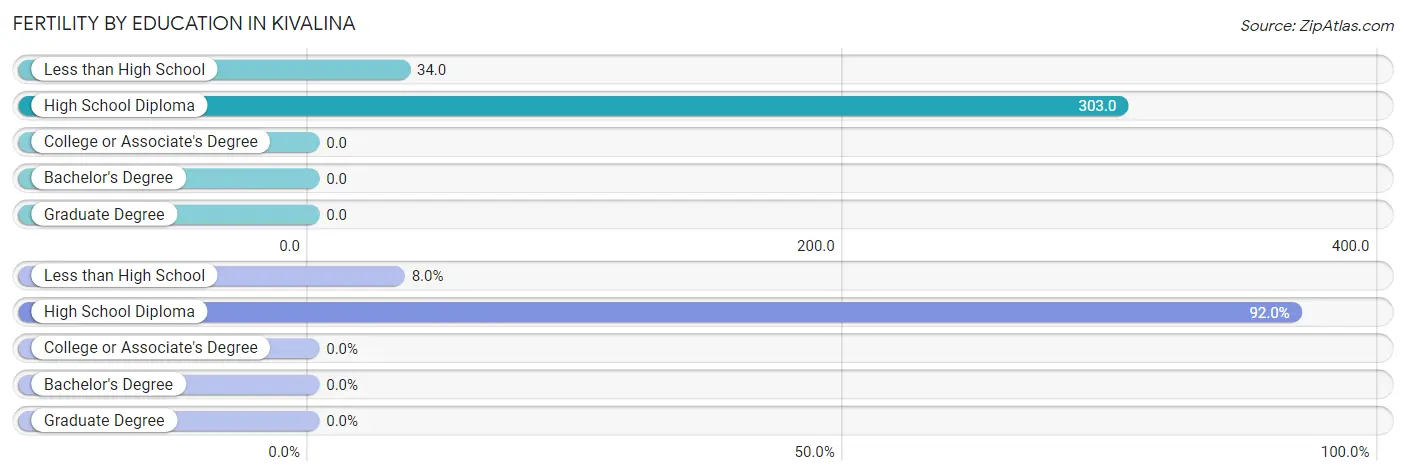
| Educational Attainment | Women with Births | Births / 1,000 Women |
| Less than High School | 2 (8.0%) | 34.0 |
| High School Diploma | 23 (92.0%) | 303.0 |
| College or Associate's Degree | 0 (0.0%) | 0.0 |
| Bachelor's Degree | 0 (0.0%) | 0.0 |
| Graduate Degree | 0 (0.0%) | 0.0 |
| Total | 25 (100.0%) | 168.0 |
Fertility by Education by Marriage Status in Kivalina
96.0% of women with births in Kivalina are unmarried. Women with the educational attainment of high school diploma are most likely to be married with 4.3% of them married at childbirth, while women with the educational attainment of less than high school are least likely to be married with 100.0% of them unmarried at childbirth.
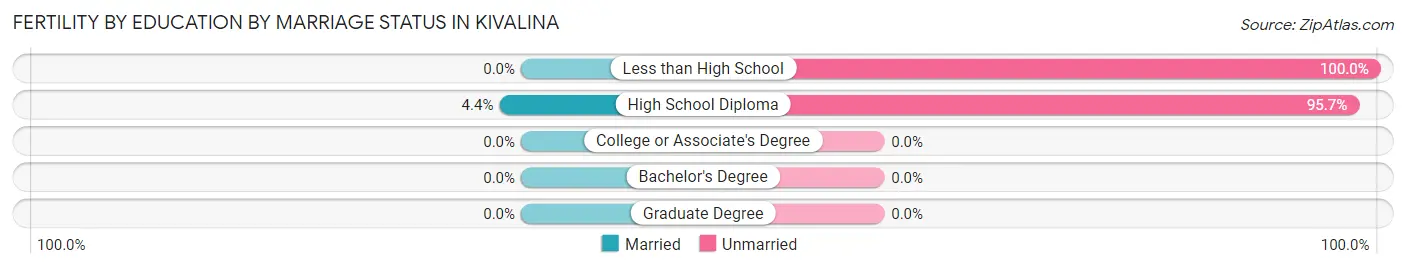
| Educational Attainment | Married | Unmarried |
| Less than High School | 0 (0.0%) | 2 (100.0%) |
| High School Diploma | 1 (4.3%) | 22 (95.7%) |
| College or Associate's Degree | 0 (0.0%) | 0 (0.0%) |
| Bachelor's Degree | 0 (0.0%) | 0 (0.0%) |
| Graduate Degree | 0 (0.0%) | 0 (0.0%) |
| Total | 1 (4.0%) | 24 (96.0%) |
Employment Characteristics in Kivalina
Employment by Class of Employer in Kivalina
Among the 197 employed individuals in Kivalina, local government employees (86 | 43.6%), private company employees (43 | 21.8%), and not-for-profit organizations (27 | 13.7%) make up the most common classes of employment.
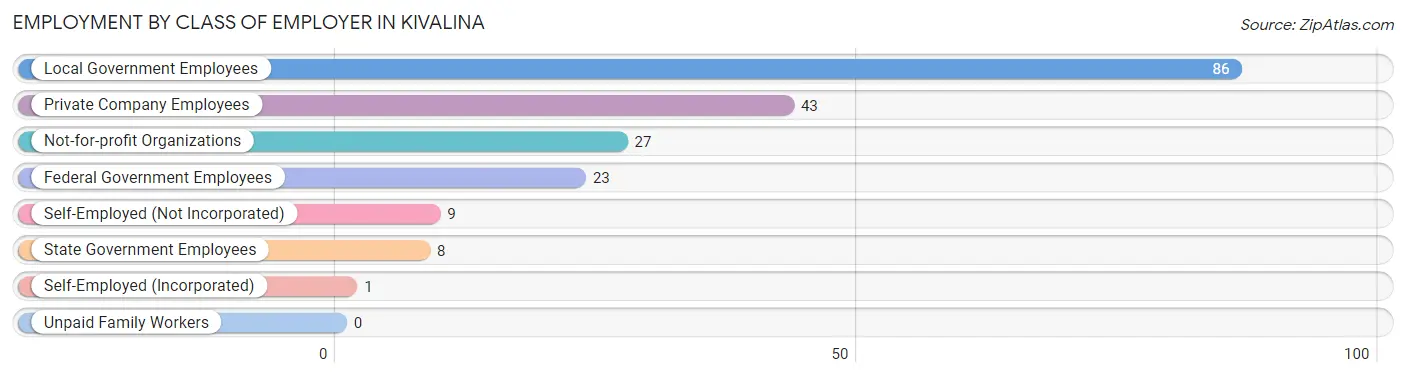
| Employer Class | # Employees | % Employees |
| Private Company Employees | 43 | 21.8% |
| Self-Employed (Incorporated) | 1 | 0.5% |
| Self-Employed (Not Incorporated) | 9 | 4.6% |
| Not-for-profit Organizations | 27 | 13.7% |
| Local Government Employees | 86 | 43.6% |
| State Government Employees | 8 | 4.1% |
| Federal Government Employees | 23 | 11.7% |
| Unpaid Family Workers | 0 | 0.0% |
| Total | 197 | 100.0% |
Employment Status by Age in Kivalina
According to the labor force statistics for Kivalina, out of the total population over 16 years of age (461), 56.4% or 260 individuals are in the labor force, with 22.5% or 58 of them unemployed. The age group with the highest labor force participation rate is 45 to 54 years, with 70.8% or 46 individuals in the labor force. Within the labor force, the 30 to 34 years age range has the highest percentage of unemployed individuals, with 37.2% or 16 of them being unemployed.
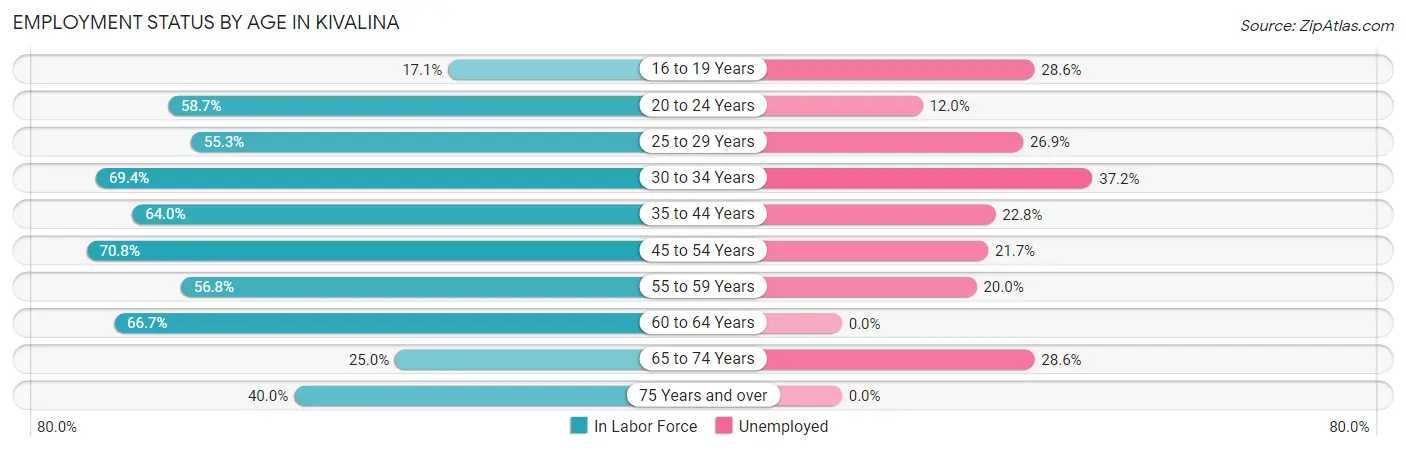
| Age Bracket | In Labor Force | Unemployed |
| 16 to 19 Years | 7 (17.1%) | 2 (28.6%) |
| 20 to 24 Years | 27 (58.7%) | 3 (12.0%) |
| 25 to 29 Years | 26 (55.3%) | 7 (26.9%) |
| 30 to 34 Years | 43 (69.4%) | 16 (37.2%) |
| 35 to 44 Years | 57 (64.0%) | 13 (22.8%) |
| 45 to 54 Years | 46 (70.8%) | 10 (21.7%) |
| 55 to 59 Years | 25 (56.8%) | 5 (20.0%) |
| 60 to 64 Years | 16 (66.7%) | 0 (0.0%) |
| 65 to 74 Years | 7 (25.0%) | 2 (28.6%) |
| 75 Years and over | 6 (40.0%) | 0 (0.0%) |
| Total | 260 (56.4%) | 58 (22.5%) |
Employment Status by Educational Attainment in Kivalina
According to labor force statistics for Kivalina, 64.4% of individuals (213) out of the total population between 25 and 64 years of age (331) are in the labor force, with 23.9% or 51 of them being unemployed. The group with the highest labor force participation rate are those with the educational attainment of bachelor's degree or higher, with 100.0% or 9 individuals in the labor force. Within the labor force, individuals with less than high school education have the highest percentage of unemployment, with 58.3% or 14 of them being unemployed.
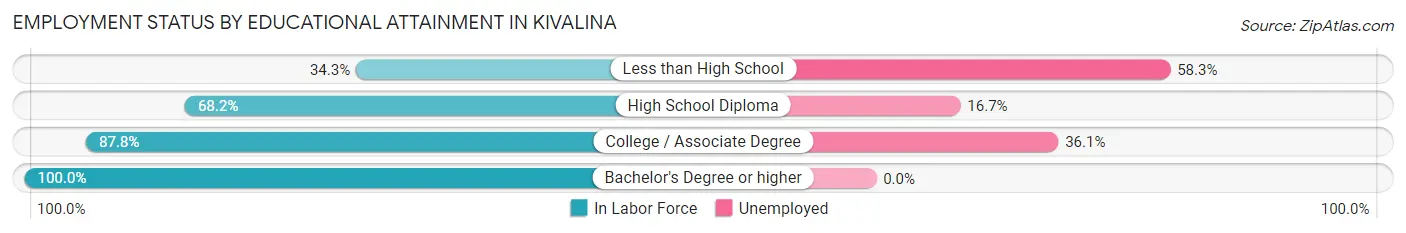
| Educational Attainment | In Labor Force | Unemployed |
| Less than High School | 24 (34.3%) | 41 (58.3%) |
| High School Diploma | 144 (68.2%) | 35 (16.7%) |
| College / Associate Degree | 36 (87.8%) | 15 (36.1%) |
| Bachelor's Degree or higher | 9 (100.0%) | 0 (0.0%) |
| Total | 213 (64.4%) | 79 (23.9%) |
Employment Occupations by Sex in Kivalina
Management, Business, Science and Arts Occupations
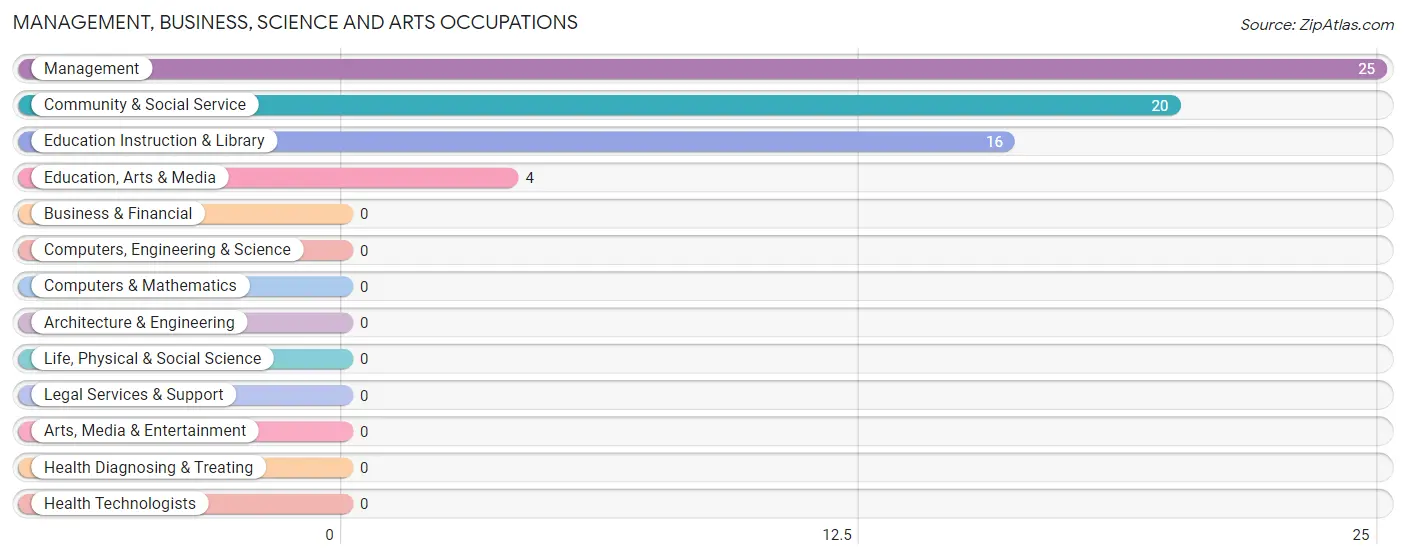
The most common Management, Business, Science and Arts occupations in Kivalina are Management (25 | 12.5%), Community & Social Service (20 | 10.0%), Education Instruction & Library (16 | 8.0%), and Education, Arts & Media (4 | 2.0%).
Management, Business, Science and Arts Occupations by Sex
Within the Management, Business, Science and Arts occupations in Kivalina, the most male-oriented occupations are Education Instruction & Library (62.5%), Community & Social Service (60.0%), and Education, Arts & Media (50.0%), while the most female-oriented occupations are Management (68.0%), Education, Arts & Media (50.0%), and Community & Social Service (40.0%).
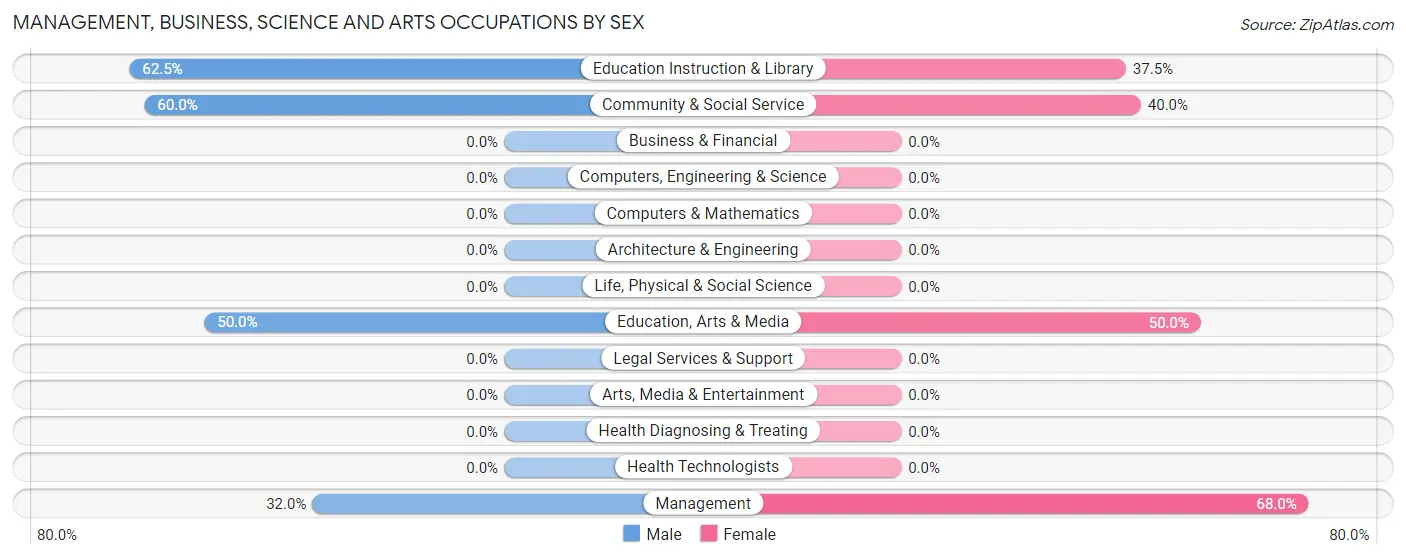
| Occupation | Male | Female |
| Management | 8 (32.0%) | 17 (68.0%) |
| Business & Financial | 0 (0.0%) | 0 (0.0%) |
| Computers, Engineering & Science | 0 (0.0%) | 0 (0.0%) |
| Computers & Mathematics | 0 (0.0%) | 0 (0.0%) |
| Architecture & Engineering | 0 (0.0%) | 0 (0.0%) |
| Life, Physical & Social Science | 0 (0.0%) | 0 (0.0%) |
| Community & Social Service | 12 (60.0%) | 8 (40.0%) |
| Education, Arts & Media | 2 (50.0%) | 2 (50.0%) |
| Legal Services & Support | 0 (0.0%) | 0 (0.0%) |
| Education Instruction & Library | 10 (62.5%) | 6 (37.5%) |
| Arts, Media & Entertainment | 0 (0.0%) | 0 (0.0%) |
| Health Diagnosing & Treating | 0 (0.0%) | 0 (0.0%) |
| Health Technologists | 0 (0.0%) | 0 (0.0%) |
| Total (Category) | 20 (44.4%) | 25 (55.6%) |
| Total (Overall) | 133 (66.5%) | 67 (33.5%) |
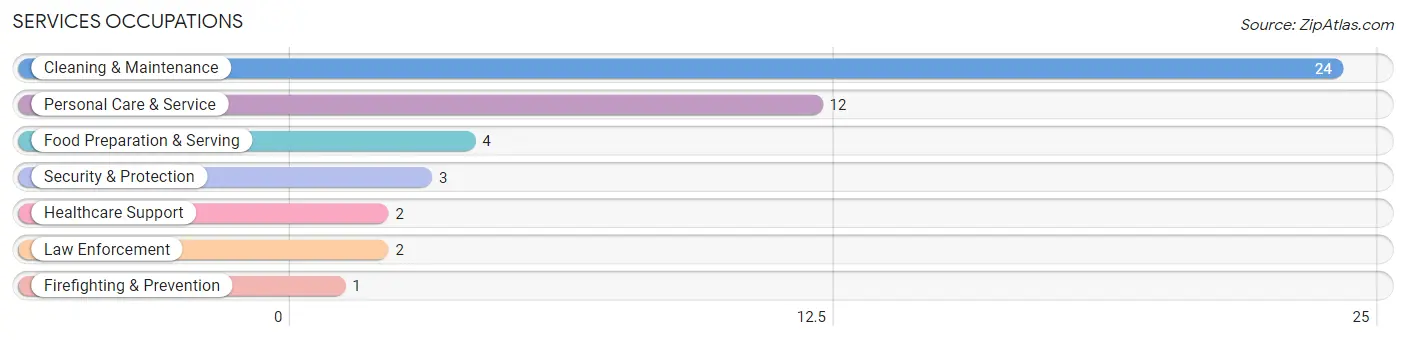
Services Occupations
The most common Services occupations in Kivalina are Cleaning & Maintenance (24 | 12.0%), Personal Care & Service (12 | 6.0%), Food Preparation & Serving (4 | 2.0%), Security & Protection (3 | 1.5%), and Healthcare Support (2 | 1.0%).
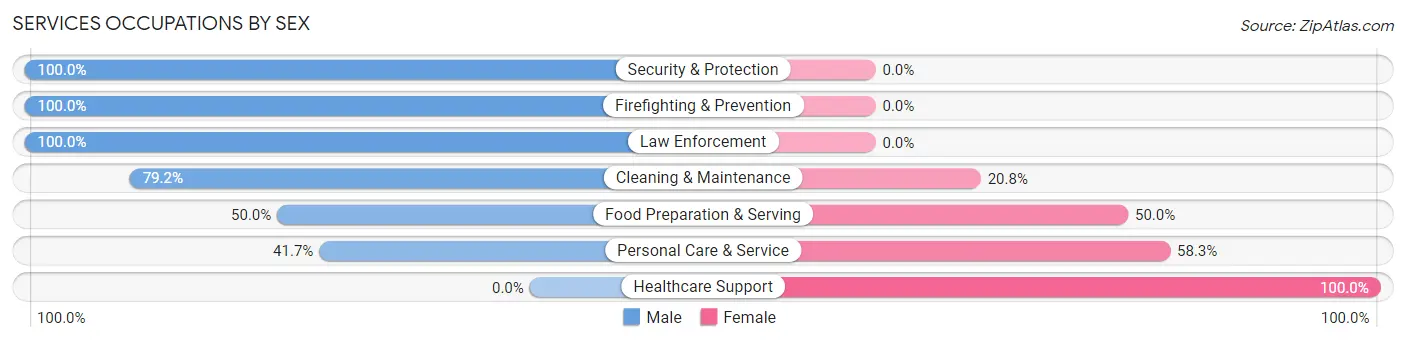
Services Occupations by Sex
Within the Services occupations in Kivalina, the most male-oriented occupations are Security & Protection (100.0%), Firefighting & Prevention (100.0%), and Law Enforcement (100.0%), while the most female-oriented occupations are Healthcare Support (100.0%), Personal Care & Service (58.3%), and Food Preparation & Serving (50.0%).
| Occupation | Male | Female |
| Healthcare Support | 0 (0.0%) | 2 (100.0%) |
| Security & Protection | 3 (100.0%) | 0 (0.0%) |
| Firefighting & Prevention | 1 (100.0%) | 0 (0.0%) |
| Law Enforcement | 2 (100.0%) | 0 (0.0%) |
| Food Preparation & Serving | 2 (50.0%) | 2 (50.0%) |
| Cleaning & Maintenance | 19 (79.2%) | 5 (20.8%) |
| Personal Care & Service | 5 (41.7%) | 7 (58.3%) |
| Total (Category) | 29 (64.4%) | 16 (35.6%) |
| Total (Overall) | 133 (66.5%) | 67 (33.5%) |
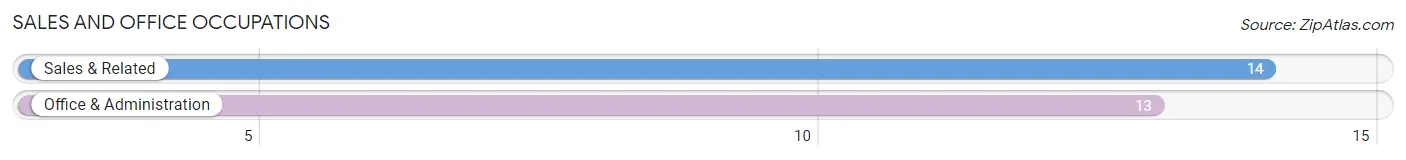
Sales and Office Occupations
The most common Sales and Office occupations in Kivalina are Sales & Related (14 | 7.0%), and Office & Administration (13 | 6.5%).
Sales and Office Occupations by Sex
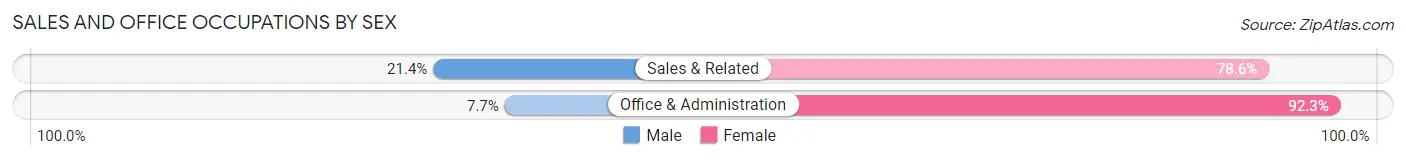
| Occupation | Male | Female |
| Sales & Related | 3 (21.4%) | 11 (78.6%) |
| Office & Administration | 1 (7.7%) | 12 (92.3%) |
| Total (Category) | 4 (14.8%) | 23 (85.2%) |
| Total (Overall) | 133 (66.5%) | 67 (33.5%) |
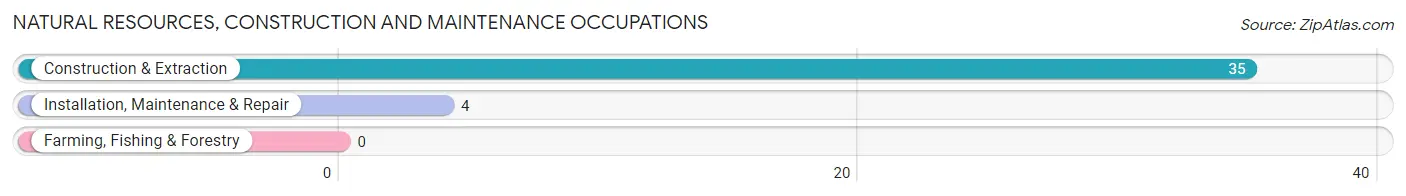
Natural Resources, Construction and Maintenance Occupations
The most common Natural Resources, Construction and Maintenance occupations in Kivalina are Construction & Extraction (35 | 17.5%), and Installation, Maintenance & Repair (4 | 2.0%).
Natural Resources, Construction and Maintenance Occupations by Sex
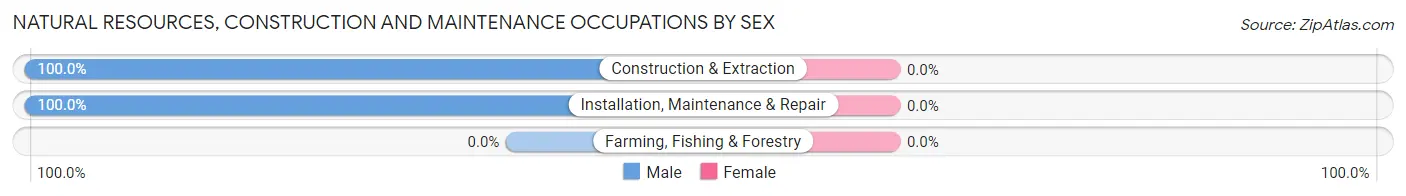
| Occupation | Male | Female |
| Farming, Fishing & Forestry | 0 (0.0%) | 0 (0.0%) |
| Construction & Extraction | 35 (100.0%) | 0 (0.0%) |
| Installation, Maintenance & Repair | 4 (100.0%) | 0 (0.0%) |
| Total (Category) | 39 (100.0%) | 0 (0.0%) |
| Total (Overall) | 133 (66.5%) | 67 (33.5%) |
Production, Transportation and Moving Occupations
The most common Production, Transportation and Moving occupations in Kivalina are Production (17 | 8.5%), Material Moving (15 | 7.5%), and Transportation (12 | 6.0%).
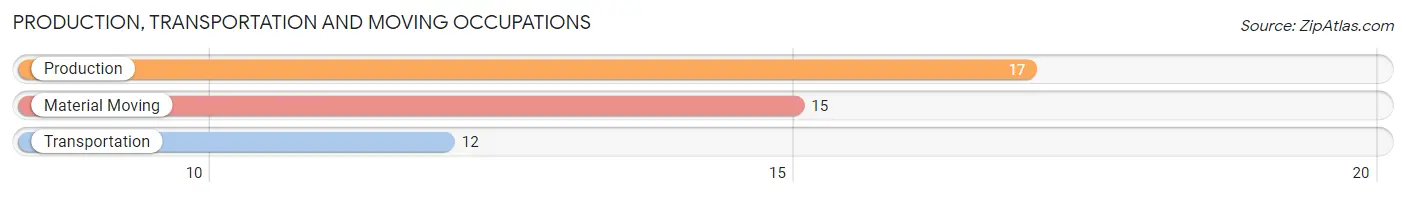
Production, Transportation and Moving Occupations by Sex
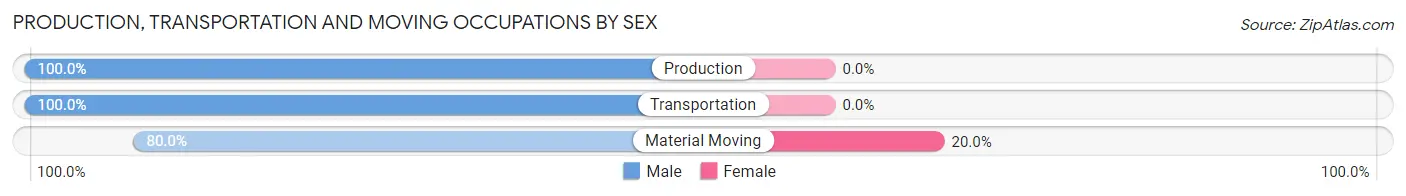
| Occupation | Male | Female |
| Production | 17 (100.0%) | 0 (0.0%) |
| Transportation | 12 (100.0%) | 0 (0.0%) |
| Material Moving | 12 (80.0%) | 3 (20.0%) |
| Total (Category) | 41 (93.2%) | 3 (6.8%) |
| Total (Overall) | 133 (66.5%) | 67 (33.5%) |
Employment Industries by Sex in Kivalina
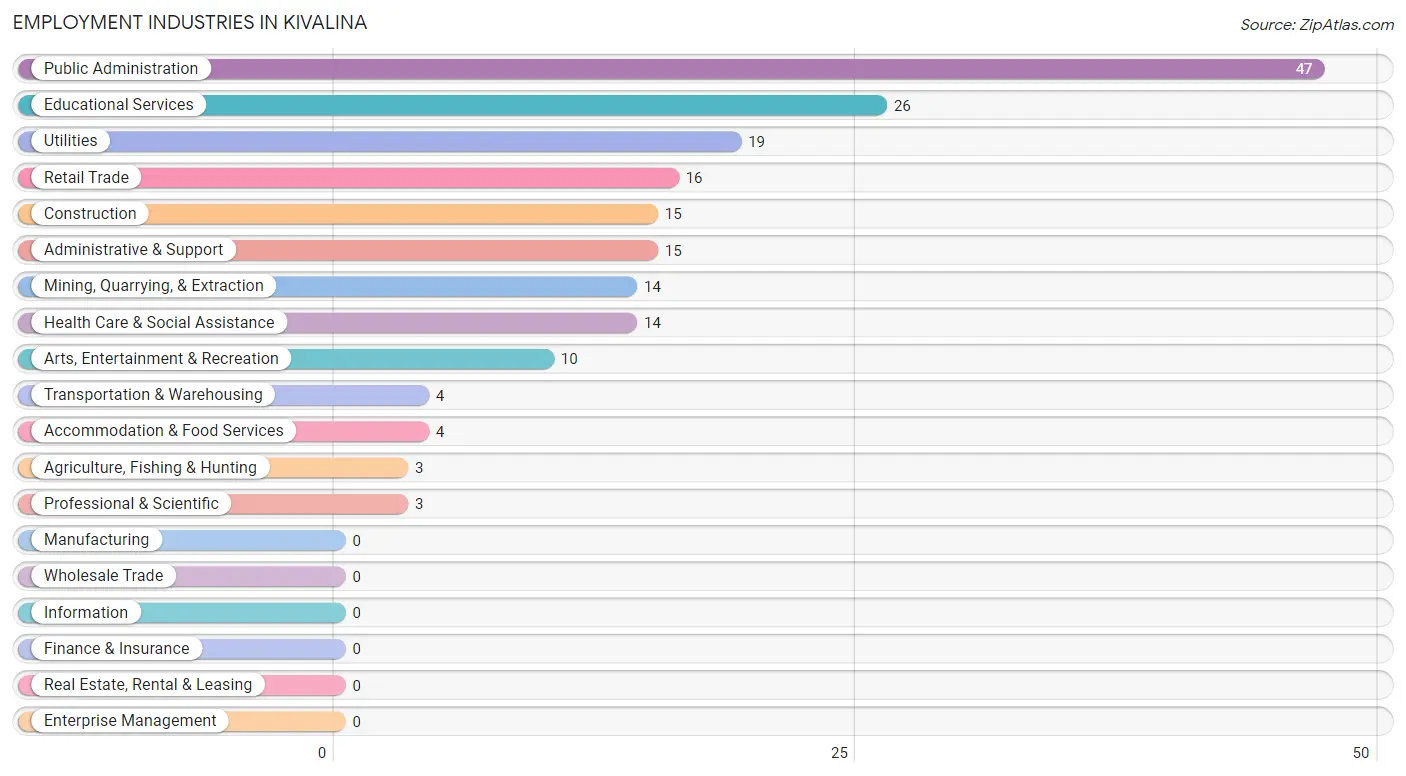
Employment Industries in Kivalina
The major employment industries in Kivalina include Public Administration (47 | 23.5%), Educational Services (26 | 13.0%), Utilities (19 | 9.5%), Retail Trade (16 | 8.0%), and Construction (15 | 7.5%).
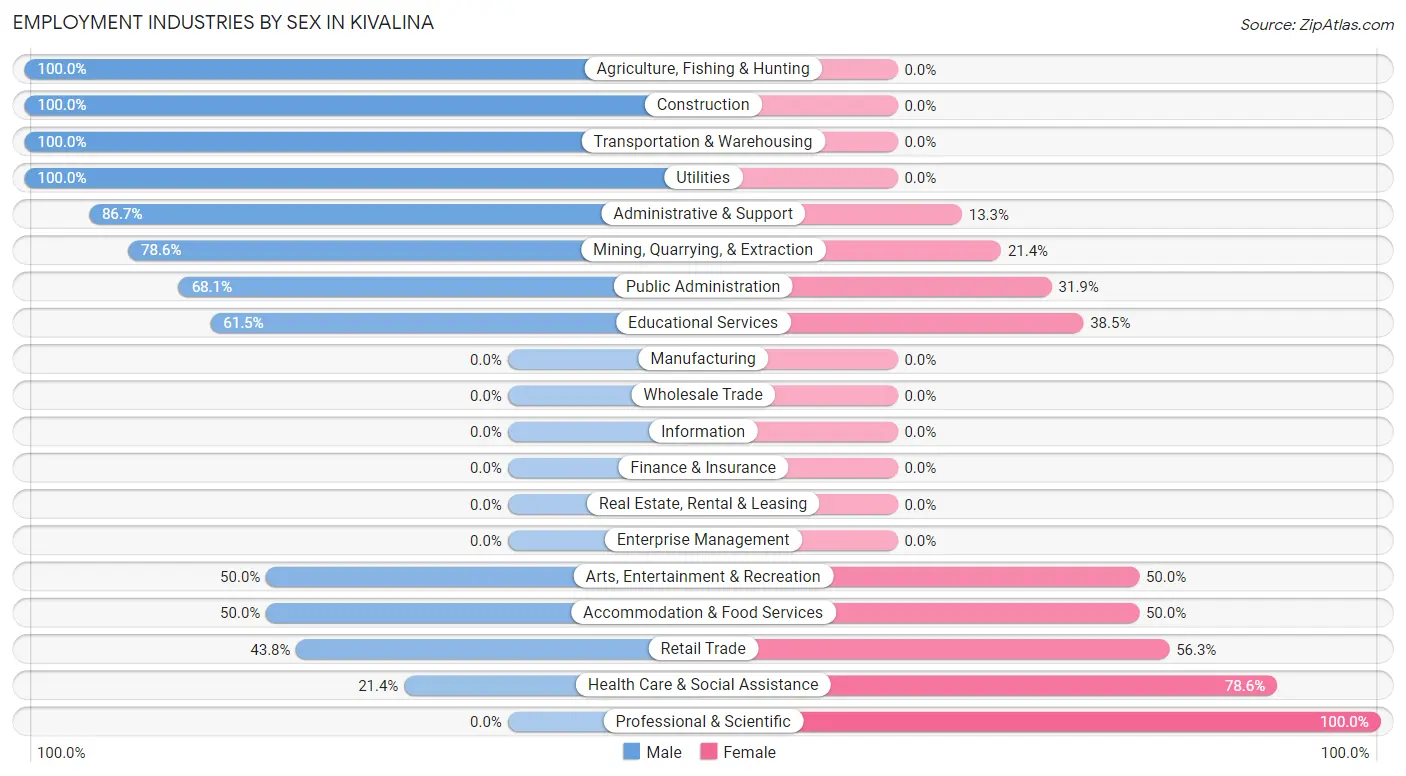
Employment Industries by Sex in Kivalina
The Kivalina industries that see more men than women are Agriculture, Fishing & Hunting (100.0%), Construction (100.0%), and Transportation & Warehousing (100.0%), whereas the industries that tend to have a higher number of women are Professional & Scientific (100.0%), Health Care & Social Assistance (78.6%), and Retail Trade (56.2%).
| Industry | Male | Female |
| Agriculture, Fishing & Hunting | 3 (100.0%) | 0 (0.0%) |
| Mining, Quarrying, & Extraction | 11 (78.6%) | 3 (21.4%) |
| Construction | 15 (100.0%) | 0 (0.0%) |
| Manufacturing | 0 (0.0%) | 0 (0.0%) |
| Wholesale Trade | 0 (0.0%) | 0 (0.0%) |
| Retail Trade | 7 (43.8%) | 9 (56.2%) |
| Transportation & Warehousing | 4 (100.0%) | 0 (0.0%) |
| Utilities | 19 (100.0%) | 0 (0.0%) |
| Information | 0 (0.0%) | 0 (0.0%) |
| Finance & Insurance | 0 (0.0%) | 0 (0.0%) |
| Real Estate, Rental & Leasing | 0 (0.0%) | 0 (0.0%) |
| Professional & Scientific | 0 (0.0%) | 3 (100.0%) |
| Enterprise Management | 0 (0.0%) | 0 (0.0%) |
| Administrative & Support | 13 (86.7%) | 2 (13.3%) |
| Educational Services | 16 (61.5%) | 10 (38.5%) |
| Health Care & Social Assistance | 3 (21.4%) | 11 (78.6%) |
| Arts, Entertainment & Recreation | 5 (50.0%) | 5 (50.0%) |
| Accommodation & Food Services | 2 (50.0%) | 2 (50.0%) |
| Public Administration | 32 (68.1%) | 15 (31.9%) |
| Total | 133 (66.5%) | 67 (33.5%) |
Education in Kivalina
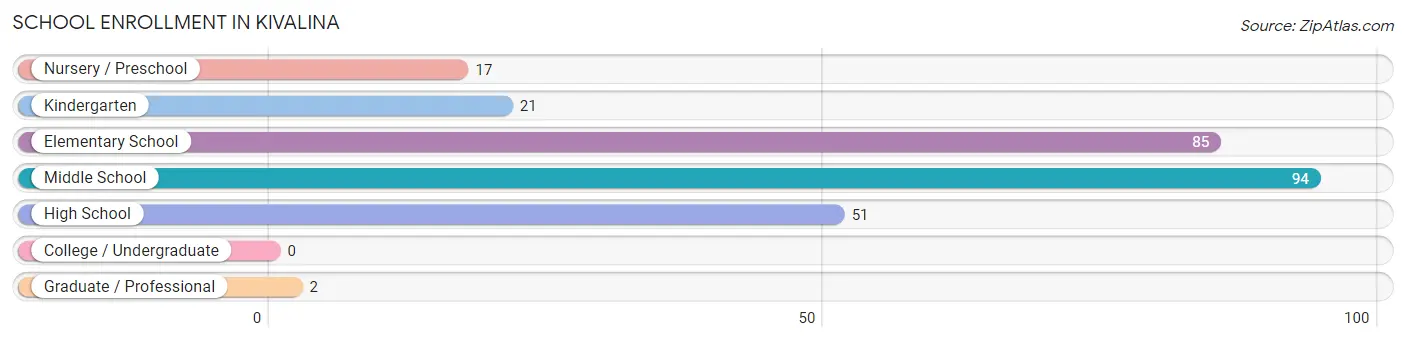
School Enrollment in Kivalina
The most common levels of schooling among the 270 students in Kivalina are middle school (94 | 34.8%), elementary school (85 | 31.5%), and high school (51 | 18.9%).
| School Level | # Students | % Students |
| Nursery / Preschool | 17 | 6.3% |
| Kindergarten | 21 | 7.8% |
| Elementary School | 85 | 31.5% |
| Middle School | 94 | 34.8% |
| High School | 51 | 18.9% |
| College / Undergraduate | 0 | 0.0% |
| Graduate / Professional | 2 | 0.7% |
| Total | 270 | 100.0% |
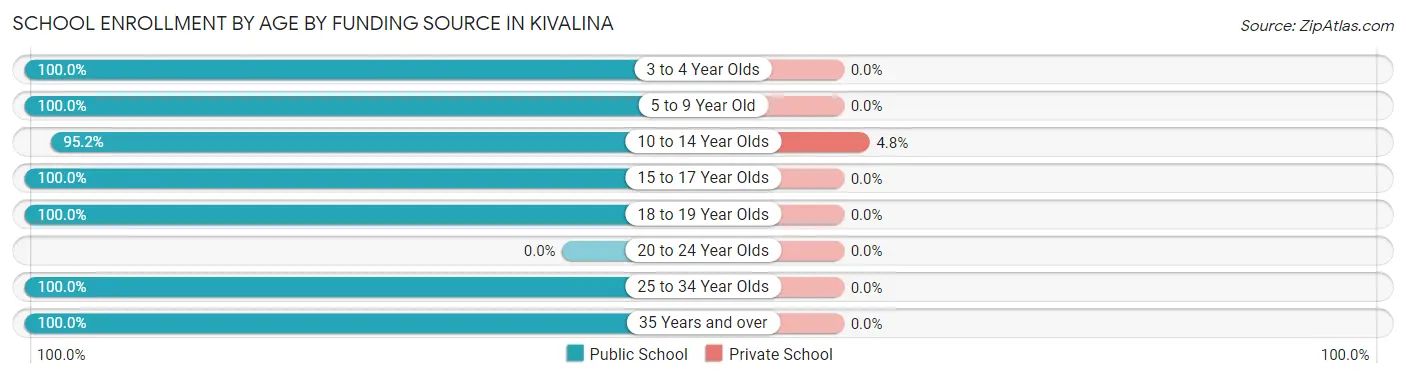
School Enrollment by Age by Funding Source in Kivalina
Out of a total of 270 students who are enrolled in schools in Kivalina, 5 (1.9%) attend a private institution, while the remaining 265 (98.1%) are enrolled in public schools. The age group of 10 to 14 year olds has the highest likelihood of being enrolled in private schools, with 5 (4.8% in the age bracket) enrolled. Conversely, the age group of 3 to 4 year olds has the lowest likelihood of being enrolled in a private school, with 20 (100.0% in the age bracket) attending a public institution.
| Age Bracket | Public School | Private School |
| 3 to 4 Year Olds | 20 (100.0%) | 0 (0.0%) |
| 5 to 9 Year Old | 97 (100.0%) | 0 (0.0%) |
| 10 to 14 Year Olds | 99 (95.2%) | 5 (4.8%) |
| 15 to 17 Year Olds | 43 (100.0%) | 0 (0.0%) |
| 18 to 19 Year Olds | 4 (100.0%) | 0 (0.0%) |
| 20 to 24 Year Olds | 0 (0.0%) | 0 (0.0%) |
| 25 to 34 Year Olds | 1 (100.0%) | 0 (0.0%) |
| 35 Years and over | 1 (100.0%) | 0 (0.0%) |
| Total | 265 (98.1%) | 5 (1.9%) |
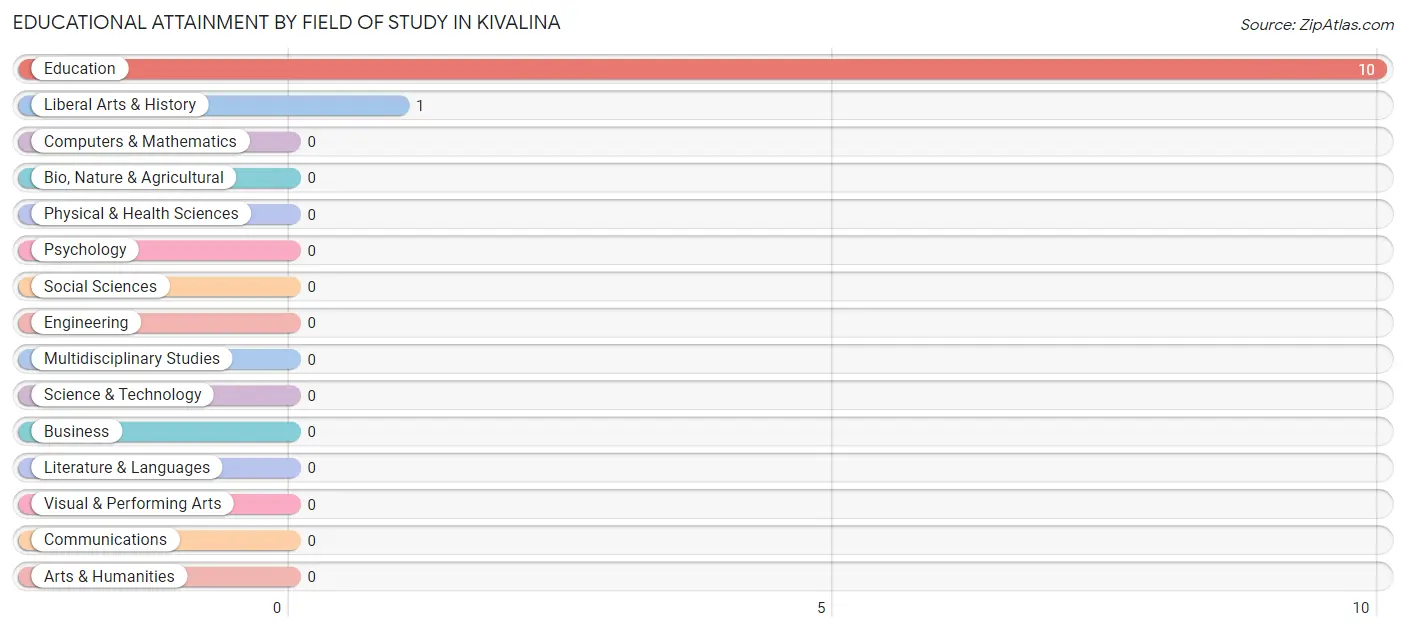
Educational Attainment by Field of Study in Kivalina
Education (10 | 90.9%), and liberal arts & history (1 | 9.1%) are the most common fields of study among 11 individuals in Kivalina who have obtained a bachelor's degree or higher.
| Field of Study | # Graduates | % Graduates |
| Computers & Mathematics | 0 | 0.0% |
| Bio, Nature & Agricultural | 0 | 0.0% |
| Physical & Health Sciences | 0 | 0.0% |
| Psychology | 0 | 0.0% |
| Social Sciences | 0 | 0.0% |
| Engineering | 0 | 0.0% |
| Multidisciplinary Studies | 0 | 0.0% |
| Science & Technology | 0 | 0.0% |
| Business | 0 | 0.0% |
| Education | 10 | 90.9% |
| Literature & Languages | 0 | 0.0% |
| Liberal Arts & History | 1 | 9.1% |
| Visual & Performing Arts | 0 | 0.0% |
| Communications | 0 | 0.0% |
| Arts & Humanities | 0 | 0.0% |
| Total | 11 | 100.0% |
Transportation & Commute in Kivalina
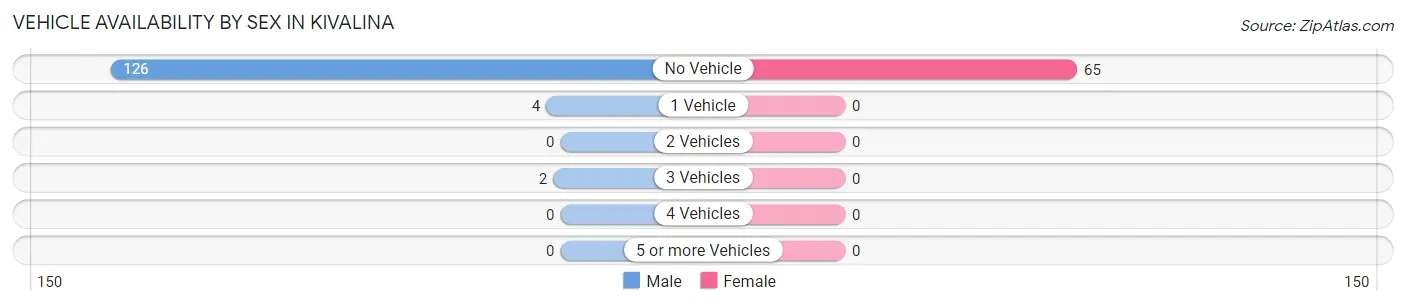
Vehicle Availability by Sex in Kivalina
The most prevalent vehicle ownership categories in Kivalina are males with no vehicle (126, accounting for 95.5%) and females with no vehicle (65, making up 193.8%).
| Vehicles Available | Male | Female |
| No Vehicle | 126 (95.5%) | 65 (100.0%) |
| 1 Vehicle | 4 (3.0%) | 0 (0.0%) |
| 2 Vehicles | 0 (0.0%) | 0 (0.0%) |
| 3 Vehicles | 2 (1.5%) | 0 (0.0%) |
| 4 Vehicles | 0 (0.0%) | 0 (0.0%) |
| 5 or more Vehicles | 0 (0.0%) | 0 (0.0%) |
| Total | 132 (100.0%) | 65 (100.0%) |
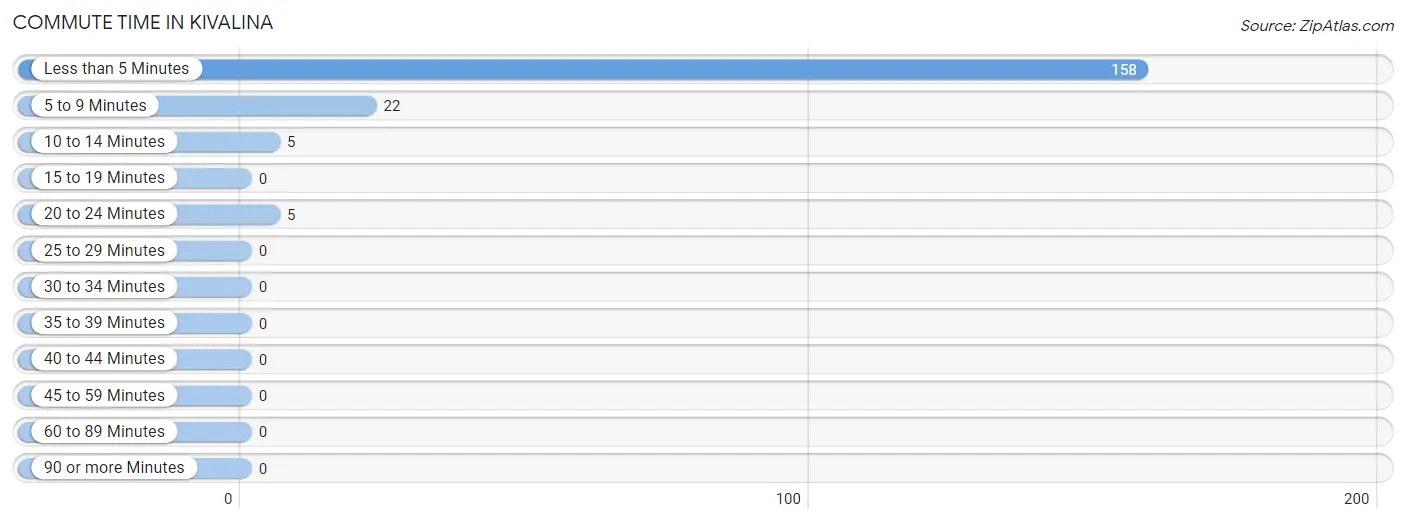
Commute Time in Kivalina
The most frequently occuring commute durations in Kivalina are less than 5 minutes (158 commuters, 83.2%), 5 to 9 minutes (22 commuters, 11.6%), and 10 to 14 minutes (5 commuters, 2.6%).
| Commute Time | # Commuters | % Commuters |
| Less than 5 Minutes | 158 | 83.2% |
| 5 to 9 Minutes | 22 | 11.6% |
| 10 to 14 Minutes | 5 | 2.6% |
| 15 to 19 Minutes | 0 | 0.0% |
| 20 to 24 Minutes | 5 | 2.6% |
| 25 to 29 Minutes | 0 | 0.0% |
| 30 to 34 Minutes | 0 | 0.0% |
| 35 to 39 Minutes | 0 | 0.0% |
| 40 to 44 Minutes | 0 | 0.0% |
| 45 to 59 Minutes | 0 | 0.0% |
| 60 to 89 Minutes | 0 | 0.0% |
| 90 or more Minutes | 0 | 0.0% |
Commute Time by Sex in Kivalina
The most common commute times in Kivalina are less than 5 minutes (104 commuters, 80.6%) for males and less than 5 minutes (54 commuters, 88.5%) for females.
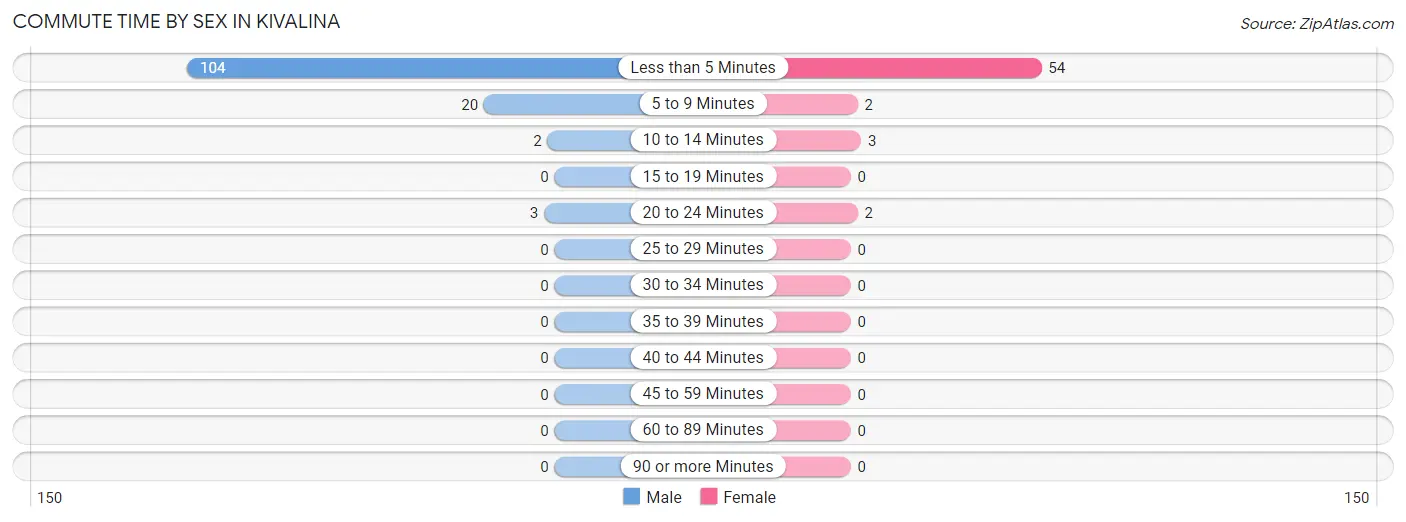
| Commute Time | Male | Female |
| Less than 5 Minutes | 104 (80.6%) | 54 (88.5%) |
| 5 to 9 Minutes | 20 (15.5%) | 2 (3.3%) |
| 10 to 14 Minutes | 2 (1.5%) | 3 (4.9%) |
| 15 to 19 Minutes | 0 (0.0%) | 0 (0.0%) |
| 20 to 24 Minutes | 3 (2.3%) | 2 (3.3%) |
| 25 to 29 Minutes | 0 (0.0%) | 0 (0.0%) |
| 30 to 34 Minutes | 0 (0.0%) | 0 (0.0%) |
| 35 to 39 Minutes | 0 (0.0%) | 0 (0.0%) |
| 40 to 44 Minutes | 0 (0.0%) | 0 (0.0%) |
| 45 to 59 Minutes | 0 (0.0%) | 0 (0.0%) |
| 60 to 89 Minutes | 0 (0.0%) | 0 (0.0%) |
| 90 or more Minutes | 0 (0.0%) | 0 (0.0%) |
Time of Departure to Work by Sex in Kivalina
The most frequent times of departure to work in Kivalina are 8:30 AM to 8:59 AM (36, 27.9%) for males and 9:00 AM to 9:59 AM (17, 27.9%) for females.
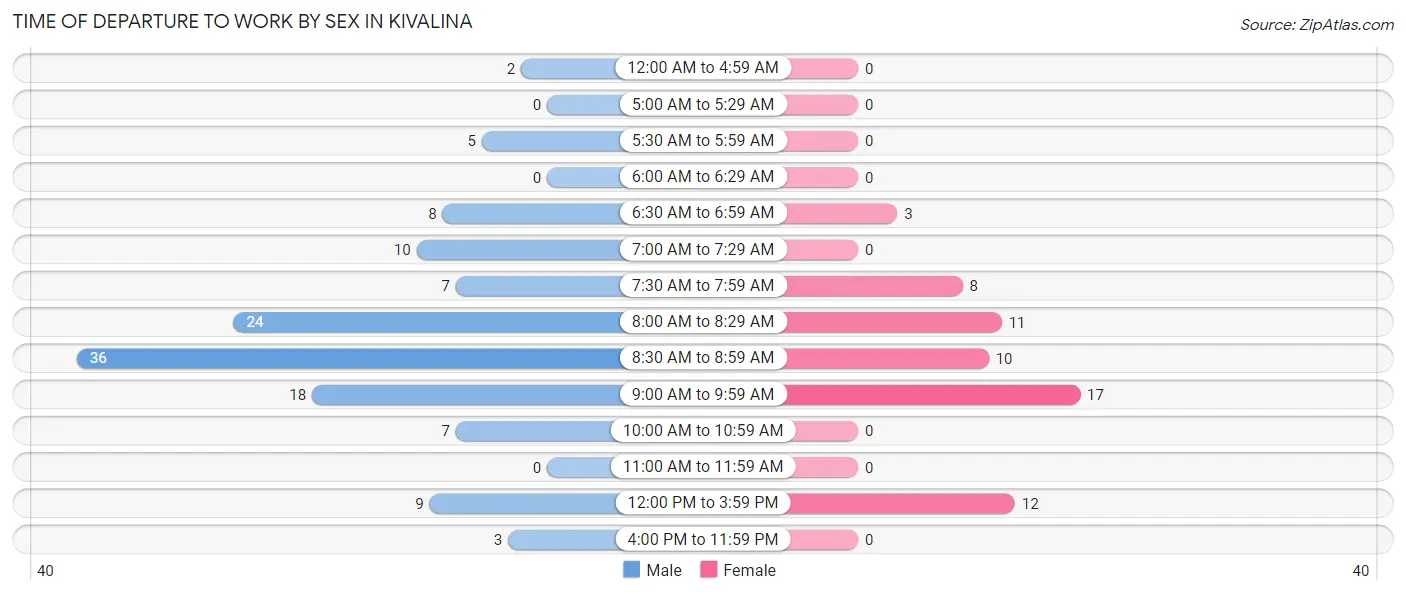
| Time of Departure | Male | Female |
| 12:00 AM to 4:59 AM | 2 (1.5%) | 0 (0.0%) |
| 5:00 AM to 5:29 AM | 0 (0.0%) | 0 (0.0%) |
| 5:30 AM to 5:59 AM | 5 (3.9%) | 0 (0.0%) |
| 6:00 AM to 6:29 AM | 0 (0.0%) | 0 (0.0%) |
| 6:30 AM to 6:59 AM | 8 (6.2%) | 3 (4.9%) |
| 7:00 AM to 7:29 AM | 10 (7.7%) | 0 (0.0%) |
| 7:30 AM to 7:59 AM | 7 (5.4%) | 8 (13.1%) |
| 8:00 AM to 8:29 AM | 24 (18.6%) | 11 (18.0%) |
| 8:30 AM to 8:59 AM | 36 (27.9%) | 10 (16.4%) |
| 9:00 AM to 9:59 AM | 18 (14.0%) | 17 (27.9%) |
| 10:00 AM to 10:59 AM | 7 (5.4%) | 0 (0.0%) |
| 11:00 AM to 11:59 AM | 0 (0.0%) | 0 (0.0%) |
| 12:00 PM to 3:59 PM | 9 (7.0%) | 12 (19.7%) |
| 4:00 PM to 11:59 PM | 3 (2.3%) | 0 (0.0%) |
| Total | 129 (100.0%) | 61 (100.0%) |
Housing Occupancy in Kivalina
Occupancy by Ownership in Kivalina
Of the total 144 dwellings in Kivalina, owner-occupied units account for 115 (79.9%), while renter-occupied units make up 29 (20.1%).
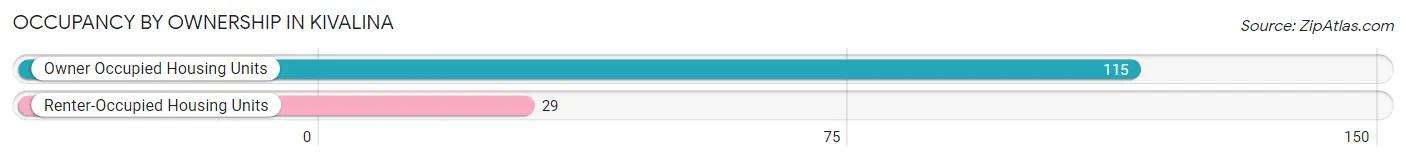
| Occupancy | # Housing Units | % Housing Units |
| Owner Occupied Housing Units | 115 | 79.9% |
| Renter-Occupied Housing Units | 29 | 20.1% |
| Total Occupied Housing Units | 144 | 100.0% |
Occupancy by Household Size in Kivalina
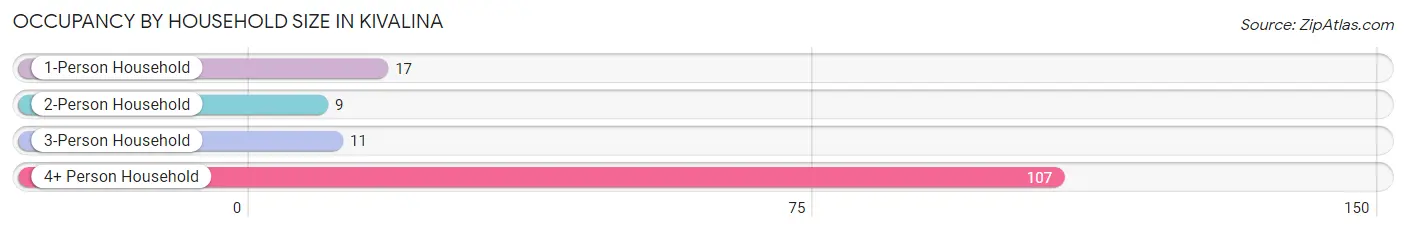
| Household Size | # Housing Units | % Housing Units |
| 1-Person Household | 17 | 11.8% |
| 2-Person Household | 9 | 6.2% |
| 3-Person Household | 11 | 7.6% |
| 4+ Person Household | 107 | 74.3% |
| Total Housing Units | 144 | 100.0% |
Occupancy by Ownership by Household Size in Kivalina
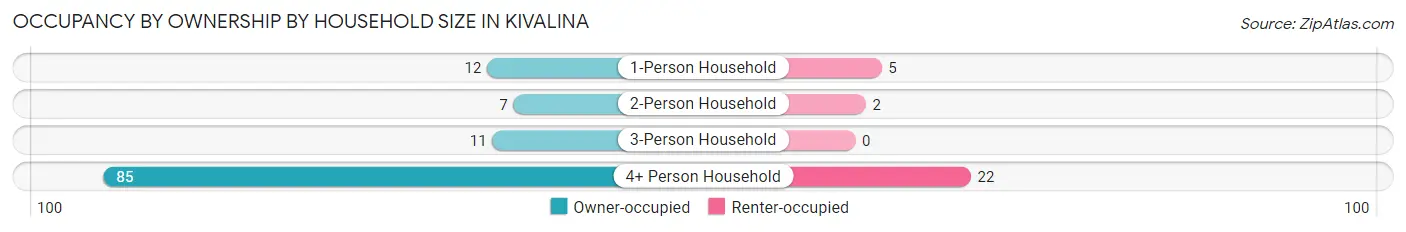
| Household Size | Owner-occupied | Renter-occupied |
| 1-Person Household | 12 (70.6%) | 5 (29.4%) |
| 2-Person Household | 7 (77.8%) | 2 (22.2%) |
| 3-Person Household | 11 (100.0%) | 0 (0.0%) |
| 4+ Person Household | 85 (79.4%) | 22 (20.6%) |
| Total Housing Units | 115 (79.9%) | 29 (20.1%) |
Occupancy by Educational Attainment in Kivalina
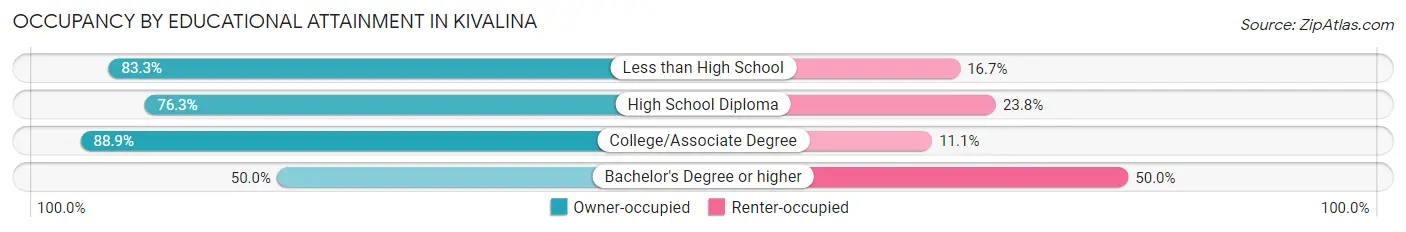
| Household Size | Owner-occupied | Renter-occupied |
| Less than High School | 20 (83.3%) | 4 (16.7%) |
| High School Diploma | 61 (76.2%) | 19 (23.7%) |
| College/Associate Degree | 32 (88.9%) | 4 (11.1%) |
| Bachelor's Degree or higher | 2 (50.0%) | 2 (50.0%) |
Occupancy by Age of Householder in Kivalina
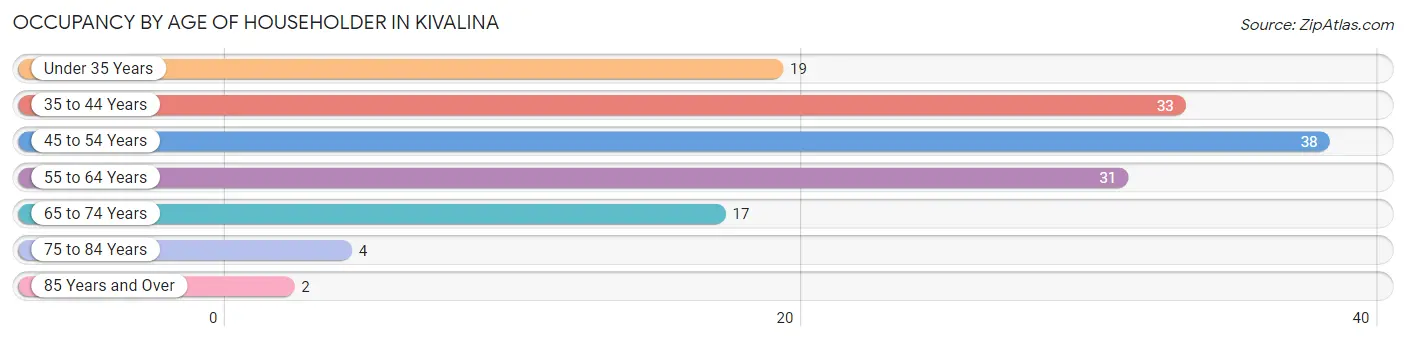
| Age Bracket | # Households | % Households |
| Under 35 Years | 19 | 13.2% |
| 35 to 44 Years | 33 | 22.9% |
| 45 to 54 Years | 38 | 26.4% |
| 55 to 64 Years | 31 | 21.5% |
| 65 to 74 Years | 17 | 11.8% |
| 75 to 84 Years | 4 | 2.8% |
| 85 Years and Over | 2 | 1.4% |
| Total | 144 | 100.0% |
Housing Finances in Kivalina
Median Income by Occupancy in Kivalina
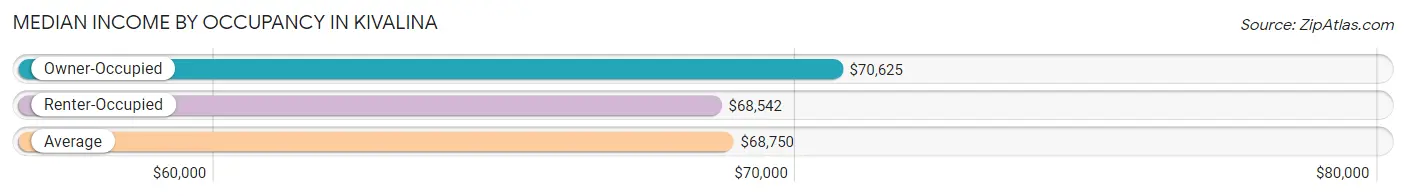
| Occupancy Type | # Households | Median Income |
| Owner-Occupied | 115 (79.9%) | $70,625 |
| Renter-Occupied | 29 (20.1%) | $68,542 |
| Average | 144 (100.0%) | $68,750 |
Occupancy by Householder Income Bracket in Kivalina
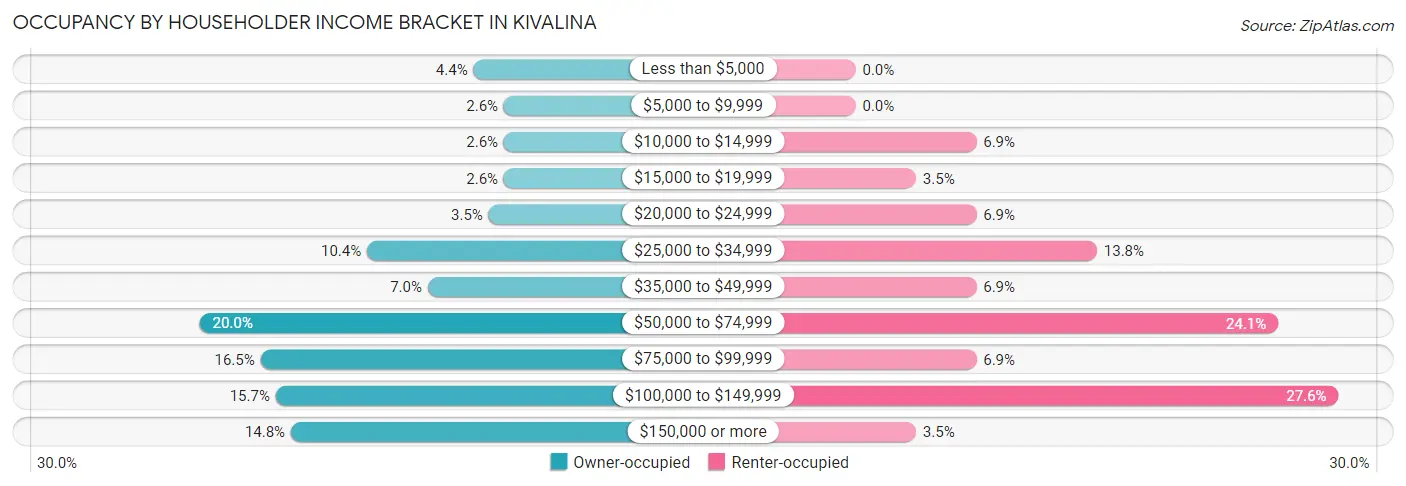
| Income Bracket | Owner-occupied | Renter-occupied |
| Less than $5,000 | 5 (4.3%) | 0 (0.0%) |
| $5,000 to $9,999 | 3 (2.6%) | 0 (0.0%) |
| $10,000 to $14,999 | 3 (2.6%) | 2 (6.9%) |
| $15,000 to $19,999 | 3 (2.6%) | 1 (3.5%) |
| $20,000 to $24,999 | 4 (3.5%) | 2 (6.9%) |
| $25,000 to $34,999 | 12 (10.4%) | 4 (13.8%) |
| $35,000 to $49,999 | 8 (7.0%) | 2 (6.9%) |
| $50,000 to $74,999 | 23 (20.0%) | 7 (24.1%) |
| $75,000 to $99,999 | 19 (16.5%) | 2 (6.9%) |
| $100,000 to $149,999 | 18 (15.7%) | 8 (27.6%) |
| $150,000 or more | 17 (14.8%) | 1 (3.5%) |
| Total | 115 (100.0%) | 29 (100.0%) |
Monthly Housing Cost Tiers in Kivalina
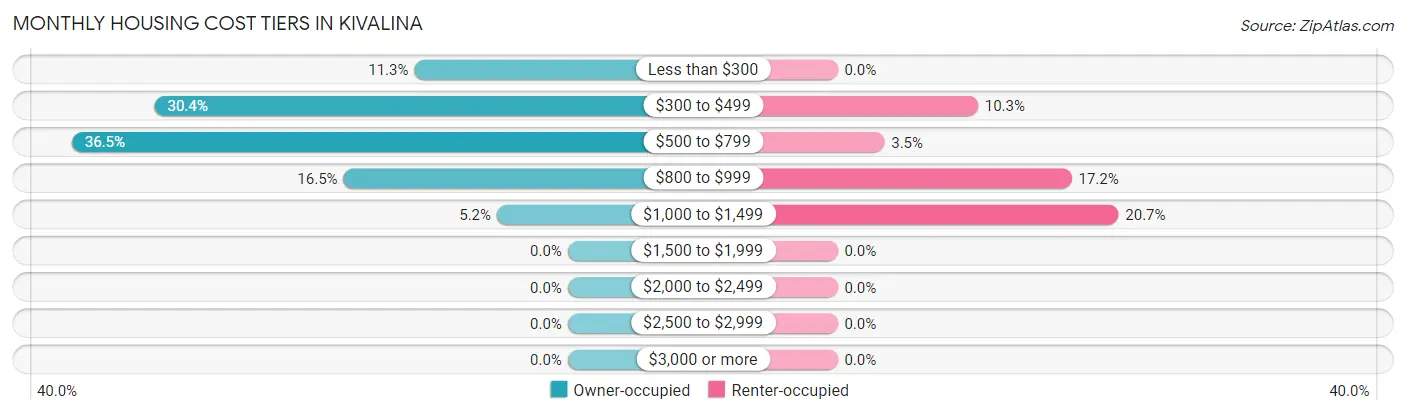
| Monthly Cost | Owner-occupied | Renter-occupied |
| Less than $300 | 13 (11.3%) | 0 (0.0%) |
| $300 to $499 | 35 (30.4%) | 3 (10.3%) |
| $500 to $799 | 42 (36.5%) | 1 (3.5%) |
| $800 to $999 | 19 (16.5%) | 5 (17.2%) |
| $1,000 to $1,499 | 6 (5.2%) | 6 (20.7%) |
| $1,500 to $1,999 | 0 (0.0%) | 0 (0.0%) |
| $2,000 to $2,499 | 0 (0.0%) | 0 (0.0%) |
| $2,500 to $2,999 | 0 (0.0%) | 0 (0.0%) |
| $3,000 or more | 0 (0.0%) | 0 (0.0%) |
| Total | 115 (100.0%) | 29 (100.0%) |
Physical Housing Characteristics in Kivalina
Housing Structures in Kivalina
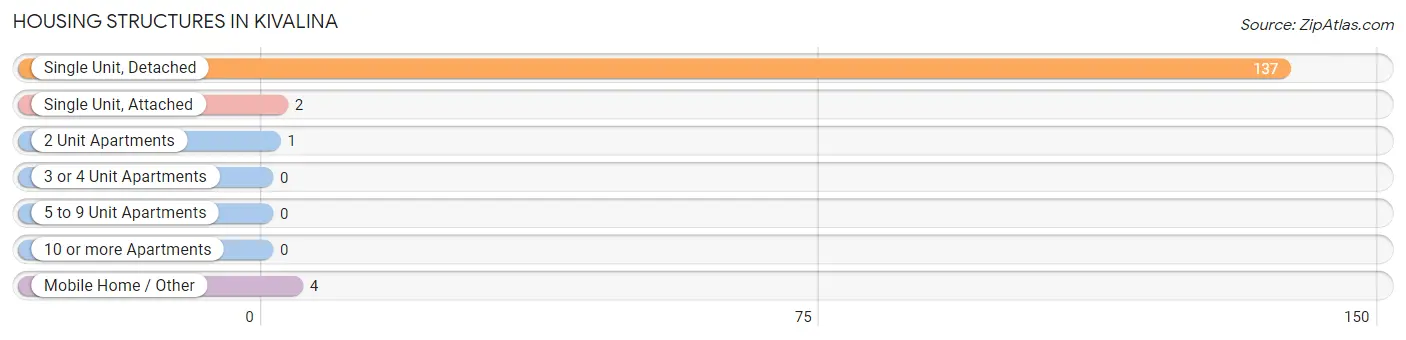
| Structure Type | # Housing Units | % Housing Units |
| Single Unit, Detached | 137 | 95.1% |
| Single Unit, Attached | 2 | 1.4% |
| 2 Unit Apartments | 1 | 0.7% |
| 3 or 4 Unit Apartments | 0 | 0.0% |
| 5 to 9 Unit Apartments | 0 | 0.0% |
| 10 or more Apartments | 0 | 0.0% |
| Mobile Home / Other | 4 | 2.8% |
| Total | 144 | 100.0% |
Housing Structures by Occupancy in Kivalina
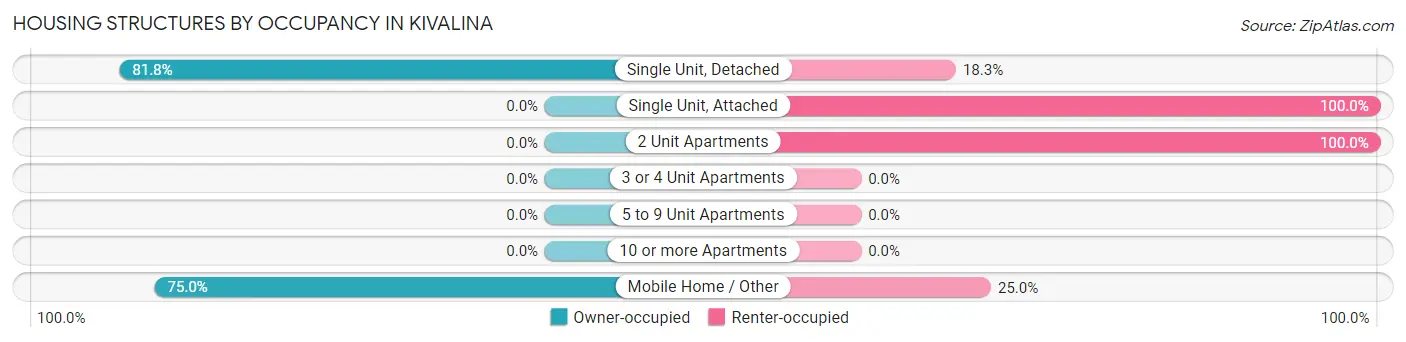
| Structure Type | Owner-occupied | Renter-occupied |
| Single Unit, Detached | 112 (81.8%) | 25 (18.2%) |
| Single Unit, Attached | 0 (0.0%) | 2 (100.0%) |
| 2 Unit Apartments | 0 (0.0%) | 1 (100.0%) |
| 3 or 4 Unit Apartments | 0 (0.0%) | 0 (0.0%) |
| 5 to 9 Unit Apartments | 0 (0.0%) | 0 (0.0%) |
| 10 or more Apartments | 0 (0.0%) | 0 (0.0%) |
| Mobile Home / Other | 3 (75.0%) | 1 (25.0%) |
| Total | 115 (79.9%) | 29 (20.1%) |
Housing Structures by Number of Rooms in Kivalina
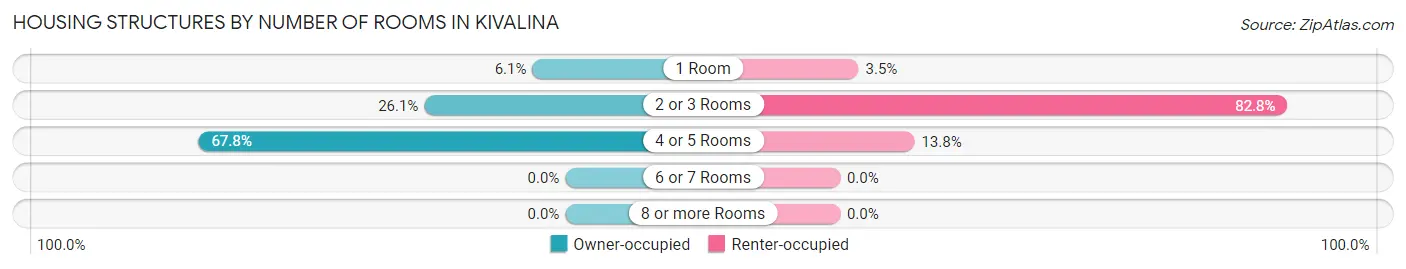
| Number of Rooms | Owner-occupied | Renter-occupied |
| 1 Room | 7 (6.1%) | 1 (3.5%) |
| 2 or 3 Rooms | 30 (26.1%) | 24 (82.8%) |
| 4 or 5 Rooms | 78 (67.8%) | 4 (13.8%) |
| 6 or 7 Rooms | 0 (0.0%) | 0 (0.0%) |
| 8 or more Rooms | 0 (0.0%) | 0 (0.0%) |
| Total | 115 (100.0%) | 29 (100.0%) |
Housing Structure by Heating Type in Kivalina
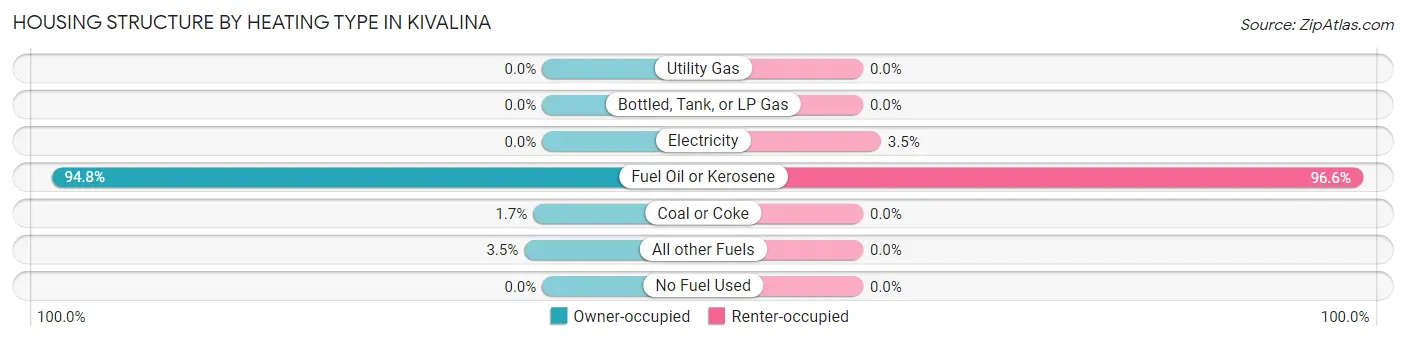
| Heating Type | Owner-occupied | Renter-occupied |
| Utility Gas | 0 (0.0%) | 0 (0.0%) |
| Bottled, Tank, or LP Gas | 0 (0.0%) | 0 (0.0%) |
| Electricity | 0 (0.0%) | 1 (3.5%) |
| Fuel Oil or Kerosene | 109 (94.8%) | 28 (96.6%) |
| Coal or Coke | 2 (1.7%) | 0 (0.0%) |
| All other Fuels | 4 (3.5%) | 0 (0.0%) |
| No Fuel Used | 0 (0.0%) | 0 (0.0%) |
| Total | 115 (100.0%) | 29 (100.0%) |
Household Vehicle Usage in Kivalina
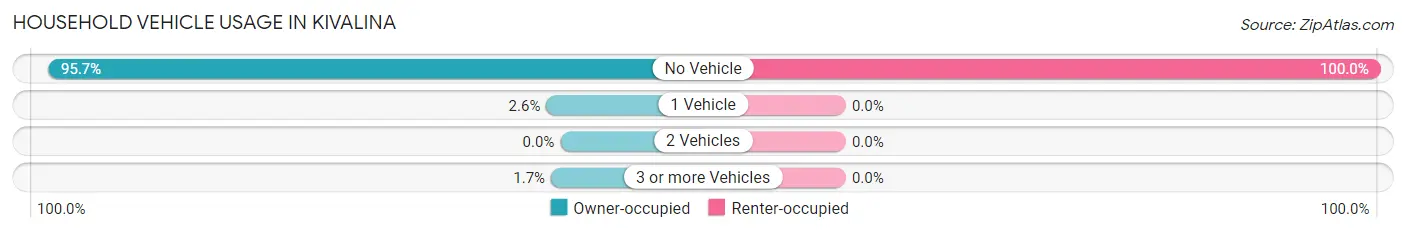
| Vehicles per Household | Owner-occupied | Renter-occupied |
| No Vehicle | 110 (95.7%) | 29 (100.0%) |
| 1 Vehicle | 3 (2.6%) | 0 (0.0%) |
| 2 Vehicles | 0 (0.0%) | 0 (0.0%) |
| 3 or more Vehicles | 2 (1.7%) | 0 (0.0%) |
| Total | 115 (100.0%) | 29 (100.0%) |
Real Estate & Mortgages in Kivalina
Real Estate and Mortgage Overview in Kivalina
| Characteristic | Without Mortgage | With Mortgage |
| Housing Units | 95 | 20 |
| Median Property Value | $107,500 | $200,000 |
| Median Household Income | $76,875 | $0 |
| Monthly Housing Costs | $523 | $0 |
| Real Estate Taxes | - | - |
Property Value by Mortgage Status in Kivalina
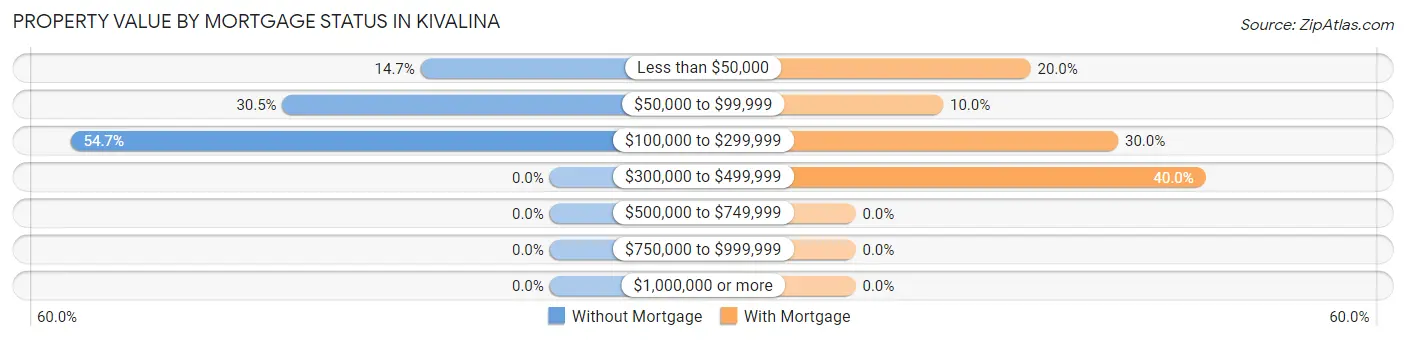
| Property Value | Without Mortgage | With Mortgage |
| Less than $50,000 | 14 (14.7%) | 4 (20.0%) |
| $50,000 to $99,999 | 29 (30.5%) | 2 (10.0%) |
| $100,000 to $299,999 | 52 (54.7%) | 6 (30.0%) |
| $300,000 to $499,999 | 0 (0.0%) | 8 (40.0%) |
| $500,000 to $749,999 | 0 (0.0%) | 0 (0.0%) |
| $750,000 to $999,999 | 0 (0.0%) | 0 (0.0%) |
| $1,000,000 or more | 0 (0.0%) | 0 (0.0%) |
| Total | 95 (100.0%) | 20 (100.0%) |
Household Income by Mortgage Status in Kivalina
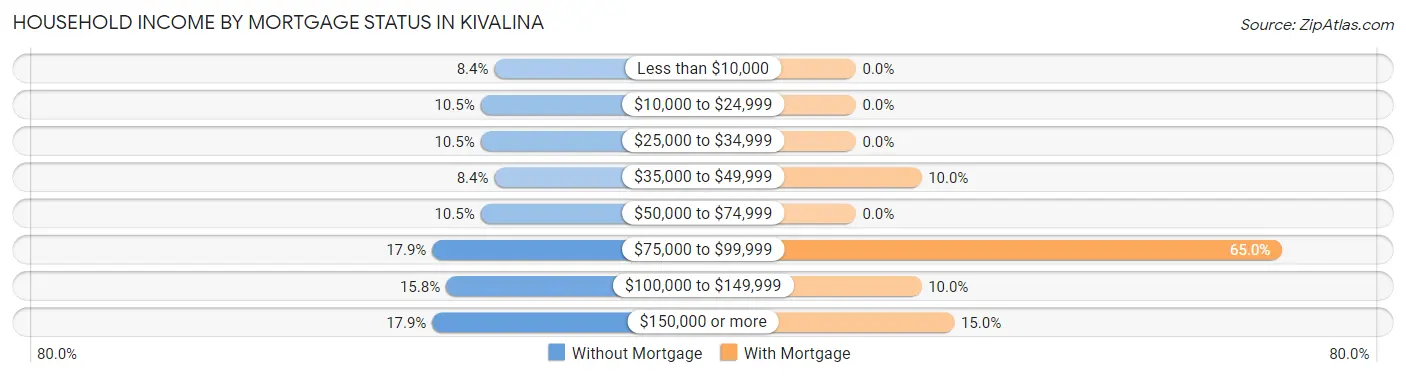
| Household Income | Without Mortgage | With Mortgage |
| Less than $10,000 | 8 (8.4%) | 0 (0.0%) |
| $10,000 to $24,999 | 10 (10.5%) | 0 (0.0%) |
| $25,000 to $34,999 | 10 (10.5%) | 0 (0.0%) |
| $35,000 to $49,999 | 8 (8.4%) | 2 (10.0%) |
| $50,000 to $74,999 | 10 (10.5%) | 0 (0.0%) |
| $75,000 to $99,999 | 17 (17.9%) | 13 (65.0%) |
| $100,000 to $149,999 | 15 (15.8%) | 2 (10.0%) |
| $150,000 or more | 17 (17.9%) | 3 (15.0%) |
| Total | 95 (100.0%) | 20 (100.0%) |
Property Value to Household Income Ratio in Kivalina
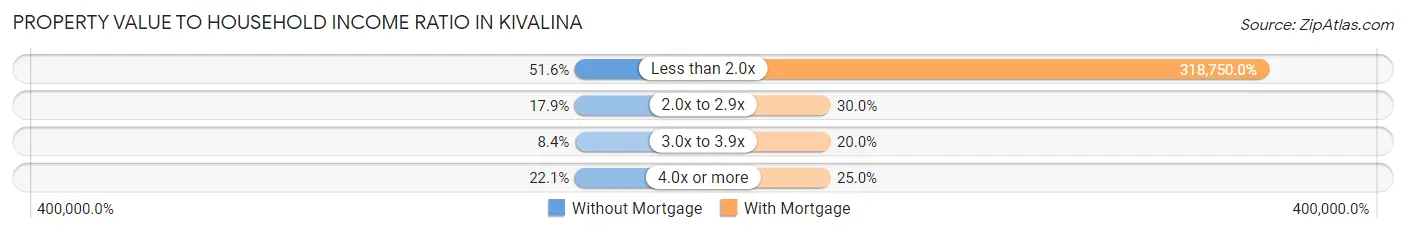
| Value-to-Income Ratio | Without Mortgage | With Mortgage |
| Less than 2.0x | 49 (51.6%) | 63,750 (318,750.0%) |
| 2.0x to 2.9x | 17 (17.9%) | 6 (30.0%) |
| 3.0x to 3.9x | 8 (8.4%) | 4 (20.0%) |
| 4.0x or more | 21 (22.1%) | 5 (25.0%) |
| Total | 95 (100.0%) | 20 (100.0%) |
Real Estate Taxes by Mortgage Status in Kivalina
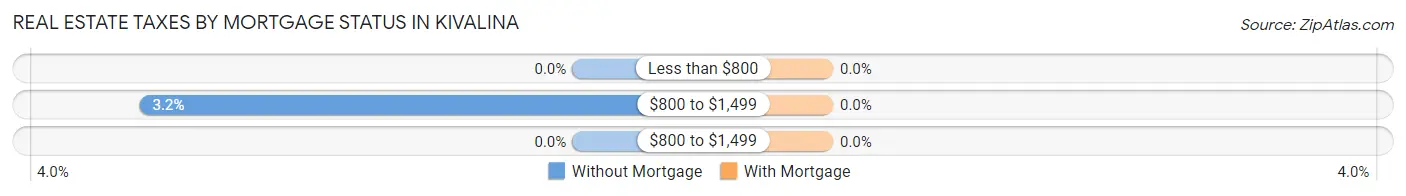
| Property Taxes | Without Mortgage | With Mortgage |
| Less than $800 | 0 (0.0%) | 0 (0.0%) |
| $800 to $1,499 | 3 (3.2%) | 0 (0.0%) |
| $800 to $1,499 | 0 (0.0%) | 0 (0.0%) |
| Total | 95 (100.0%) | 20 (100.0%) |
Health & Disability in Kivalina
Health Insurance Coverage by Age in Kivalina
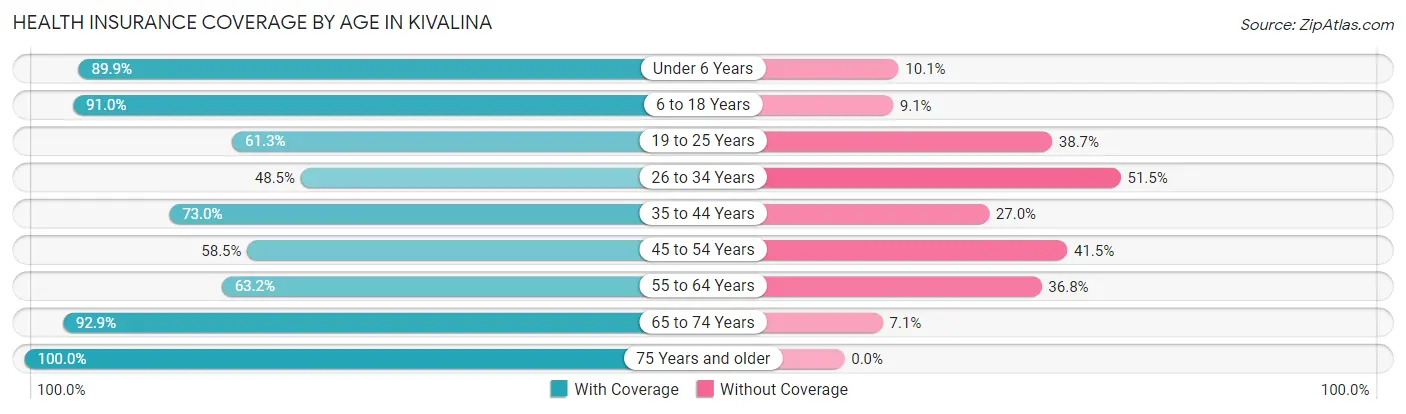
| Age Bracket | With Coverage | Without Coverage |
| Under 6 Years | 98 (89.9%) | 11 (10.1%) |
| 6 to 18 Years | 211 (90.9%) | 21 (9.0%) |
| 19 to 25 Years | 38 (61.3%) | 24 (38.7%) |
| 26 to 34 Years | 48 (48.5%) | 51 (51.5%) |
| 35 to 44 Years | 65 (73.0%) | 24 (27.0%) |
| 45 to 54 Years | 38 (58.5%) | 27 (41.5%) |
| 55 to 64 Years | 43 (63.2%) | 25 (36.8%) |
| 65 to 74 Years | 26 (92.9%) | 2 (7.1%) |
| 75 Years and older | 15 (100.0%) | 0 (0.0%) |
| Total | 582 (75.9%) | 185 (24.1%) |
Health Insurance Coverage by Citizenship Status in Kivalina
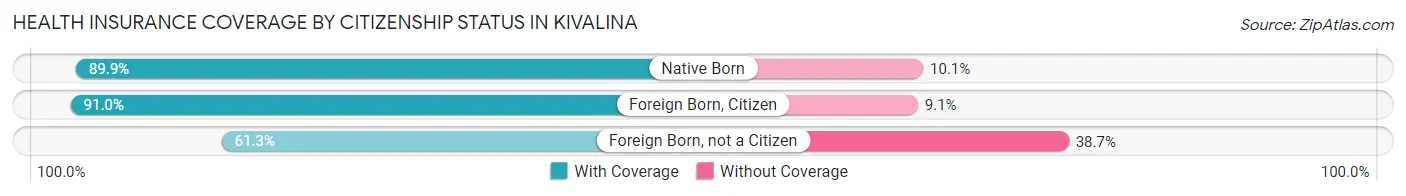
| Citizenship Status | With Coverage | Without Coverage |
| Native Born | 98 (89.9%) | 11 (10.1%) |
| Foreign Born, Citizen | 211 (90.9%) | 21 (9.0%) |
| Foreign Born, not a Citizen | 38 (61.3%) | 24 (38.7%) |
Health Insurance Coverage by Household Income in Kivalina
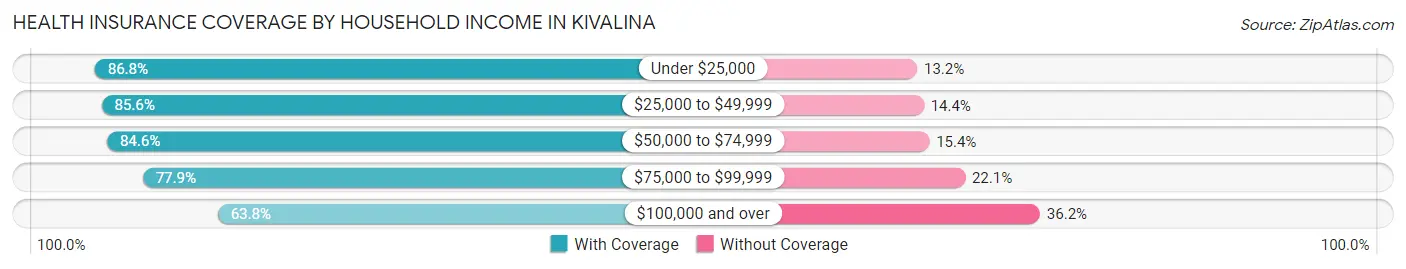
| Household Income | With Coverage | Without Coverage |
| Under $25,000 | 66 (86.8%) | 10 (13.2%) |
| $25,000 to $49,999 | 101 (85.6%) | 17 (14.4%) |
| $50,000 to $74,999 | 126 (84.6%) | 23 (15.4%) |
| $75,000 to $99,999 | 102 (77.9%) | 29 (22.1%) |
| $100,000 and over | 187 (63.8%) | 106 (36.2%) |
Public vs Private Health Insurance Coverage by Age in Kivalina
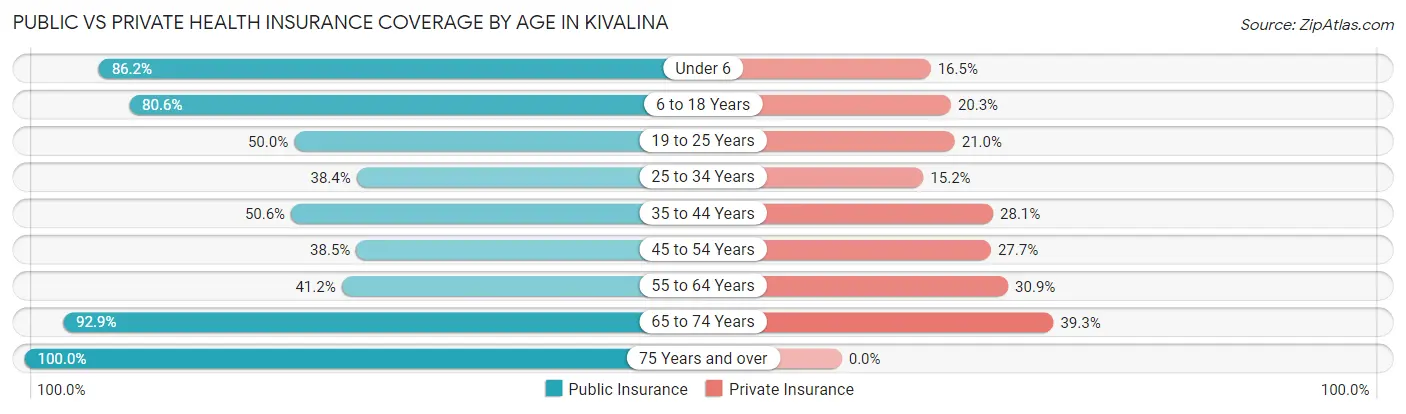
| Age Bracket | Public Insurance | Private Insurance |
| Under 6 | 94 (86.2%) | 18 (16.5%) |
| 6 to 18 Years | 187 (80.6%) | 47 (20.3%) |
| 19 to 25 Years | 31 (50.0%) | 13 (21.0%) |
| 25 to 34 Years | 38 (38.4%) | 15 (15.1%) |
| 35 to 44 Years | 45 (50.6%) | 25 (28.1%) |
| 45 to 54 Years | 25 (38.5%) | 18 (27.7%) |
| 55 to 64 Years | 28 (41.2%) | 21 (30.9%) |
| 65 to 74 Years | 26 (92.9%) | 11 (39.3%) |
| 75 Years and over | 15 (100.0%) | 0 (0.0%) |
| Total | 489 (63.7%) | 168 (21.9%) |
Disability Status by Sex by Age in Kivalina
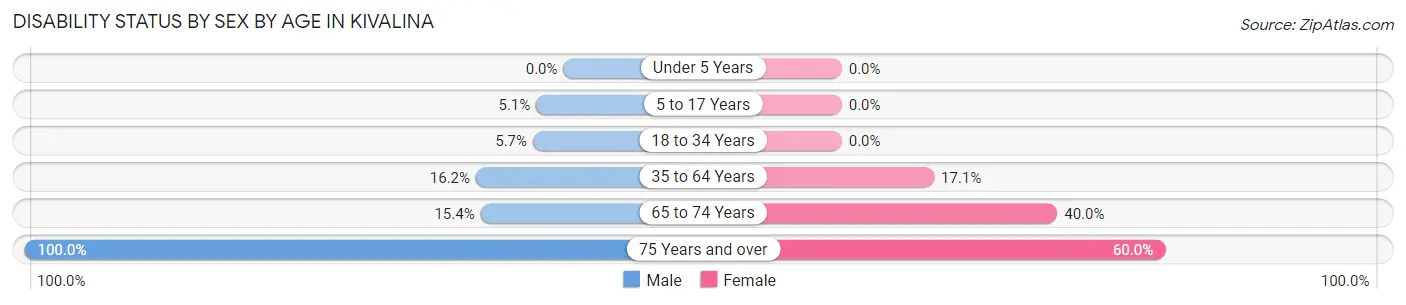
| Age Bracket | Male | Female |
| Under 5 Years | 0 (0.0%) | 0 (0.0%) |
| 5 to 17 Years | 8 (5.1%) | 0 (0.0%) |
| 18 to 34 Years | 6 (5.7%) | 0 (0.0%) |
| 35 to 64 Years | 19 (16.2%) | 18 (17.1%) |
| 65 to 74 Years | 2 (15.4%) | 6 (40.0%) |
| 75 Years and over | 10 (100.0%) | 3 (60.0%) |
Disability Class by Sex by Age in Kivalina
Disability Class: Hearing Difficulty
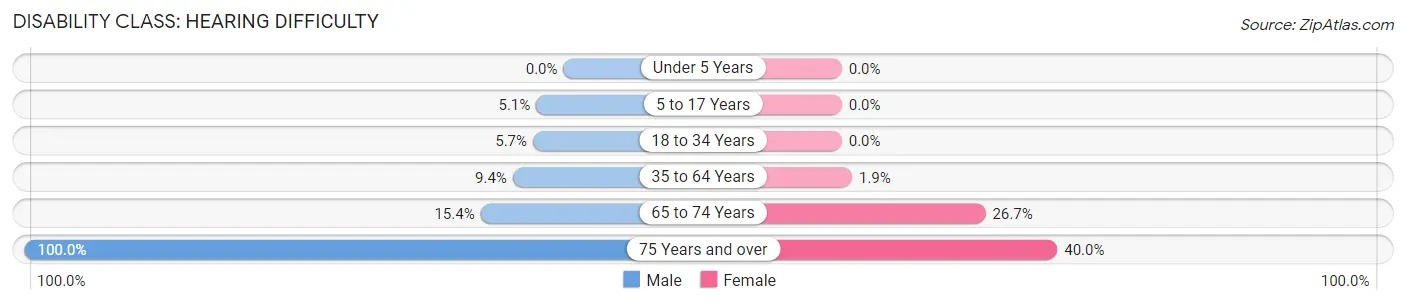
| Age Bracket | Male | Female |
| Under 5 Years | 0 (0.0%) | 0 (0.0%) |
| 5 to 17 Years | 8 (5.1%) | 0 (0.0%) |
| 18 to 34 Years | 6 (5.7%) | 0 (0.0%) |
| 35 to 64 Years | 11 (9.4%) | 2 (1.9%) |
| 65 to 74 Years | 2 (15.4%) | 4 (26.7%) |
| 75 Years and over | 10 (100.0%) | 2 (40.0%) |
Disability Class: Vision Difficulty
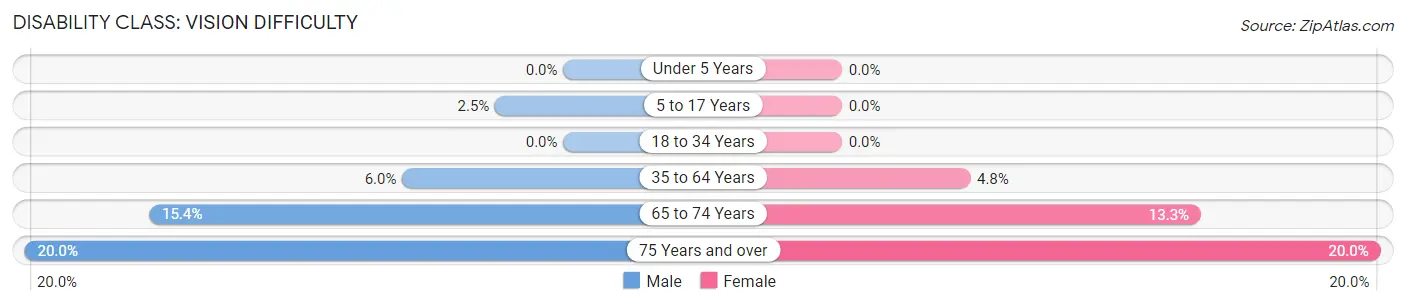
| Age Bracket | Male | Female |
| Under 5 Years | 0 (0.0%) | 0 (0.0%) |
| 5 to 17 Years | 4 (2.5%) | 0 (0.0%) |
| 18 to 34 Years | 0 (0.0%) | 0 (0.0%) |
| 35 to 64 Years | 7 (6.0%) | 5 (4.8%) |
| 65 to 74 Years | 2 (15.4%) | 2 (13.3%) |
| 75 Years and over | 2 (20.0%) | 1 (20.0%) |
Disability Class: Cognitive Difficulty
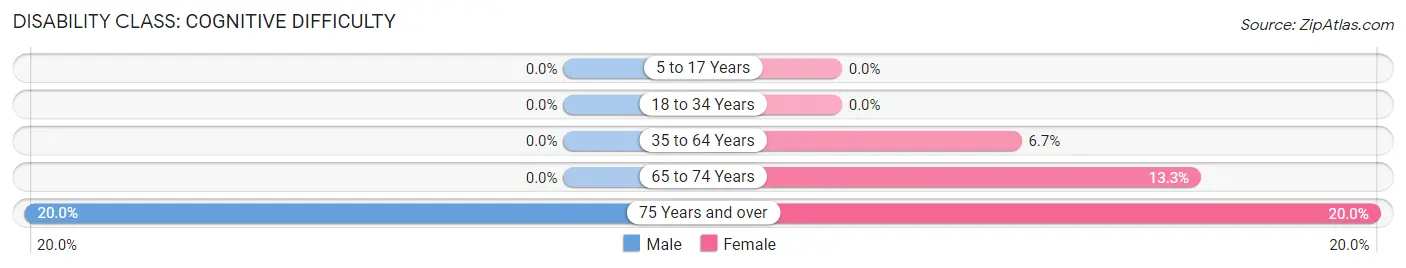
| Age Bracket | Male | Female |
| 5 to 17 Years | 0 (0.0%) | 0 (0.0%) |
| 18 to 34 Years | 0 (0.0%) | 0 (0.0%) |
| 35 to 64 Years | 0 (0.0%) | 7 (6.7%) |
| 65 to 74 Years | 0 (0.0%) | 2 (13.3%) |
| 75 Years and over | 2 (20.0%) | 1 (20.0%) |
Disability Class: Ambulatory Difficulty
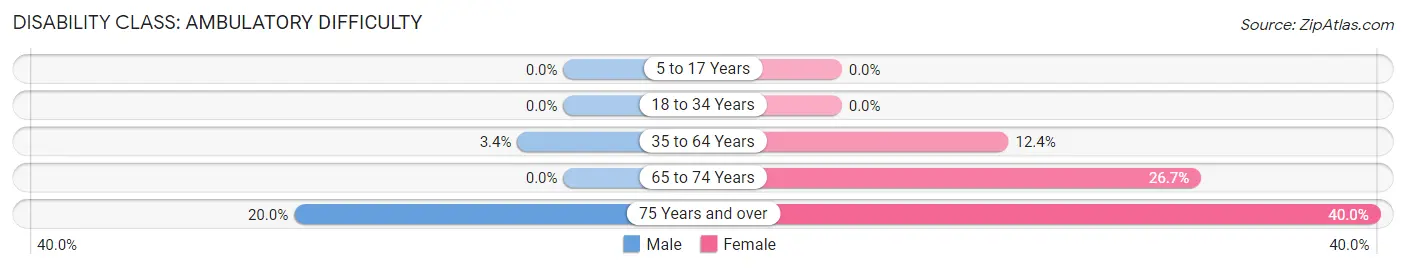
| Age Bracket | Male | Female |
| 5 to 17 Years | 0 (0.0%) | 0 (0.0%) |
| 18 to 34 Years | 0 (0.0%) | 0 (0.0%) |
| 35 to 64 Years | 4 (3.4%) | 13 (12.4%) |
| 65 to 74 Years | 0 (0.0%) | 4 (26.7%) |
| 75 Years and over | 2 (20.0%) | 2 (40.0%) |
Disability Class: Self-Care Difficulty
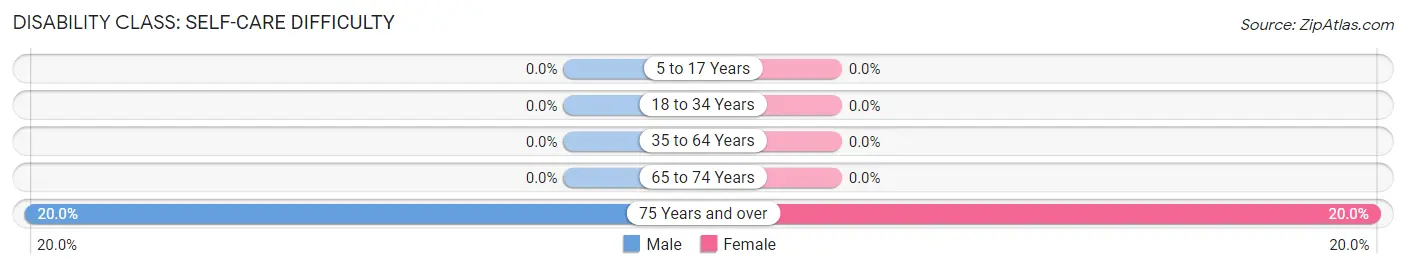
| Age Bracket | Male | Female |
| 5 to 17 Years | 0 (0.0%) | 0 (0.0%) |
| 18 to 34 Years | 0 (0.0%) | 0 (0.0%) |
| 35 to 64 Years | 0 (0.0%) | 0 (0.0%) |
| 65 to 74 Years | 0 (0.0%) | 0 (0.0%) |
| 75 Years and over | 2 (20.0%) | 1 (20.0%) |
Technology Access in Kivalina
Computing Device Access in Kivalina
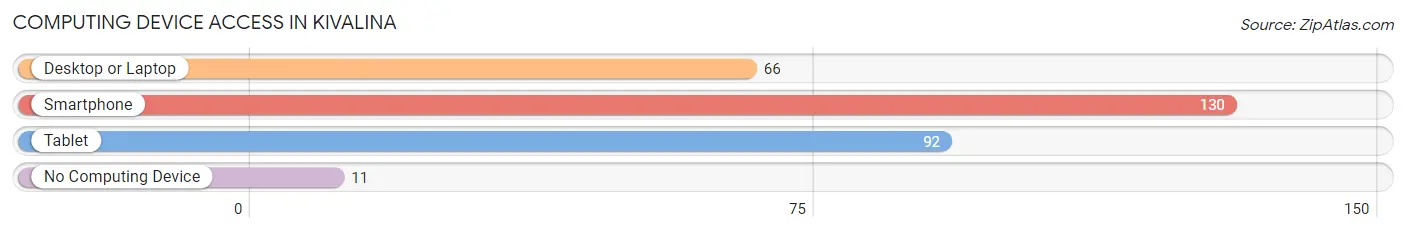
| Device Type | # Households | % Households |
| Desktop or Laptop | 66 | 45.8% |
| Smartphone | 130 | 90.3% |
| Tablet | 92 | 63.9% |
| No Computing Device | 11 | 7.6% |
| Total | 144 | 100.0% |
Internet Access in Kivalina
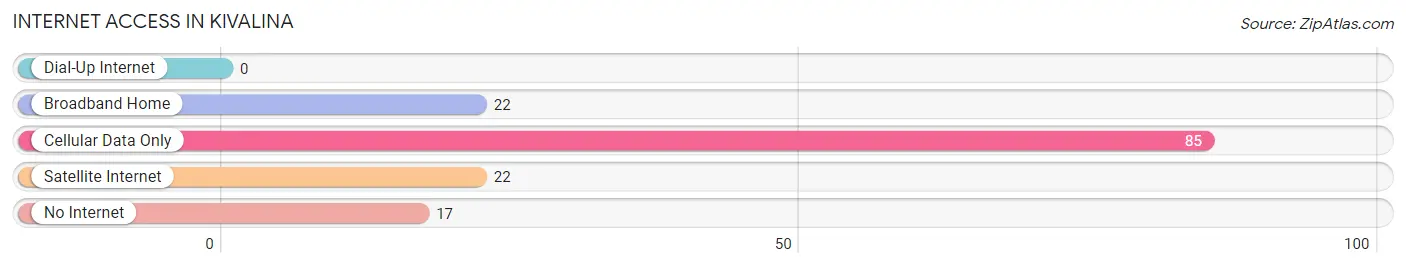
| Internet Type | # Households | % Households |
| Dial-Up Internet | 0 | 0.0% |
| Broadband Home | 22 | 15.3% |
| Cellular Data Only | 85 | 59.0% |
| Satellite Internet | 22 | 15.3% |
| No Internet | 17 | 11.8% |
| Total | 144 | 100.0% |
Kivalina Summary
Kivalina is a small Inupiat Eskimo village located on a barrier island in the Chukchi Sea, off the northwest coast of Alaska. It is the only village in the Kivalina region, and is home to approximately 400 people. The village is located on a narrow strip of land between the Chukchi Sea and the Kivalina River, and is surrounded by wetlands and tundra.
History
Kivalina has been inhabited by the Inupiat Eskimos for centuries. The Inupiat people have a long history of living off the land, relying on the resources of the sea and the tundra for their sustenance. The Inupiat people have a strong cultural identity and are closely connected to the land and the sea.
Kivalina was first recorded in the early 1900s, when it was visited by a U.S. Geological Survey team. The team noted the presence of a small village, and the presence of a trading post. In the early 1900s, Kivalina was a trading post for the Inupiat people, and was a hub for trading goods between the Inupiat and other tribes.
Geography
Kivalina is located on a narrow strip of land between the Chukchi Sea and the Kivalina River. The village is surrounded by wetlands and tundra, and is located on a barrier island. The island is approximately 8 miles long and 1 mile wide. The island is subject to frequent storms and flooding, and is vulnerable to erosion.
The climate in Kivalina is cold and dry, with temperatures ranging from -20°F in the winter to 60°F in the summer. The area receives an average of 10 inches of precipitation per year.
Economy
Kivalina’s economy is largely based on subsistence fishing and hunting. The Inupiat people rely on the resources of the sea and the tundra for their sustenance. The village also has a small commercial fishing industry, and some of the residents are employed in the tourism industry.
The village also receives funding from the federal government, which is used to fund infrastructure projects and other services. The village also receives funding from the Alaska Native Claims Settlement Act, which provides funding for education, health care, and other services.
Demographics
Kivalina is home to approximately 400 people. The population is predominantly Inupiat Eskimo, and the village is considered to be a traditional Inupiat Eskimo village. The village is also home to a small number of non-Native residents.
The village is served by a single school, Kivalina Elementary School, which serves students in grades K-12. The school is operated by the Northwest Arctic Borough School District.
Conclusion
Kivalina is a small Inupiat Eskimo village located on a barrier island in the Chukchi Sea, off the northwest coast of Alaska. It is the only village in the Kivalina region, and is home to approximately 400 people. The village is surrounded by wetlands and tundra, and is vulnerable to storms and flooding. The economy of Kivalina is largely based on subsistence fishing and hunting, and the village also receives funding from the federal government. The population is predominantly Inupiat Eskimo, and the village is served by a single school.
Common Questions
What is Per Capita Income in Kivalina?
Per Capita income in Kivalina is $17,922.
What is the Median Family Income in Kivalina?
Median Family Income in Kivalina is $69,375.
What is the Median Household income in Kivalina?
Median Household Income in Kivalina is $68,750.
What is Income or Wage Gap in Kivalina?
Income or Wage Gap in Kivalina is 4.0%.
Women in Kivalina earn 96.0 cents for every dollar earned by a man.
What is Inequality or Gini Index in Kivalina?
Inequality or Gini Index in Kivalina is 0.39.
What is the Total Population of Kivalina?
Total Population of Kivalina is 769.
What is the Total Male Population of Kivalina?
Total Male Population of Kivalina is 457.
What is the Total Female Population of Kivalina?
Total Female Population of Kivalina is 312.
What is the Ratio of Males per 100 Females in Kivalina?
There are 146.47 Males per 100 Females in Kivalina.
What is the Ratio of Females per 100 Males in Kivalina?
There are 68.27 Females per 100 Males in Kivalina.
What is the Median Population Age in Kivalina?
Median Population Age in Kivalina is 24.3 Years.
What is the Average Family Size in Kivalina
Average Family Size in Kivalina is 5.7 People.
What is the Average Household Size in Kivalina
Average Household Size in Kivalina is 5.3 People.
How Large is the Labor Force in Kivalina?
There are 260 People in the Labor Forcein in Kivalina.
What is the Percentage of People in the Labor Force in Kivalina?
56.4% of People are in the Labor Force in Kivalina.
What is the Unemployment Rate in Kivalina?
Unemployment Rate in Kivalina is 22.5%.