Goodnews Bay, AK Map & Demographics
Goodnews Bay Map
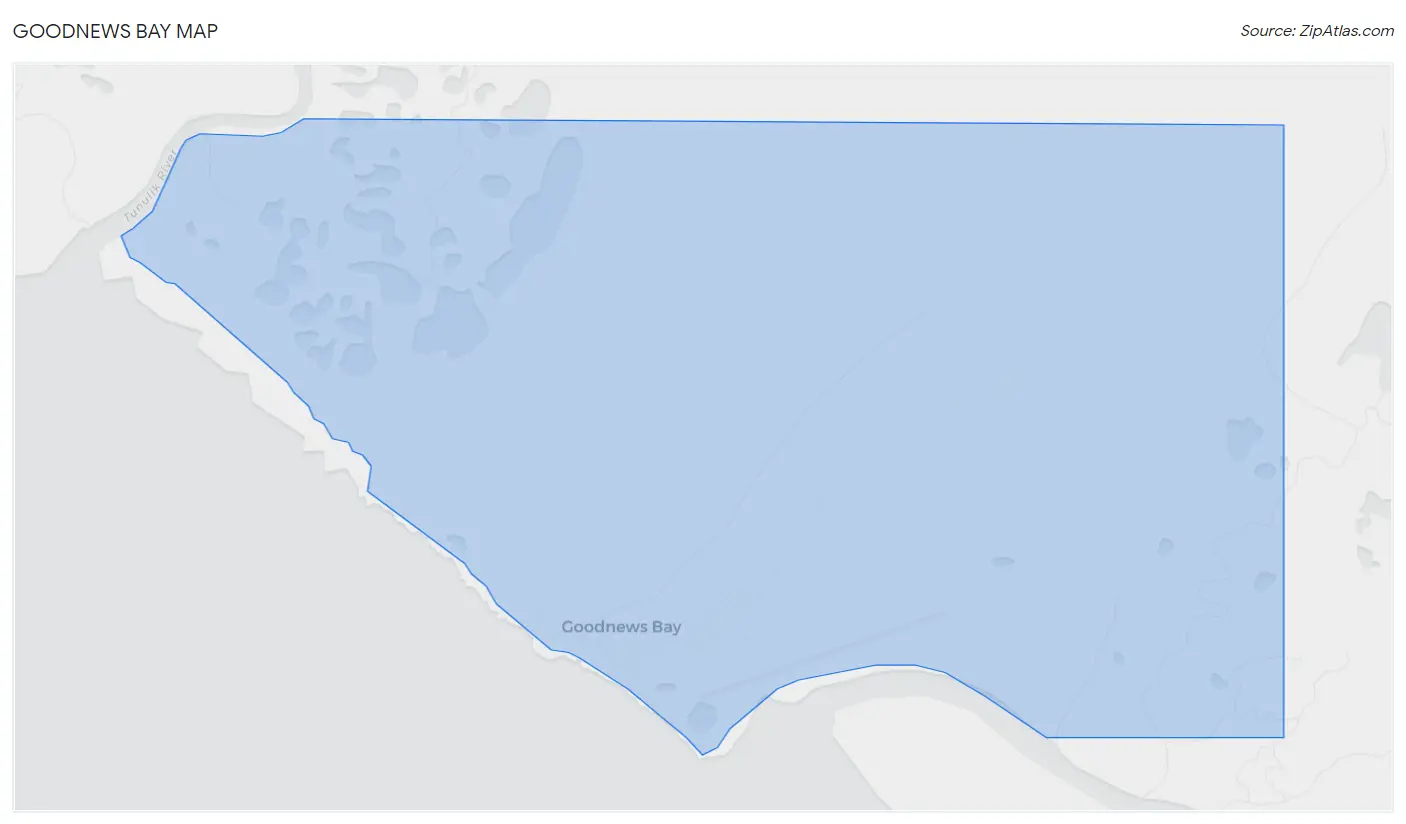
Goodnews Bay Overview
$11,503
PER CAPITA INCOME
$27,083
AVG FAMILY INCOME
$27,708
AVG HOUSEHOLD INCOME
3.3%
WAGE / INCOME GAP [ % ]
96.7¢/ $1
WAGE / INCOME GAP [ $ ]
0.46
INEQUALITY / GINI INDEX
118
TOTAL POPULATION
48
MALE POPULATION
70
FEMALE POPULATION
68.57
MALES / 100 FEMALES
145.83
FEMALES / 100 MALES
32.8
MEDIAN AGE
3.6
AVG FAMILY SIZE
3.2
AVG HOUSEHOLD SIZE
49
LABOR FORCE [ PEOPLE ]
61.3%
PERCENT IN LABOR FORCE
6.1%
UNEMPLOYMENT RATE
Goodnews Bay Zip Codes
Goodnews Bay Area Codes
Income in Goodnews Bay
Income Overview in Goodnews Bay
Per Capita Income in Goodnews Bay is $11,503, while median incomes of families and households are $27,083 and $27,708 respectively.
| Characteristic | Number | Measure |
| Per Capita Income | 118 | $11,503 |
| Median Family Income | 27 | $27,083 |
| Mean Family Income | 27 | $43,267 |
| Median Household Income | 37 | $27,708 |
| Mean Household Income | 37 | $37,495 |
| Income Deficit | 27 | $0 |
| Wage / Income Gap (%) | 118 | 3.33% |
| Wage / Income Gap ($) | 118 | 96.67¢ per $1 |
| Gini / Inequality Index | 118 | 0.46 |
Earnings by Sex in Goodnews Bay
Average Earnings in Goodnews Bay are $18,393, $18,125 for men and $18,750 for women, a difference of 3.3%.

| Sex | Number | Average Earnings |
| Male | 24 (45.3%) | $18,125 |
| Female | 29 (54.7%) | $18,750 |
| Total | 53 (100.0%) | $18,393 |
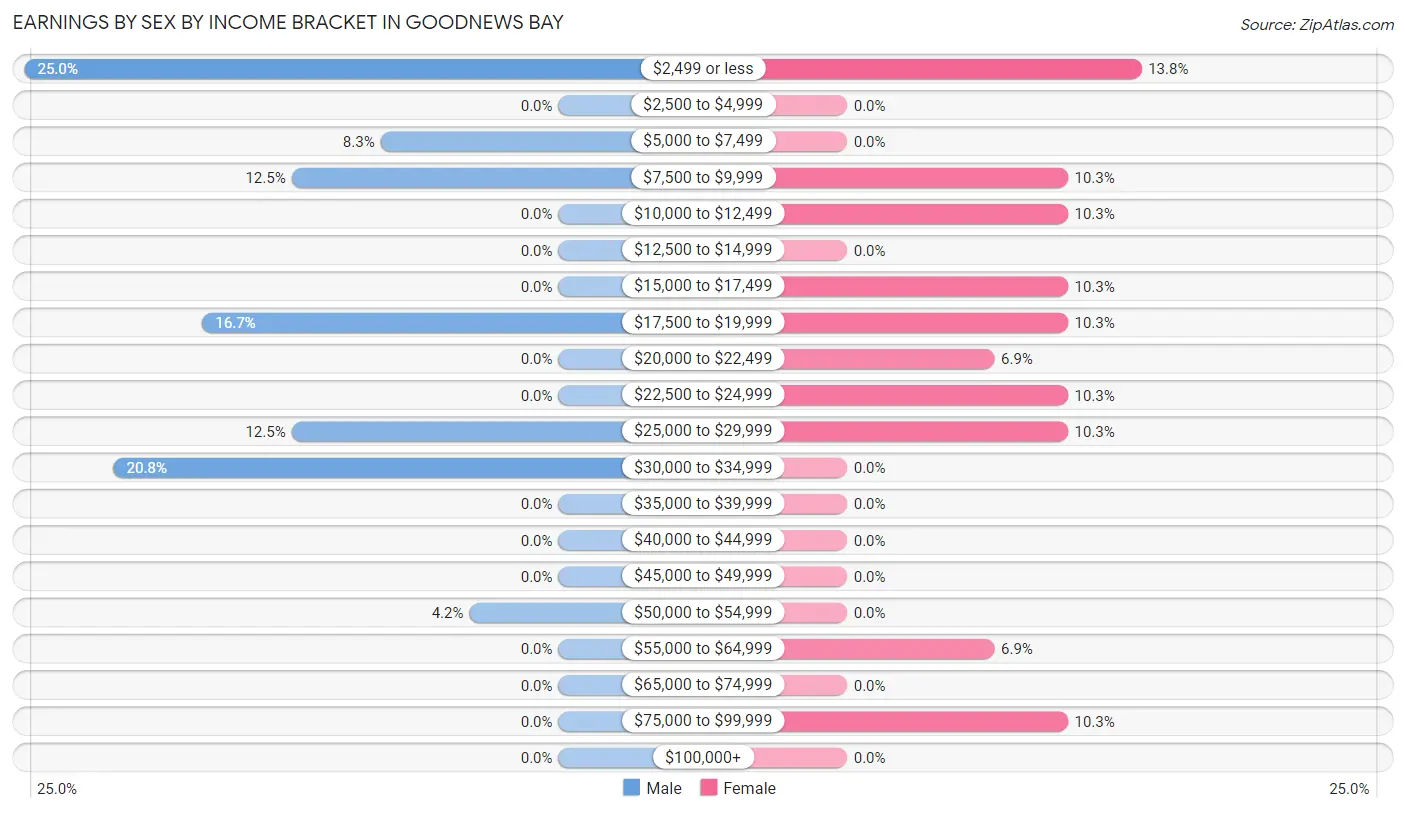
Earnings by Sex by Income Bracket in Goodnews Bay
The most common earnings brackets in Goodnews Bay are $2,499 or less for men (6 | 25.0%) and $2,499 or less for women (4 | 13.8%).
| Income | Male | Female |
| $2,499 or less | 6 (25.0%) | 4 (13.8%) |
| $2,500 to $4,999 | 0 (0.0%) | 0 (0.0%) |
| $5,000 to $7,499 | 2 (8.3%) | 0 (0.0%) |
| $7,500 to $9,999 | 3 (12.5%) | 3 (10.3%) |
| $10,000 to $12,499 | 0 (0.0%) | 3 (10.3%) |
| $12,500 to $14,999 | 0 (0.0%) | 0 (0.0%) |
| $15,000 to $17,499 | 0 (0.0%) | 3 (10.3%) |
| $17,500 to $19,999 | 4 (16.7%) | 3 (10.3%) |
| $20,000 to $22,499 | 0 (0.0%) | 2 (6.9%) |
| $22,500 to $24,999 | 0 (0.0%) | 3 (10.3%) |
| $25,000 to $29,999 | 3 (12.5%) | 3 (10.3%) |
| $30,000 to $34,999 | 5 (20.8%) | 0 (0.0%) |
| $35,000 to $39,999 | 0 (0.0%) | 0 (0.0%) |
| $40,000 to $44,999 | 0 (0.0%) | 0 (0.0%) |
| $45,000 to $49,999 | 0 (0.0%) | 0 (0.0%) |
| $50,000 to $54,999 | 1 (4.2%) | 0 (0.0%) |
| $55,000 to $64,999 | 0 (0.0%) | 2 (6.9%) |
| $65,000 to $74,999 | 0 (0.0%) | 0 (0.0%) |
| $75,000 to $99,999 | 0 (0.0%) | 3 (10.3%) |
| $100,000+ | 0 (0.0%) | 0 (0.0%) |
| Total | 24 (100.0%) | 29 (100.0%) |
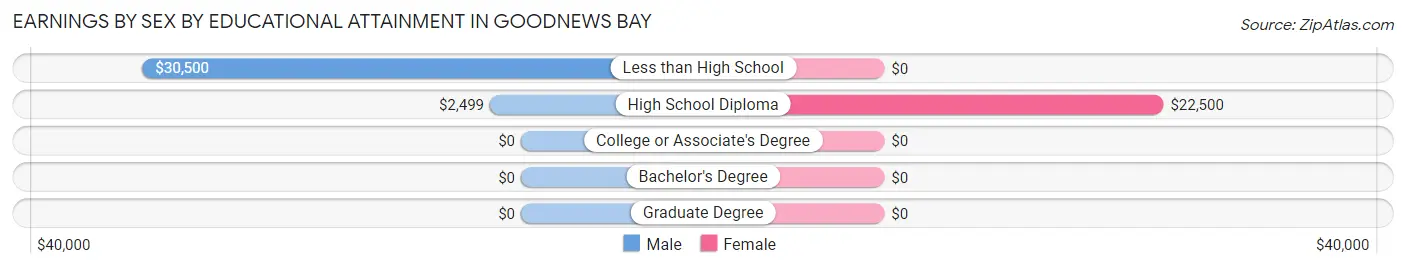
Earnings by Sex by Educational Attainment in Goodnews Bay
Average earnings in Goodnews Bay are $18,125 for men and $18,750 for women, a difference of 3.3%. Men with an educational attainment of less than high school enjoy the highest average annual earnings of $30,500, while those with high school diploma education earn the least with $2,499. Women with an educational attainment of high school diploma earn the most with the average annual earnings of $22,500, while those with high school diploma education have the smallest earnings of $22,500.
| Educational Attainment | Male Income | Female Income |
| Less than High School | $30,500 | $0 |
| High School Diploma | $2,499 | $22,500 |
| College or Associate's Degree | - | - |
| Bachelor's Degree | - | - |
| Graduate Degree | - | - |
| Total | $18,125 | $18,750 |
Family Income in Goodnews Bay
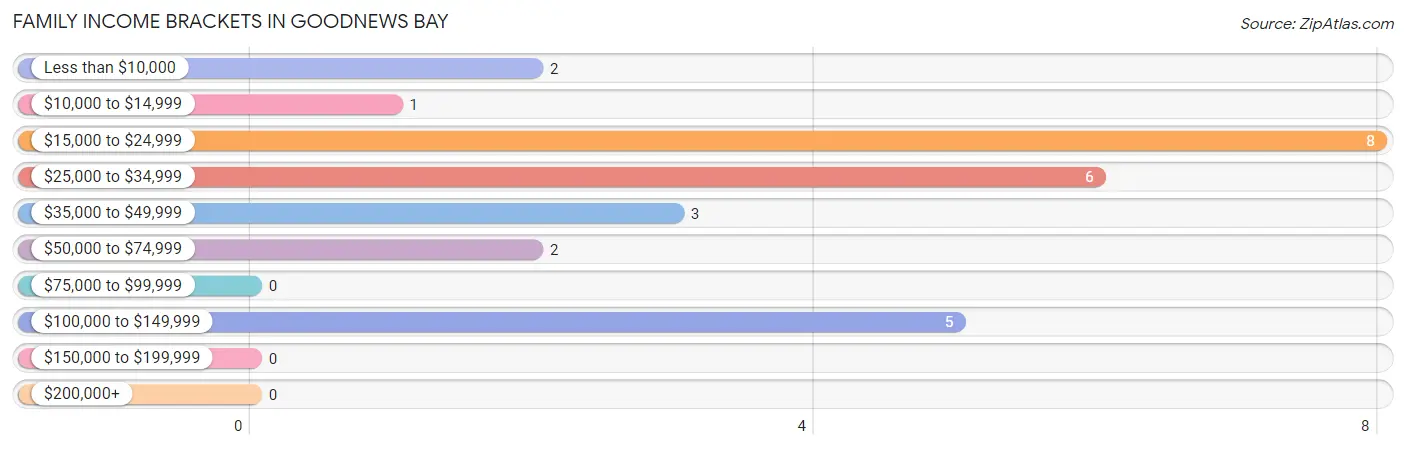
Family Income Brackets in Goodnews Bay
According to the Goodnews Bay family income data, there are 8 families falling into the $15,000 to $24,999 income range, which is the most common income bracket and makes up 29.6% of all families.
| Income Bracket | # Families | % Families |
| Less than $10,000 | 2 | 7.4% |
| $10,000 to $14,999 | 1 | 3.7% |
| $15,000 to $24,999 | 8 | 29.6% |
| $25,000 to $34,999 | 6 | 22.2% |
| $35,000 to $49,999 | 3 | 11.1% |
| $50,000 to $74,999 | 2 | 7.4% |
| $75,000 to $99,999 | 0 | 0.0% |
| $100,000 to $149,999 | 5 | 18.5% |
| $150,000 to $199,999 | 0 | 0.0% |
| $200,000+ | 0 | 0.0% |
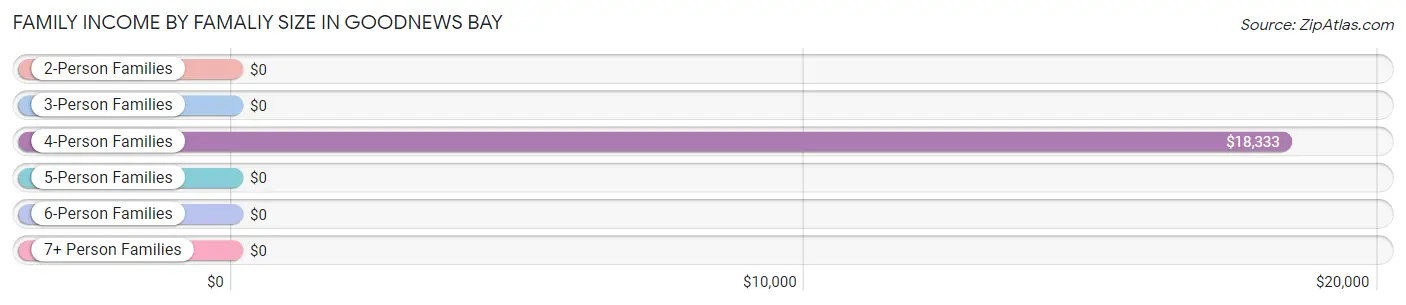
Family Income by Famaliy Size in Goodnews Bay
4-person families (8 | 29.6%) account for the highest median family income in Goodnews Bay with $18,333 per family, while 4-person families (8 | 29.6%) have the highest median income of $4,583 per family member.
| Income Bracket | # Families | Median Income |
| 2-Person Families | 9 (33.3%) | $0 |
| 3-Person Families | 5 (18.5%) | $0 |
| 4-Person Families | 8 (29.6%) | $18,333 |
| 5-Person Families | 5 (18.5%) | $0 |
| 6-Person Families | 0 (0.0%) | $0 |
| 7+ Person Families | 0 (0.0%) | $0 |
| Total | 27 (100.0%) | $27,083 |
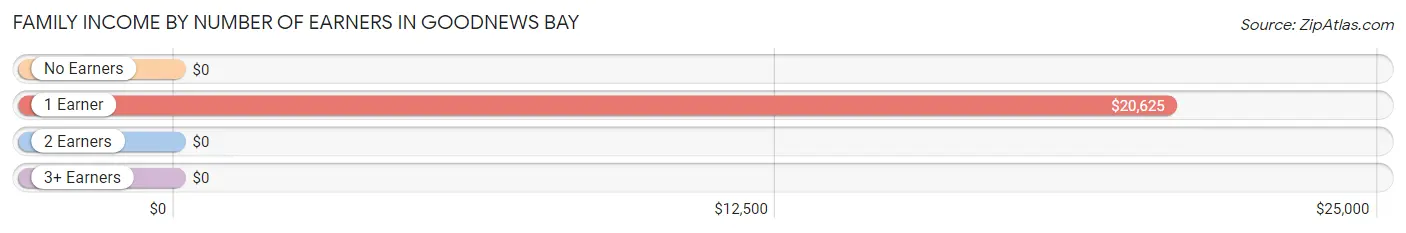
Family Income by Number of Earners in Goodnews Bay
| Number of Earners | # Families | Median Income |
| No Earners | 5 (18.5%) | $0 |
| 1 Earner | 9 (33.3%) | $20,625 |
| 2 Earners | 13 (48.1%) | $0 |
| 3+ Earners | 0 (0.0%) | $0 |
| Total | 27 (100.0%) | $27,083 |
Household Income in Goodnews Bay
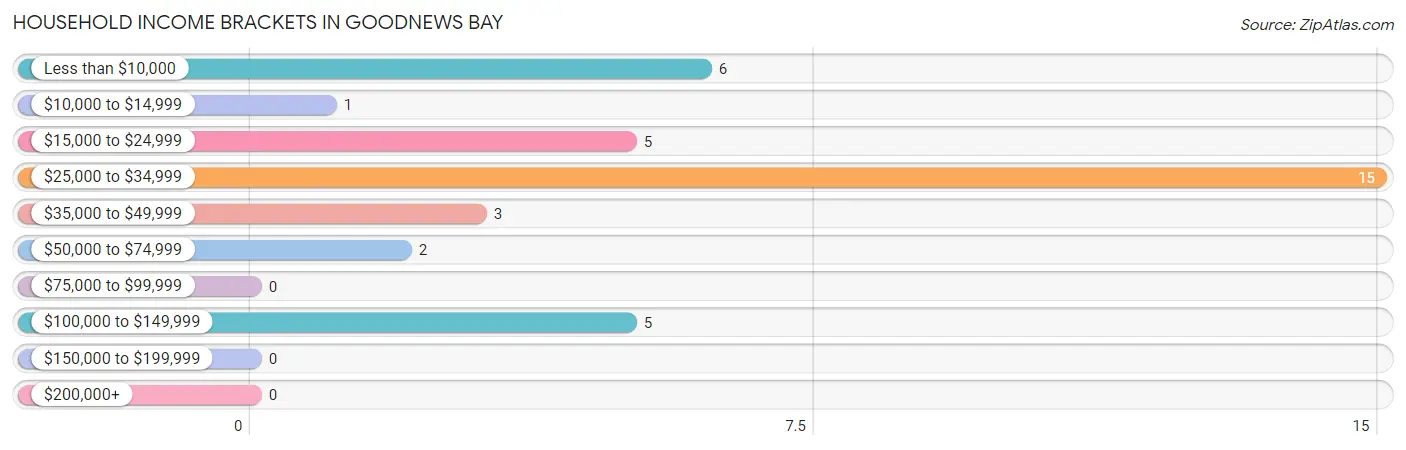
Household Income Brackets in Goodnews Bay
With 15 households falling in the category, the $25,000 to $34,999 income range is the most frequent in Goodnews Bay, accounting for 40.5% of all households.
| Income Bracket | # Households | % Households |
| Less than $10,000 | 6 | 16.2% |
| $10,000 to $14,999 | 1 | 2.7% |
| $15,000 to $24,999 | 5 | 13.5% |
| $25,000 to $34,999 | 15 | 40.5% |
| $35,000 to $49,999 | 3 | 8.1% |
| $50,000 to $74,999 | 2 | 5.4% |
| $75,000 to $99,999 | 0 | 0.0% |
| $100,000 to $149,999 | 5 | 13.5% |
| $150,000 to $199,999 | 0 | 0.0% |
| $200,000+ | 0 | 0.0% |
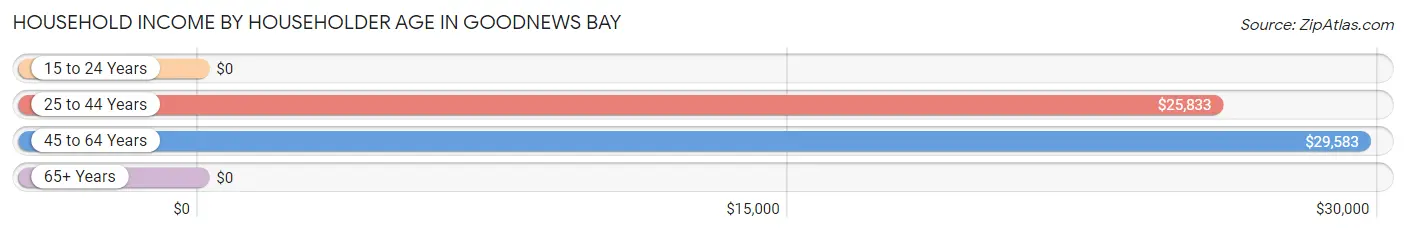
Household Income by Householder Age in Goodnews Bay
The median household income in Goodnews Bay is $27,708, with the highest median household income of $29,583 found in the 45 to 64 years age bracket for the primary householder. A total of 23 households (62.2%) fall into this category.
| Income Bracket | # Households | Median Income |
| 15 to 24 Years | 0 (0.0%) | $0 |
| 25 to 44 Years | 14 (37.8%) | $25,833 |
| 45 to 64 Years | 23 (62.2%) | $29,583 |
| 65+ Years | 0 (0.0%) | $0 |
| Total | 37 (100.0%) | $27,708 |
Poverty in Goodnews Bay
Income Below Poverty by Sex and Age in Goodnews Bay
With 62.5% poverty level for males and 60.0% for females among the residents of Goodnews Bay, under 5 year old males and 6 to 11 year old females are the most vulnerable to poverty, with 9 males (100.0%) and 9 females (100.0%) in their respective age groups living below the poverty level.
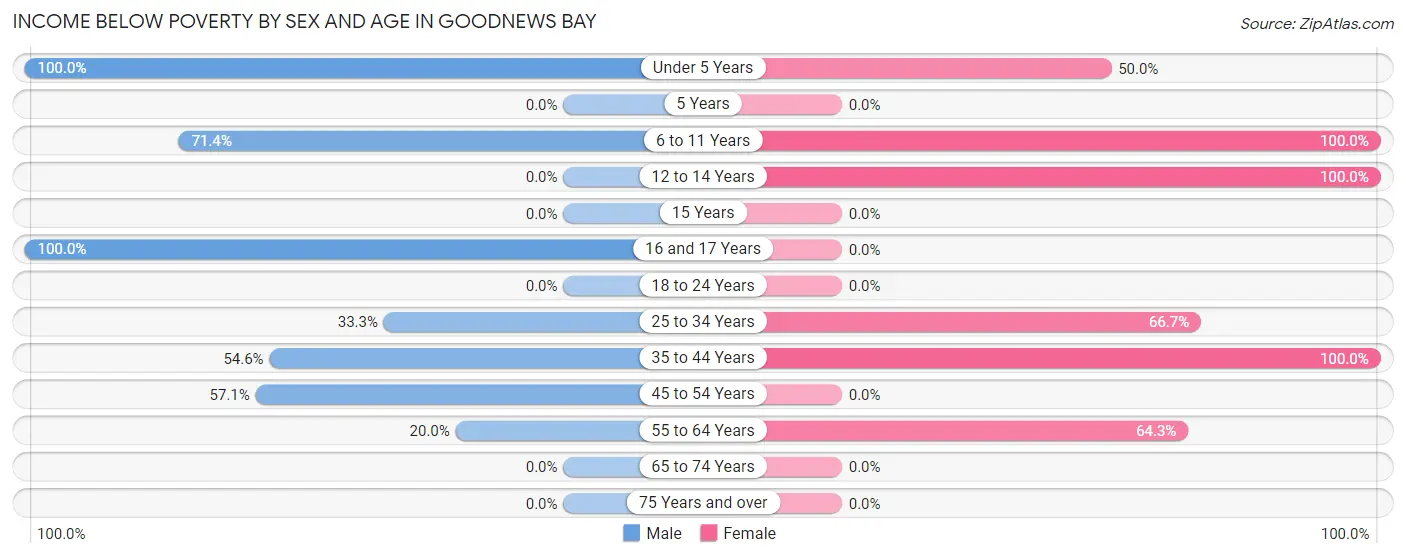
| Age Bracket | Male | Female |
| Under 5 Years | 9 (100.0%) | 5 (50.0%) |
| 5 Years | 0 (0.0%) | 0 (0.0%) |
| 6 to 11 Years | 5 (71.4%) | 9 (100.0%) |
| 12 to 14 Years | 0 (0.0%) | 3 (100.0%) |
| 15 Years | 0 (0.0%) | 0 (0.0%) |
| 16 and 17 Years | 3 (100.0%) | 0 (0.0%) |
| 18 to 24 Years | 0 (0.0%) | 0 (0.0%) |
| 25 to 34 Years | 2 (33.3%) | 10 (66.7%) |
| 35 to 44 Years | 6 (54.5%) | 6 (100.0%) |
| 45 to 54 Years | 4 (57.1%) | 0 (0.0%) |
| 55 to 64 Years | 1 (20.0%) | 9 (64.3%) |
| 65 to 74 Years | 0 (0.0%) | 0 (0.0%) |
| 75 Years and over | 0 (0.0%) | 0 (0.0%) |
| Total | 30 (62.5%) | 42 (60.0%) |
Income Above Poverty by Sex and Age in Goodnews Bay
According to the poverty statistics in Goodnews Bay, males aged 55 to 64 years and females aged 18 to 24 years are the age groups that are most secure financially, with 80.0% of males and 100.0% of females in these age groups living above the poverty line.
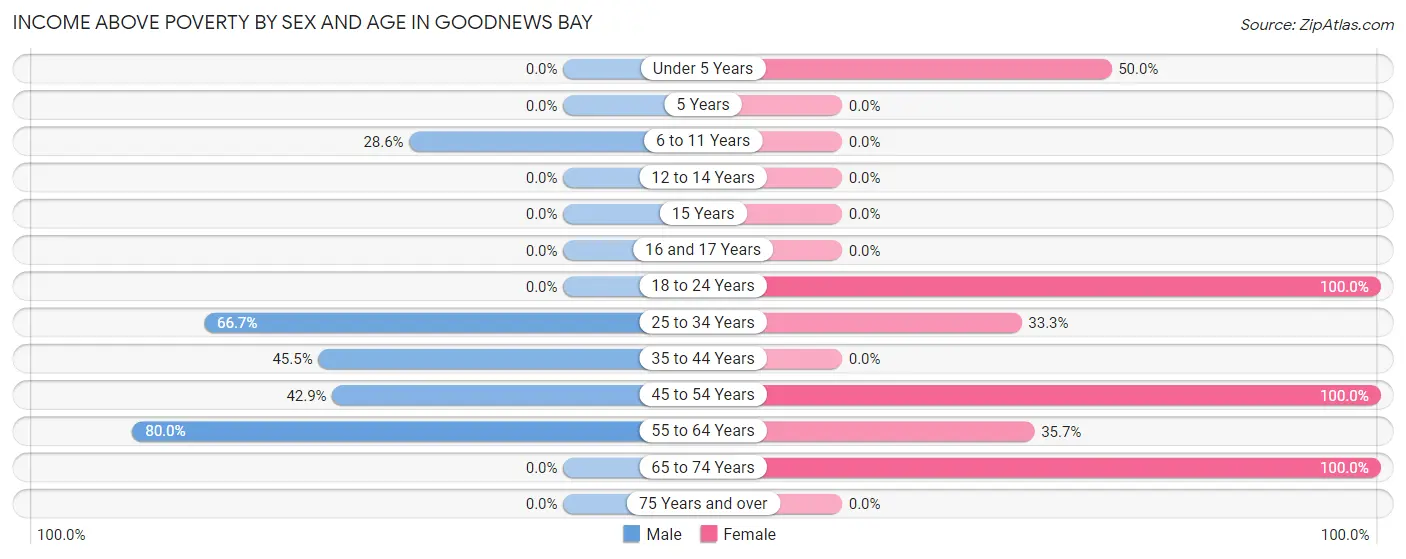
| Age Bracket | Male | Female |
| Under 5 Years | 0 (0.0%) | 5 (50.0%) |
| 5 Years | 0 (0.0%) | 0 (0.0%) |
| 6 to 11 Years | 2 (28.6%) | 0 (0.0%) |
| 12 to 14 Years | 0 (0.0%) | 0 (0.0%) |
| 15 Years | 0 (0.0%) | 0 (0.0%) |
| 16 and 17 Years | 0 (0.0%) | 0 (0.0%) |
| 18 to 24 Years | 0 (0.0%) | 4 (100.0%) |
| 25 to 34 Years | 4 (66.7%) | 5 (33.3%) |
| 35 to 44 Years | 5 (45.5%) | 0 (0.0%) |
| 45 to 54 Years | 3 (42.9%) | 6 (100.0%) |
| 55 to 64 Years | 4 (80.0%) | 5 (35.7%) |
| 65 to 74 Years | 0 (0.0%) | 3 (100.0%) |
| 75 Years and over | 0 (0.0%) | 0 (0.0%) |
| Total | 18 (37.5%) | 28 (40.0%) |
Income Below Poverty Among Married-Couple Families in Goodnews Bay
The poverty statistics for married-couple families in Goodnews Bay show that 40.0% or 4 of the total 10 families live below the poverty line. Families with 3 or 4 children have the highest poverty rate of 100.0%, comprising of 3 families. On the other hand, families with no children have the lowest poverty rate of 14.3%, which includes 1 families.
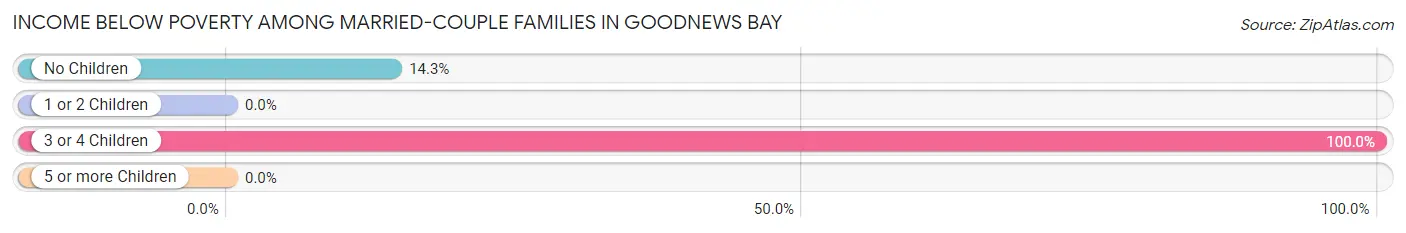
| Children | Above Poverty | Below Poverty |
| No Children | 6 (85.7%) | 1 (14.3%) |
| 1 or 2 Children | 0 (0.0%) | 0 (0.0%) |
| 3 or 4 Children | 0 (0.0%) | 3 (100.0%) |
| 5 or more Children | 0 (0.0%) | 0 (0.0%) |
| Total | 6 (60.0%) | 4 (40.0%) |
Income Below Poverty Among Single-Parent Households in Goodnews Bay
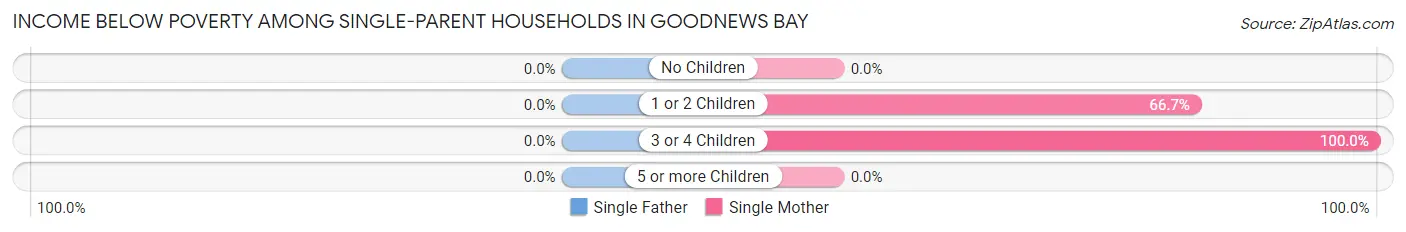
| Children | Single Father | Single Mother |
| No Children | 0 (0.0%) | 0 (0.0%) |
| 1 or 2 Children | 0 (0.0%) | 4 (66.7%) |
| 3 or 4 Children | 0 (0.0%) | 6 (100.0%) |
| 5 or more Children | 0 (0.0%) | 0 (0.0%) |
| Total | 0 (0.0%) | 10 (66.7%) |
Income Below Poverty Among Married-Couple vs Single-Parent Households in Goodnews Bay
The poverty data for Goodnews Bay shows that 4 of the married-couple family households (40.0%) and 10 of the single-parent households (58.8%) are living below the poverty level. Within the married-couple family households, those with 3 or 4 children have the highest poverty rate, with 3 households (100.0%) falling below the poverty line. Among the single-parent households, those with 3 or 4 children have the highest poverty rate, with 6 household (100.0%) living below poverty.
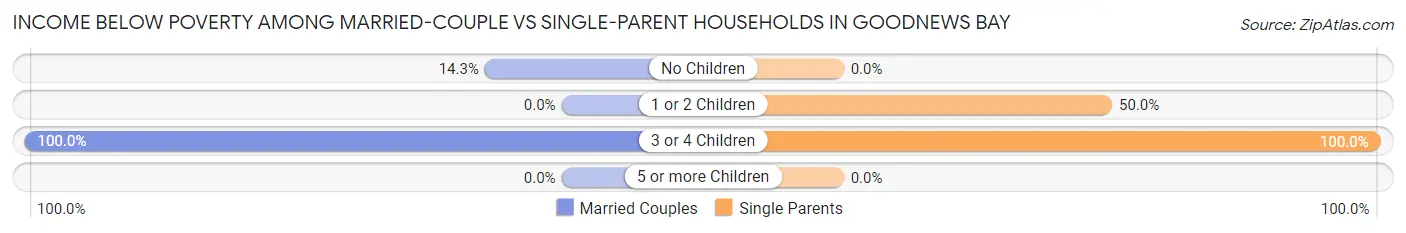
| Children | Married-Couple Families | Single-Parent Households |
| No Children | 1 (14.3%) | 0 (0.0%) |
| 1 or 2 Children | 0 (0.0%) | 4 (50.0%) |
| 3 or 4 Children | 3 (100.0%) | 6 (100.0%) |
| 5 or more Children | 0 (0.0%) | 0 (0.0%) |
| Total | 4 (40.0%) | 10 (58.8%) |
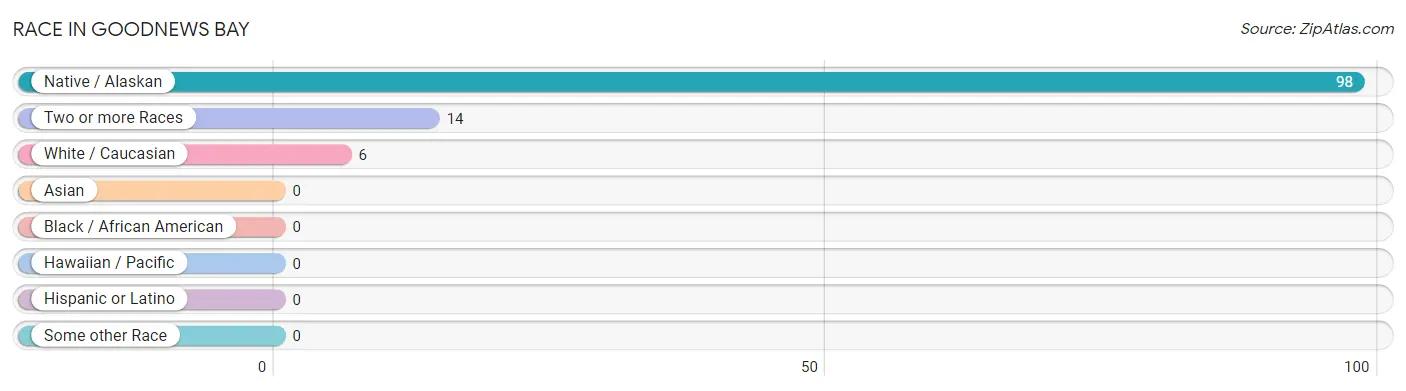
Race in Goodnews Bay
The most populous races in Goodnews Bay are Native / Alaskan (98 | 83.1%), Two or more Races (14 | 11.9%), and White / Caucasian (6 | 5.1%).
| Race | # Population | % Population |
| Asian | 0 | 0.0% |
| Black / African American | 0 | 0.0% |
| Hawaiian / Pacific | 0 | 0.0% |
| Hispanic or Latino | 0 | 0.0% |
| Native / Alaskan | 98 | 83.1% |
| White / Caucasian | 6 | 5.1% |
| Two or more Races | 14 | 11.9% |
| Some other Race | 0 | 0.0% |
| Total | 118 | 100.0% |
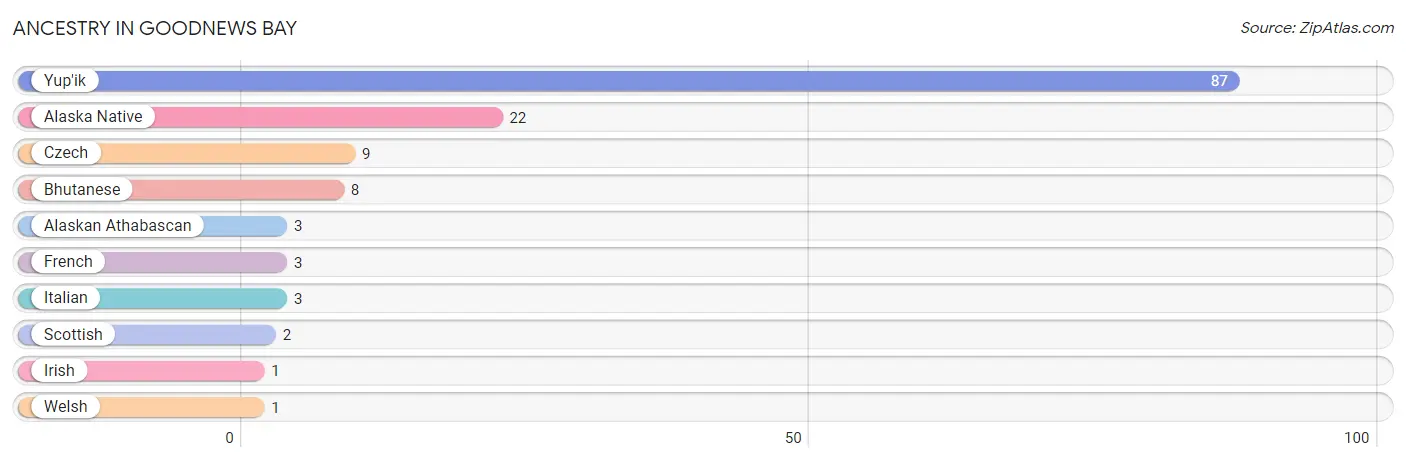
Ancestry in Goodnews Bay
The most populous ancestries reported in Goodnews Bay are Yup'ik (87 | 73.7%), Alaska Native (22 | 18.6%), Czech (9 | 7.6%), Bhutanese (8 | 6.8%), and Alaskan Athabascan (3 | 2.5%), together accounting for 109.3% of all Goodnews Bay residents.
| Ancestry | # Population | % Population |
| Alaska Native | 22 | 18.6% |
| Alaskan Athabascan | 3 | 2.5% |
| Bhutanese | 8 | 6.8% |
| Czech | 9 | 7.6% |
| French | 3 | 2.5% |
| Irish | 1 | 0.9% |
| Italian | 3 | 2.5% |
| Scottish | 2 | 1.7% |
| Welsh | 1 | 0.9% |
| Yup'ik | 87 | 73.7% | View All 10 Rows |
Immigrants in Goodnews Bay

| Immigration Origin | # Population | % Population | View All 0 Rows |
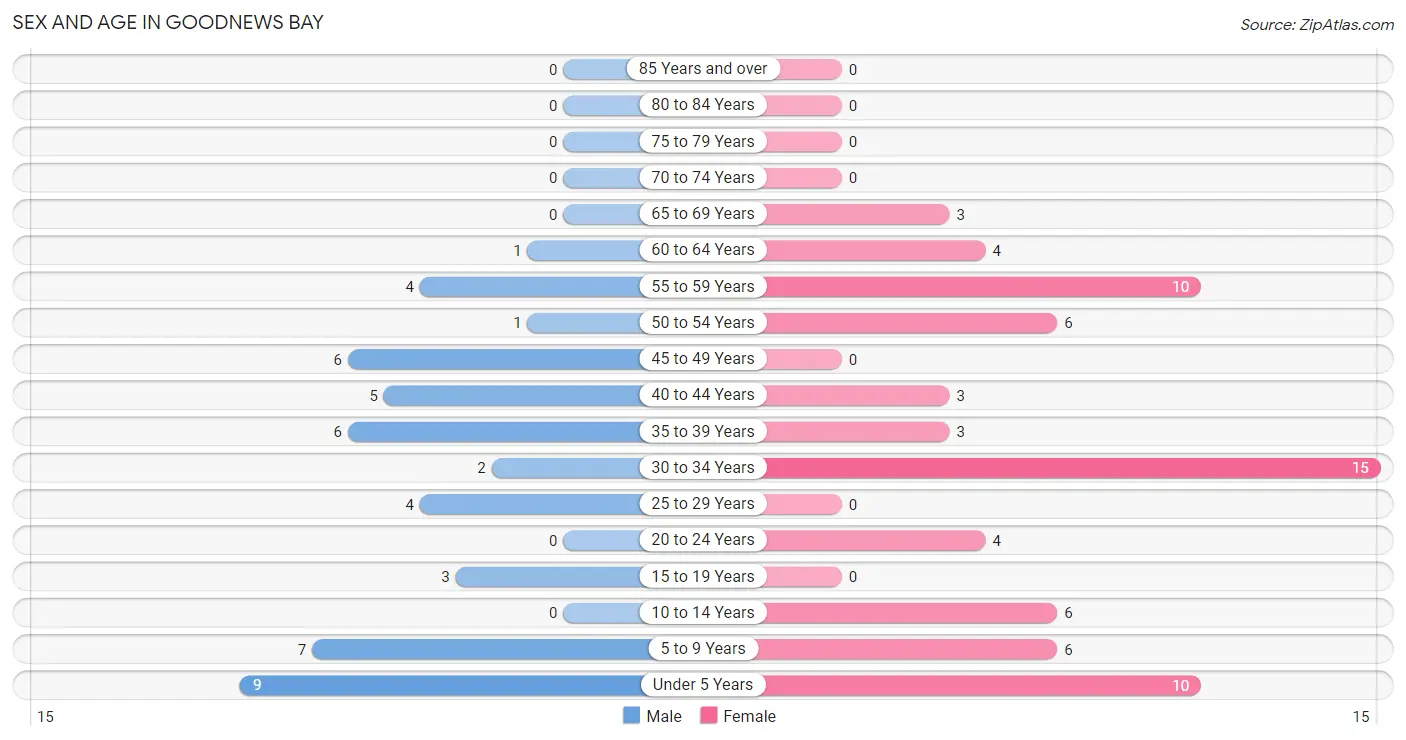
Sex and Age in Goodnews Bay
Sex and Age in Goodnews Bay
The most populous age groups in Goodnews Bay are Under 5 Years (9 | 18.8%) for men and 30 to 34 Years (15 | 21.4%) for women.
| Age Bracket | Male | Female |
| Under 5 Years | 9 (18.8%) | 10 (14.3%) |
| 5 to 9 Years | 7 (14.6%) | 6 (8.6%) |
| 10 to 14 Years | 0 (0.0%) | 6 (8.6%) |
| 15 to 19 Years | 3 (6.2%) | 0 (0.0%) |
| 20 to 24 Years | 0 (0.0%) | 4 (5.7%) |
| 25 to 29 Years | 4 (8.3%) | 0 (0.0%) |
| 30 to 34 Years | 2 (4.2%) | 15 (21.4%) |
| 35 to 39 Years | 6 (12.5%) | 3 (4.3%) |
| 40 to 44 Years | 5 (10.4%) | 3 (4.3%) |
| 45 to 49 Years | 6 (12.5%) | 0 (0.0%) |
| 50 to 54 Years | 1 (2.1%) | 6 (8.6%) |
| 55 to 59 Years | 4 (8.3%) | 10 (14.3%) |
| 60 to 64 Years | 1 (2.1%) | 4 (5.7%) |
| 65 to 69 Years | 0 (0.0%) | 3 (4.3%) |
| 70 to 74 Years | 0 (0.0%) | 0 (0.0%) |
| 75 to 79 Years | 0 (0.0%) | 0 (0.0%) |
| 80 to 84 Years | 0 (0.0%) | 0 (0.0%) |
| 85 Years and over | 0 (0.0%) | 0 (0.0%) |
| Total | 48 (100.0%) | 70 (100.0%) |
Families and Households in Goodnews Bay
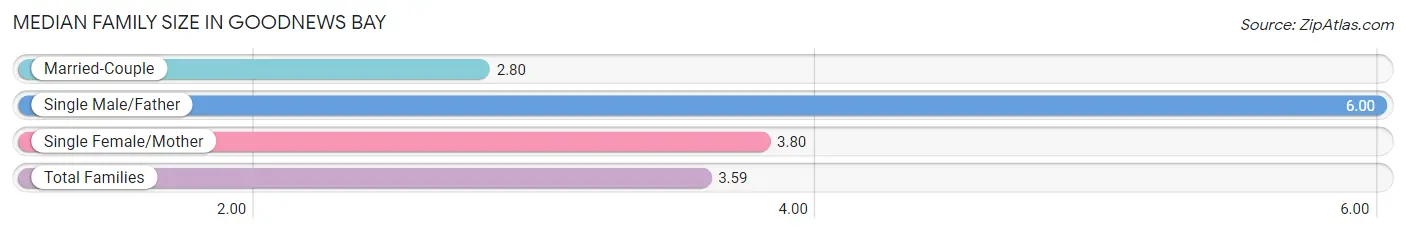
Median Family Size in Goodnews Bay
The median family size in Goodnews Bay is 3.59 persons per family, with single male/father families (2 | 7.4%) accounting for the largest median family size of 6 persons per family. On the other hand, married-couple families (10 | 37.0%) represent the smallest median family size with 2.80 persons per family.
| Family Type | # Families | Family Size |
| Married-Couple | 10 (37.0%) | 2.80 |
| Single Male/Father | 2 (7.4%) | 6.00 |
| Single Female/Mother | 15 (55.6%) | 3.80 |
| Total Families | 27 (100.0%) | 3.59 |
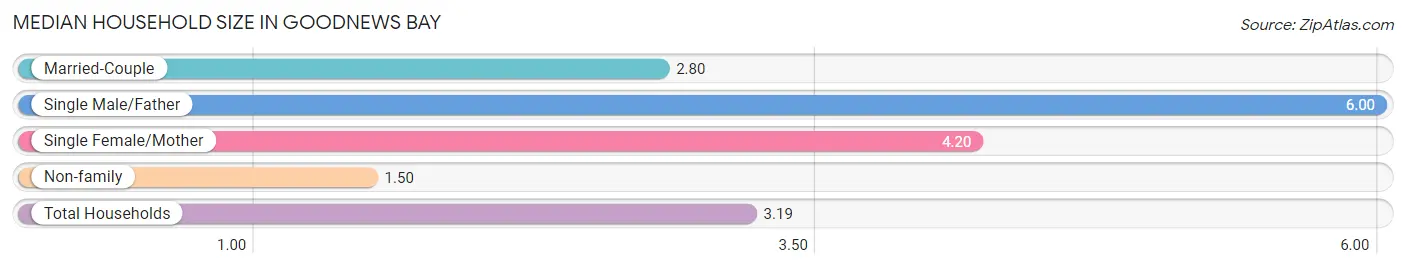
Median Household Size in Goodnews Bay
The median household size in Goodnews Bay is 3.19 persons per household, with single male/father households (2 | 5.4%) accounting for the largest median household size of 6 persons per household. non-family households (10 | 27.0%) represent the smallest median household size with 1.50 persons per household.
| Household Type | # Households | Household Size |
| Married-Couple | 10 (27.0%) | 2.80 |
| Single Male/Father | 2 (5.4%) | 6.00 |
| Single Female/Mother | 15 (40.5%) | 4.20 |
| Non-family | 10 (27.0%) | 1.50 |
| Total Households | 37 (100.0%) | 3.19 |
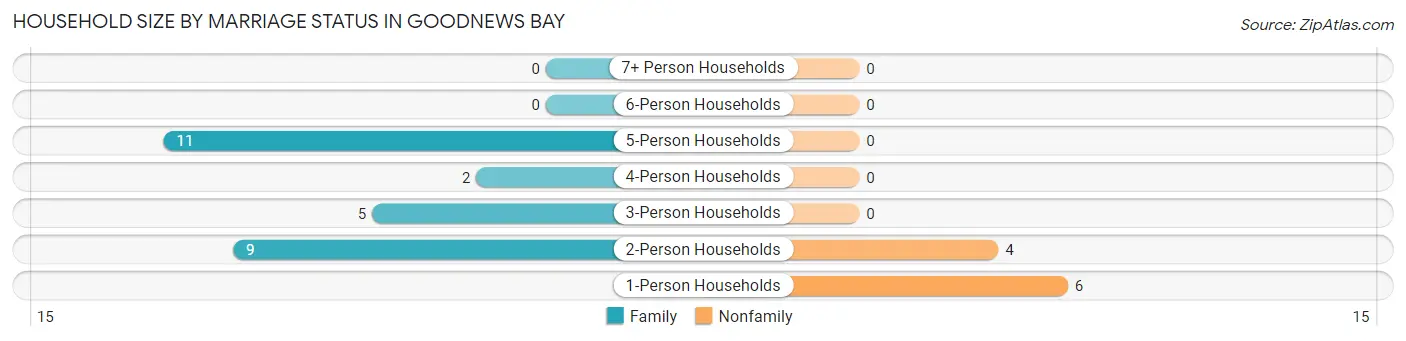
Household Size by Marriage Status in Goodnews Bay
Out of a total of 37 households in Goodnews Bay, 27 (73.0%) are family households, while 10 (27.0%) are nonfamily households. The most numerous type of family households are 5-person households, comprising 11, and the most common type of nonfamily households are 1-person households, comprising 6.
| Household Size | Family Households | Nonfamily Households |
| 1-Person Households | - | 6 (16.2%) |
| 2-Person Households | 9 (24.3%) | 4 (10.8%) |
| 3-Person Households | 5 (13.5%) | 0 (0.0%) |
| 4-Person Households | 2 (5.4%) | 0 (0.0%) |
| 5-Person Households | 11 (29.7%) | 0 (0.0%) |
| 6-Person Households | 0 (0.0%) | 0 (0.0%) |
| 7+ Person Households | 0 (0.0%) | 0 (0.0%) |
| Total | 27 (73.0%) | 10 (27.0%) |
Female Fertility in Goodnews Bay
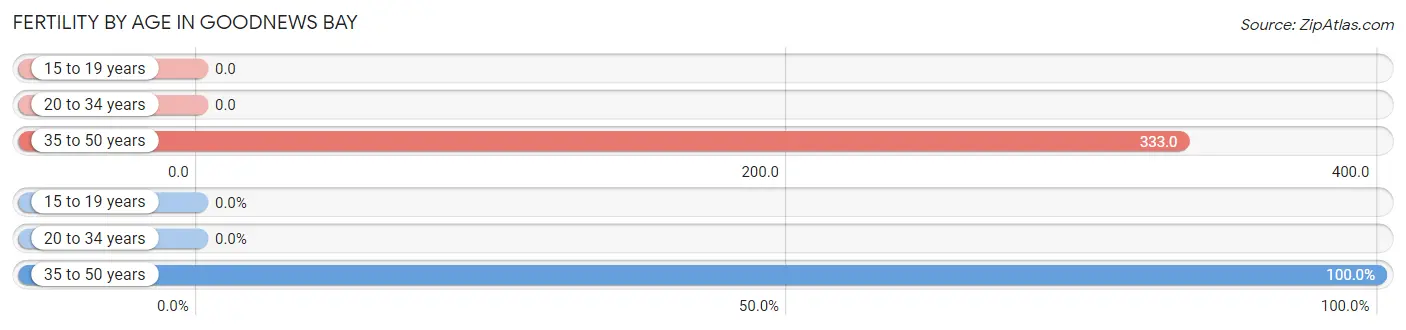
Fertility by Age in Goodnews Bay
Average fertility rate in Goodnews Bay is 107.0 births per 1,000 women. Women in the age bracket of 35 to 50 years have the highest fertility rate with 333.0 births per 1,000 women. Women in the age bracket of 35 to 50 years acount for 100.0% of all women with births.
| Age Bracket | Women with Births | Births / 1,000 Women |
| 15 to 19 years | 0 (0.0%) | 0.0 |
| 20 to 34 years | 0 (0.0%) | 0.0 |
| 35 to 50 years | 3 (100.0%) | 333.0 |
| Total | 3 (100.0%) | 107.0 |
Fertility by Age by Marriage Status in Goodnews Bay
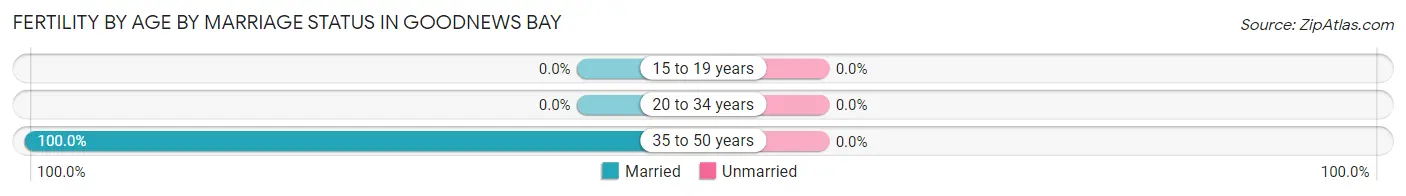
| Age Bracket | Married | Unmarried |
| 15 to 19 years | 0 (0.0%) | 0 (0.0%) |
| 20 to 34 years | 0 (0.0%) | 0 (0.0%) |
| 35 to 50 years | 3 (100.0%) | 0 (0.0%) |
| Total | 3 (100.0%) | 0 (0.0%) |
Fertility by Education in Goodnews Bay
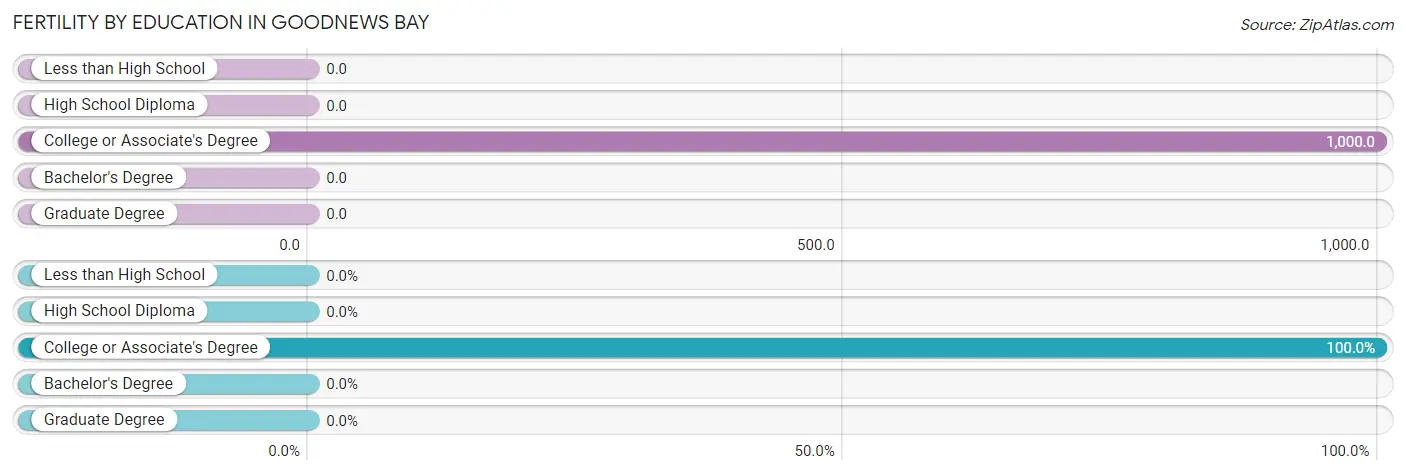
| Educational Attainment | Women with Births | Births / 1,000 Women |
| Less than High School | 0 (0.0%) | 0.0 |
| High School Diploma | 0 (0.0%) | 0.0 |
| College or Associate's Degree | 3 (100.0%) | 1,000.0 |
| Bachelor's Degree | 0 (0.0%) | 0.0 |
| Graduate Degree | 0 (0.0%) | 0.0 |
| Total | 3 (100.0%) | 107.0 |
Fertility by Education by Marriage Status in Goodnews Bay
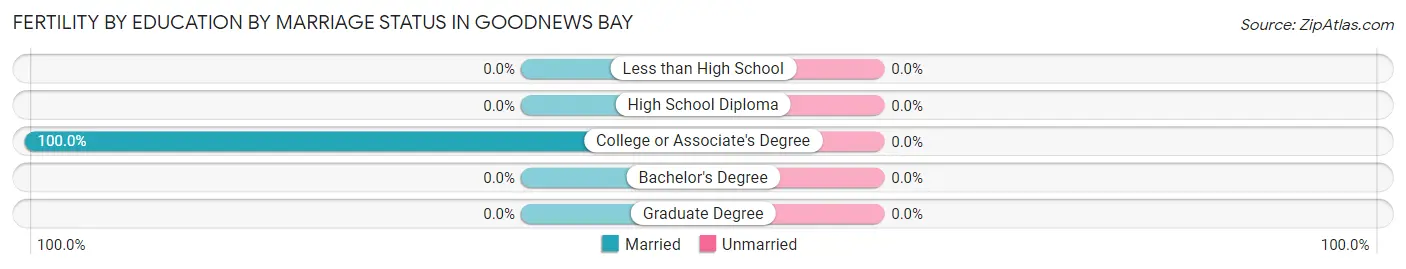
| Educational Attainment | Married | Unmarried |
| Less than High School | 0 (0.0%) | 0 (0.0%) |
| High School Diploma | 0 (0.0%) | 0 (0.0%) |
| College or Associate's Degree | 3 (100.0%) | 0 (0.0%) |
| Bachelor's Degree | 0 (0.0%) | 0 (0.0%) |
| Graduate Degree | 0 (0.0%) | 0 (0.0%) |
| Total | 3 (100.0%) | 0 (0.0%) |
Employment Characteristics in Goodnews Bay
Employment by Class of Employer in Goodnews Bay
Among the 46 employed individuals in Goodnews Bay, local government employees (22 | 47.8%), federal government employees (12 | 26.1%), and state government employees (8 | 17.4%) make up the most common classes of employment.
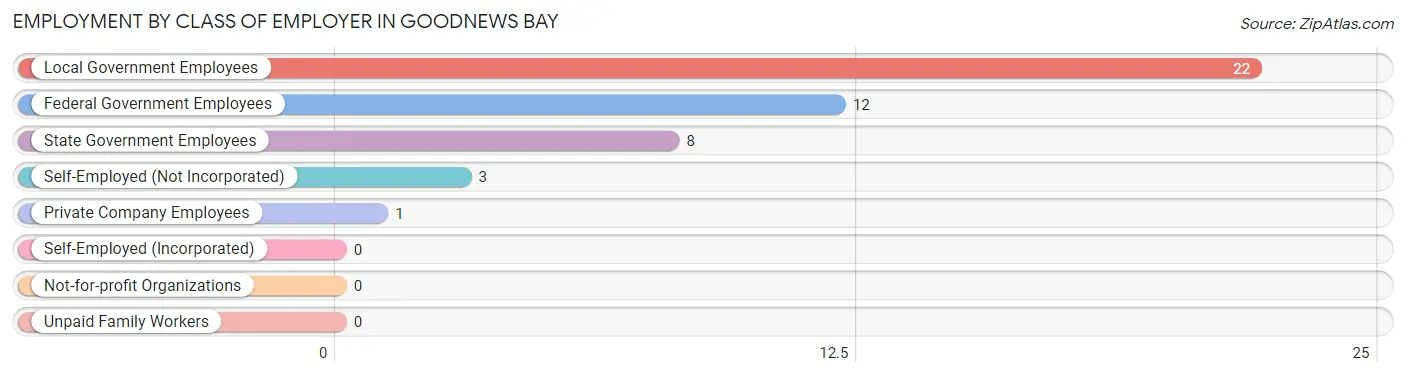
| Employer Class | # Employees | % Employees |
| Private Company Employees | 1 | 2.2% |
| Self-Employed (Incorporated) | 0 | 0.0% |
| Self-Employed (Not Incorporated) | 3 | 6.5% |
| Not-for-profit Organizations | 0 | 0.0% |
| Local Government Employees | 22 | 47.8% |
| State Government Employees | 8 | 17.4% |
| Federal Government Employees | 12 | 26.1% |
| Unpaid Family Workers | 0 | 0.0% |
| Total | 46 | 100.0% |
Employment Status by Age in Goodnews Bay
According to the labor force statistics for Goodnews Bay, out of the total population over 16 years of age (80), 61.3% or 49 individuals are in the labor force, with 6.1% or 3 of them unemployed. The age group with the highest labor force participation rate is 25 to 29 years, with 100.0% or 4 individuals in the labor force. Within the labor force, the 30 to 34 years age range has the highest percentage of unemployed individuals, with 23.1% or 3 of them being unemployed.
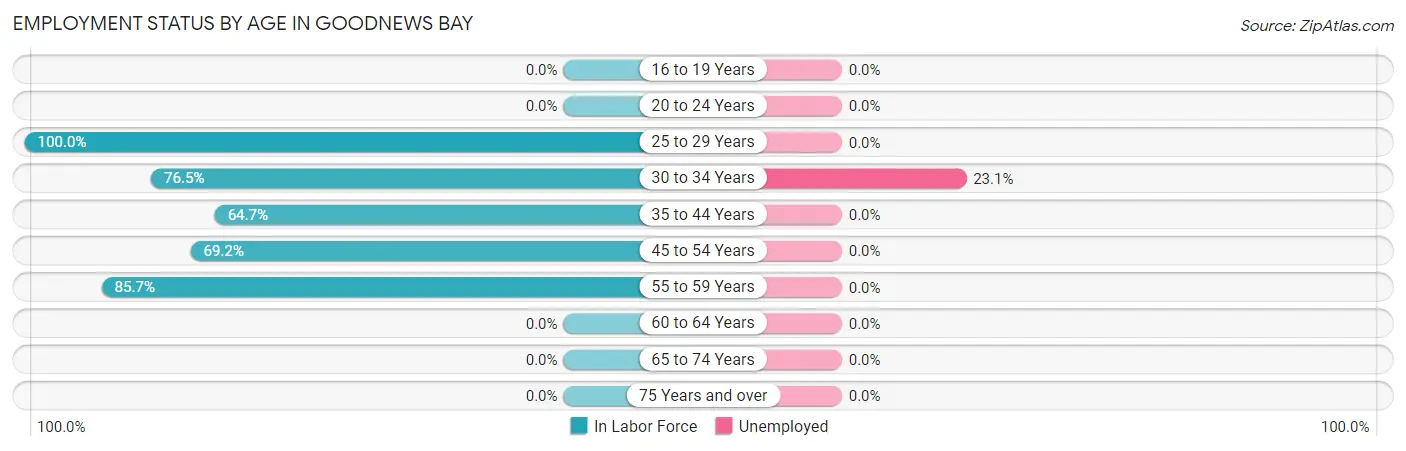
| Age Bracket | In Labor Force | Unemployed |
| 16 to 19 Years | 0 (0.0%) | 0 (0.0%) |
| 20 to 24 Years | 0 (0.0%) | 0 (0.0%) |
| 25 to 29 Years | 4 (100.0%) | 0 (0.0%) |
| 30 to 34 Years | 13 (76.5%) | 3 (23.1%) |
| 35 to 44 Years | 11 (64.7%) | 0 (0.0%) |
| 45 to 54 Years | 9 (69.2%) | 0 (0.0%) |
| 55 to 59 Years | 12 (85.7%) | 0 (0.0%) |
| 60 to 64 Years | 0 (0.0%) | 0 (0.0%) |
| 65 to 74 Years | 0 (0.0%) | 0 (0.0%) |
| 75 Years and over | 0 (0.0%) | 0 (0.0%) |
| Total | 49 (61.3%) | 3 (6.1%) |
Employment Status by Educational Attainment in Goodnews Bay
According to labor force statistics for Goodnews Bay, 70.0% of individuals (49) out of the total population between 25 and 64 years of age (70) are in the labor force, with 6.1% or 3 of them being unemployed. The group with the highest labor force participation rate are those with the educational attainment of college / associate degree, with 84.6% or 11 individuals in the labor force. Within the labor force, individuals with less than high school education have the highest percentage of unemployment, with 27.3% or 3 of them being unemployed.
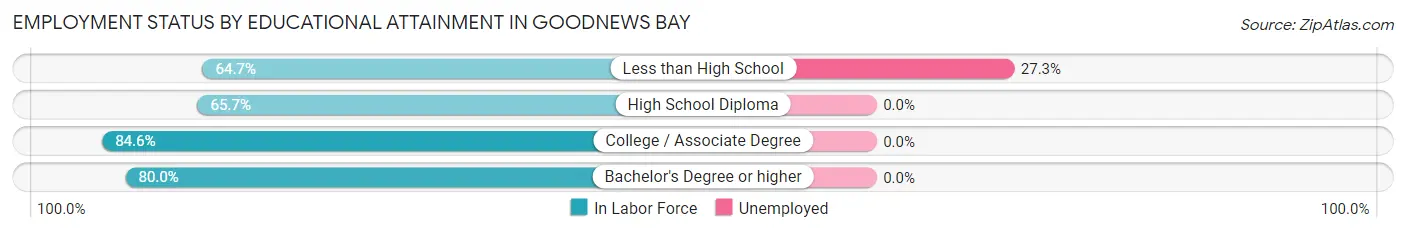
| Educational Attainment | In Labor Force | Unemployed |
| Less than High School | 11 (64.7%) | 5 (27.3%) |
| High School Diploma | 23 (65.7%) | 0 (0.0%) |
| College / Associate Degree | 11 (84.6%) | 0 (0.0%) |
| Bachelor's Degree or higher | 4 (80.0%) | 0 (0.0%) |
| Total | 49 (70.0%) | 4 (6.1%) |
Employment Occupations by Sex in Goodnews Bay
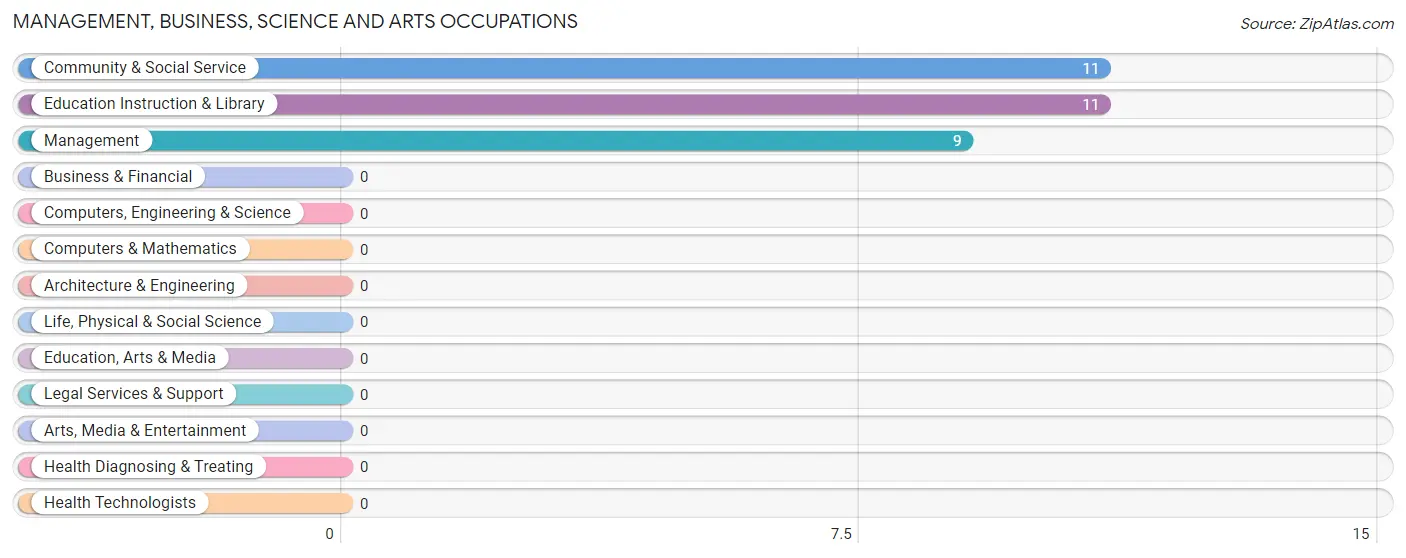
Management, Business, Science and Arts Occupations
The most common Management, Business, Science and Arts occupations in Goodnews Bay are Community & Social Service (11 | 23.9%), Education Instruction & Library (11 | 23.9%), and Management (9 | 19.6%).
Management, Business, Science and Arts Occupations by Sex
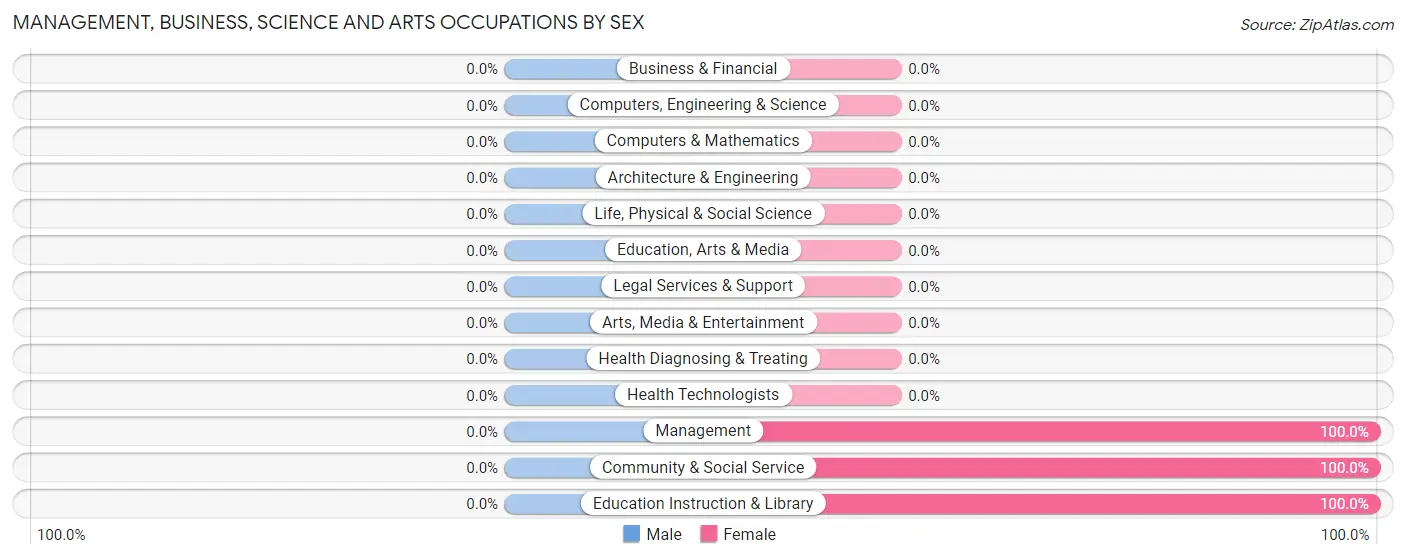
| Occupation | Male | Female |
| Management | 0 (0.0%) | 9 (100.0%) |
| Business & Financial | 0 (0.0%) | 0 (0.0%) |
| Computers, Engineering & Science | 0 (0.0%) | 0 (0.0%) |
| Computers & Mathematics | 0 (0.0%) | 0 (0.0%) |
| Architecture & Engineering | 0 (0.0%) | 0 (0.0%) |
| Life, Physical & Social Science | 0 (0.0%) | 0 (0.0%) |
| Community & Social Service | 0 (0.0%) | 11 (100.0%) |
| Education, Arts & Media | 0 (0.0%) | 0 (0.0%) |
| Legal Services & Support | 0 (0.0%) | 0 (0.0%) |
| Education Instruction & Library | 0 (0.0%) | 11 (100.0%) |
| Arts, Media & Entertainment | 0 (0.0%) | 0 (0.0%) |
| Health Diagnosing & Treating | 0 (0.0%) | 0 (0.0%) |
| Health Technologists | 0 (0.0%) | 0 (0.0%) |
| Total (Category) | 0 (0.0%) | 20 (100.0%) |
| Total (Overall) | 21 (45.7%) | 25 (54.3%) |
Services Occupations
The most common Services occupations in Goodnews Bay are Food Preparation & Serving (3 | 6.5%), and Personal Care & Service (2 | 4.3%).
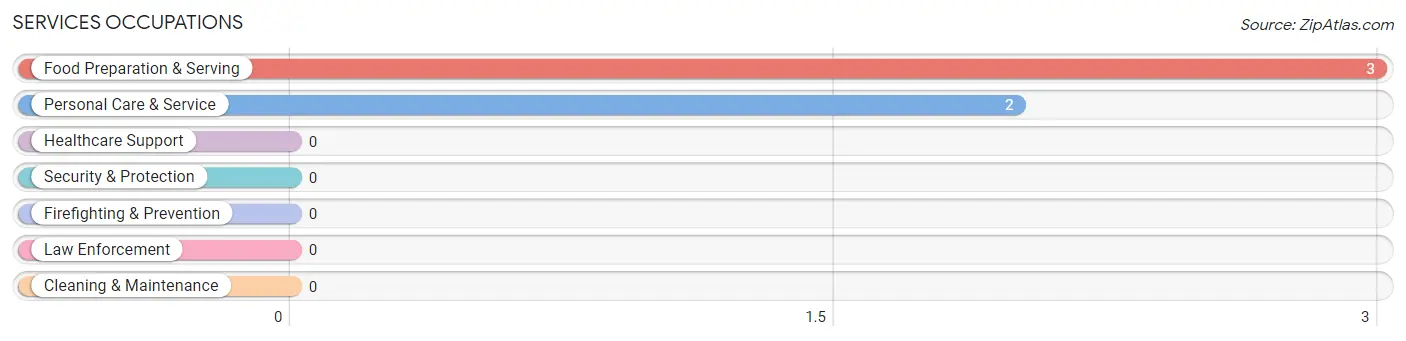
Services Occupations by Sex
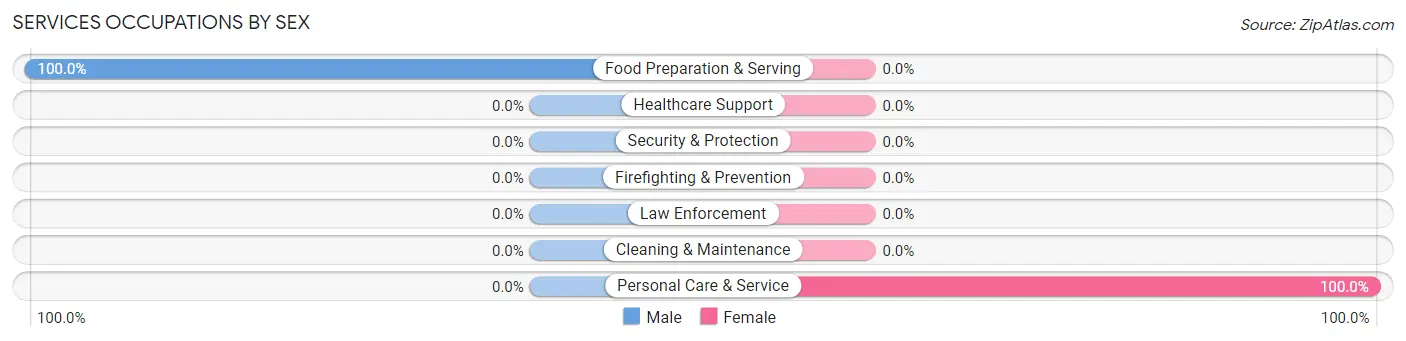
| Occupation | Male | Female |
| Healthcare Support | 0 (0.0%) | 0 (0.0%) |
| Security & Protection | 0 (0.0%) | 0 (0.0%) |
| Firefighting & Prevention | 0 (0.0%) | 0 (0.0%) |
| Law Enforcement | 0 (0.0%) | 0 (0.0%) |
| Food Preparation & Serving | 3 (100.0%) | 0 (0.0%) |
| Cleaning & Maintenance | 0 (0.0%) | 0 (0.0%) |
| Personal Care & Service | 0 (0.0%) | 2 (100.0%) |
| Total (Category) | 3 (60.0%) | 2 (40.0%) |
| Total (Overall) | 21 (45.7%) | 25 (54.3%) |
Sales and Office Occupations
The most common Sales and Office occupations in Goodnews Bay are Sales & Related (3 | 6.5%), and Office & Administration (3 | 6.5%).
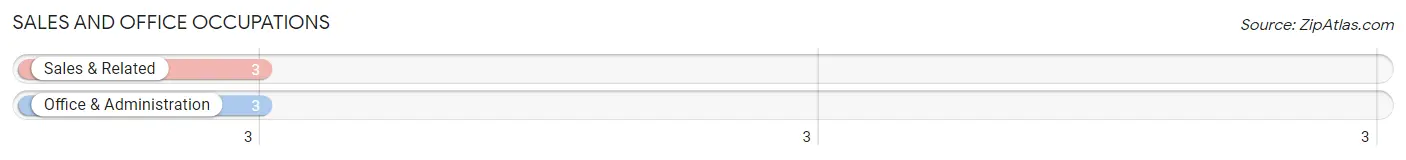
Sales and Office Occupations by Sex
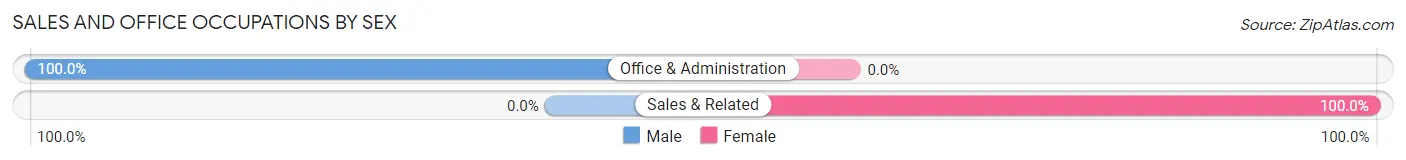
| Occupation | Male | Female |
| Sales & Related | 0 (0.0%) | 3 (100.0%) |
| Office & Administration | 3 (100.0%) | 0 (0.0%) |
| Total (Category) | 3 (50.0%) | 3 (50.0%) |
| Total (Overall) | 21 (45.7%) | 25 (54.3%) |
Natural Resources, Construction and Maintenance Occupations
The most common Natural Resources, Construction and Maintenance occupations in Goodnews Bay are Construction & Extraction (6 | 13.0%), and Installation, Maintenance & Repair (5 | 10.9%).
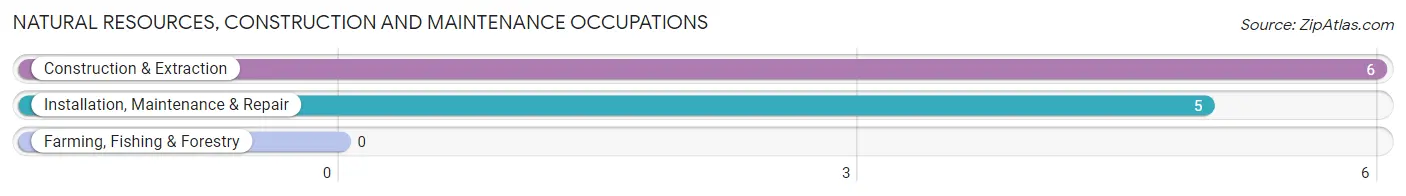
Natural Resources, Construction and Maintenance Occupations by Sex
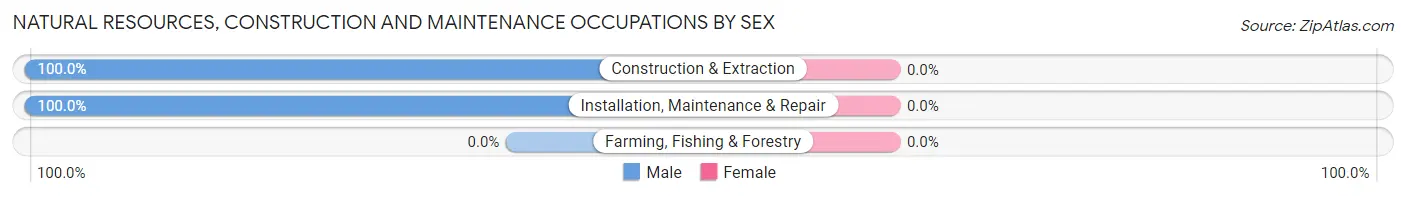
| Occupation | Male | Female |
| Farming, Fishing & Forestry | 0 (0.0%) | 0 (0.0%) |
| Construction & Extraction | 6 (100.0%) | 0 (0.0%) |
| Installation, Maintenance & Repair | 5 (100.0%) | 0 (0.0%) |
| Total (Category) | 11 (100.0%) | 0 (0.0%) |
| Total (Overall) | 21 (45.7%) | 25 (54.3%) |
Production, Transportation and Moving Occupations
The most common Production, Transportation and Moving occupations in Goodnews Bay are , and Material Moving (4 | 8.7%).
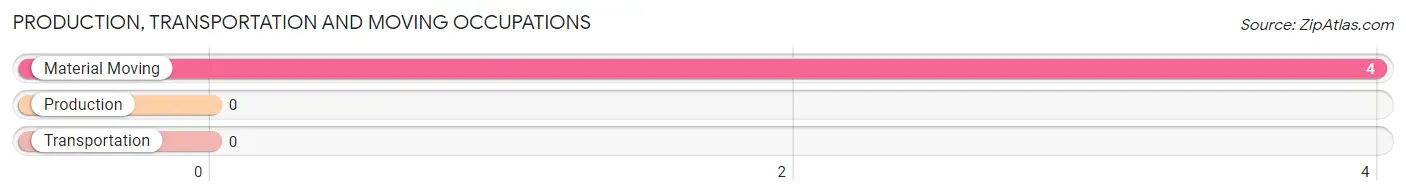
Production, Transportation and Moving Occupations by Sex
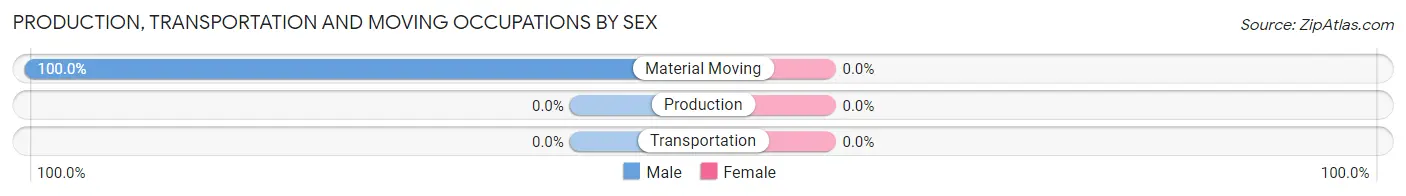
| Occupation | Male | Female |
| Production | 0 (0.0%) | 0 (0.0%) |
| Transportation | 0 (0.0%) | 0 (0.0%) |
| Material Moving | 4 (100.0%) | 0 (0.0%) |
| Total (Category) | 4 (100.0%) | 0 (0.0%) |
| Total (Overall) | 21 (45.7%) | 25 (54.3%) |
Employment Industries by Sex in Goodnews Bay
Employment Industries in Goodnews Bay
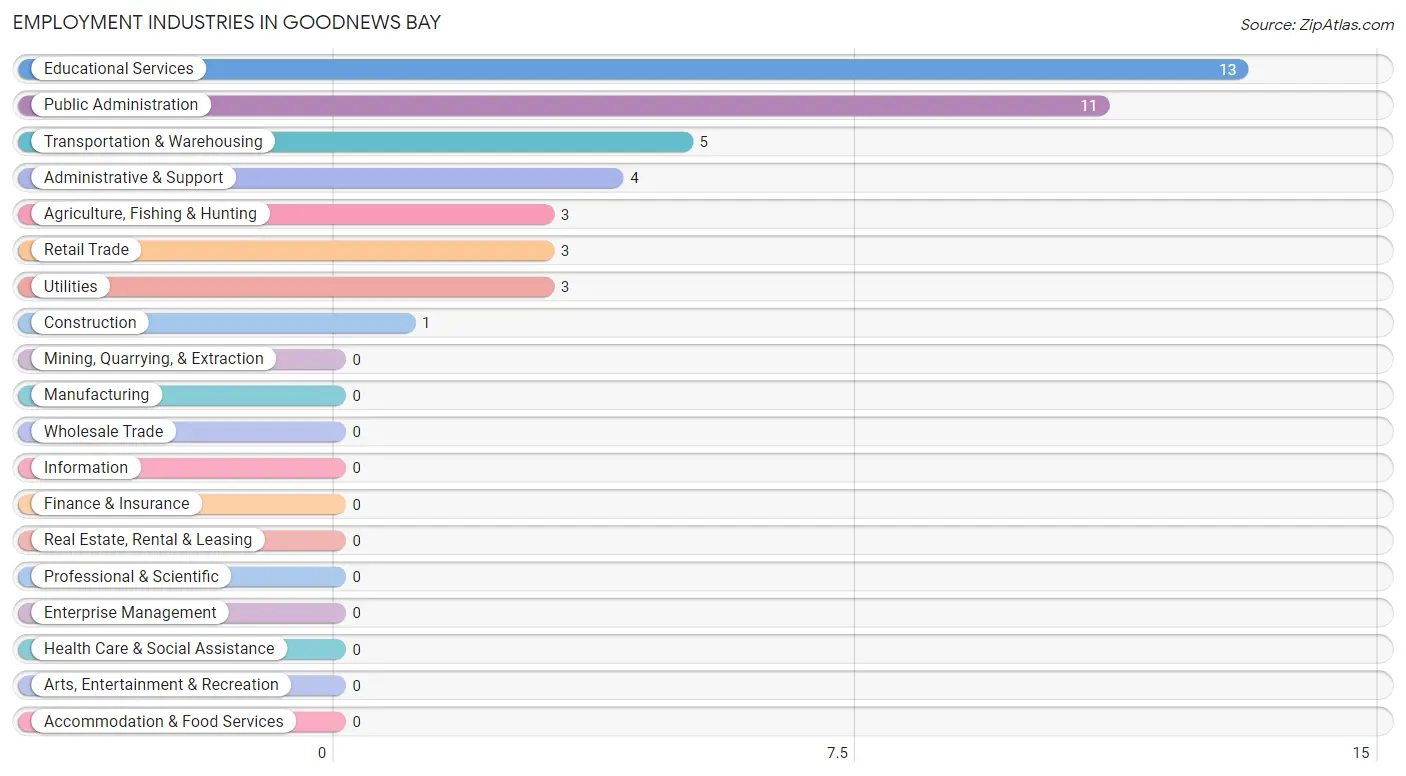
The major employment industries in Goodnews Bay include Educational Services (13 | 28.3%), Public Administration (11 | 23.9%), Transportation & Warehousing (5 | 10.9%), Administrative & Support (4 | 8.7%), and Agriculture, Fishing & Hunting (3 | 6.5%).
Employment Industries by Sex in Goodnews Bay
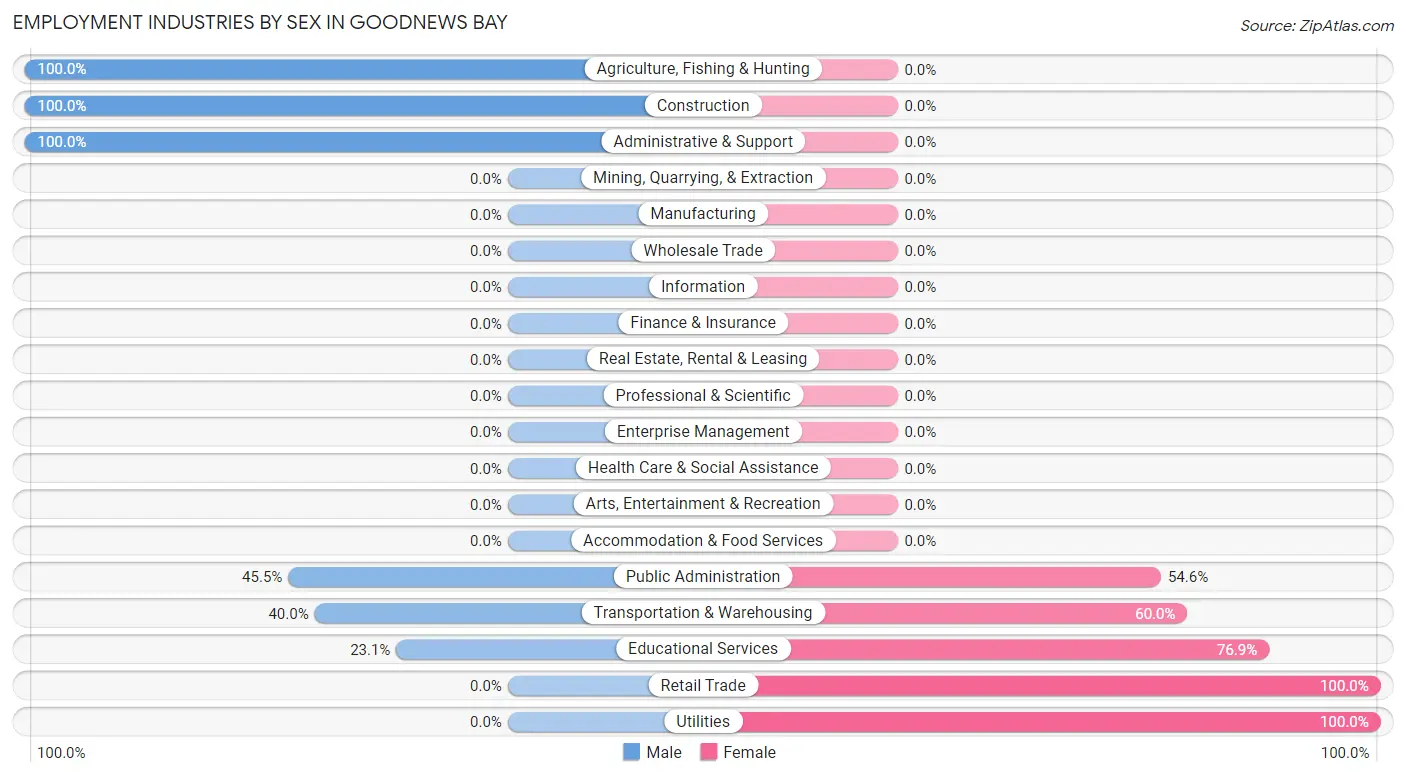
The Goodnews Bay industries that see more men than women are Agriculture, Fishing & Hunting (100.0%), Construction (100.0%), and Administrative & Support (100.0%), whereas the industries that tend to have a higher number of women are Retail Trade (100.0%), Utilities (100.0%), and Educational Services (76.9%).
| Industry | Male | Female |
| Agriculture, Fishing & Hunting | 3 (100.0%) | 0 (0.0%) |
| Mining, Quarrying, & Extraction | 0 (0.0%) | 0 (0.0%) |
| Construction | 1 (100.0%) | 0 (0.0%) |
| Manufacturing | 0 (0.0%) | 0 (0.0%) |
| Wholesale Trade | 0 (0.0%) | 0 (0.0%) |
| Retail Trade | 0 (0.0%) | 3 (100.0%) |
| Transportation & Warehousing | 2 (40.0%) | 3 (60.0%) |
| Utilities | 0 (0.0%) | 3 (100.0%) |
| Information | 0 (0.0%) | 0 (0.0%) |
| Finance & Insurance | 0 (0.0%) | 0 (0.0%) |
| Real Estate, Rental & Leasing | 0 (0.0%) | 0 (0.0%) |
| Professional & Scientific | 0 (0.0%) | 0 (0.0%) |
| Enterprise Management | 0 (0.0%) | 0 (0.0%) |
| Administrative & Support | 4 (100.0%) | 0 (0.0%) |
| Educational Services | 3 (23.1%) | 10 (76.9%) |
| Health Care & Social Assistance | 0 (0.0%) | 0 (0.0%) |
| Arts, Entertainment & Recreation | 0 (0.0%) | 0 (0.0%) |
| Accommodation & Food Services | 0 (0.0%) | 0 (0.0%) |
| Public Administration | 5 (45.5%) | 6 (54.5%) |
| Total | 21 (45.7%) | 25 (54.3%) |
Education in Goodnews Bay
School Enrollment in Goodnews Bay
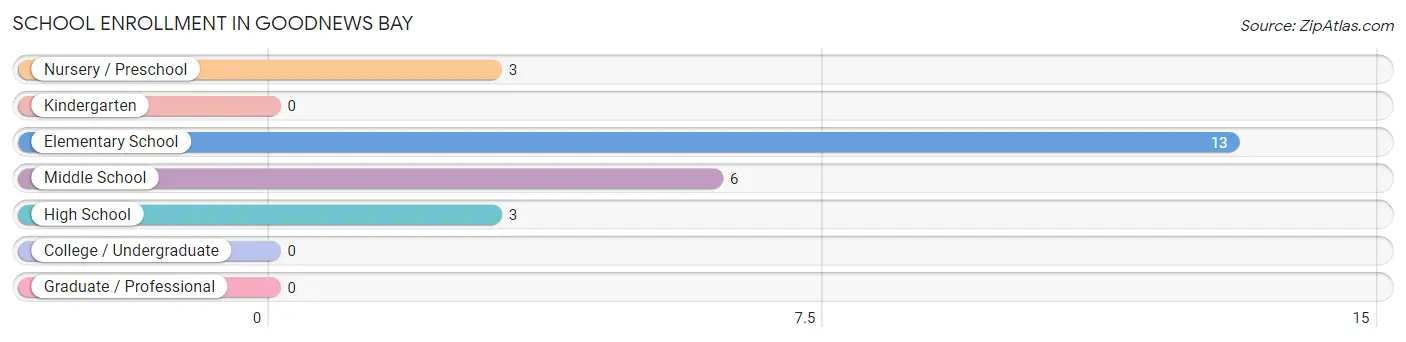
The most common levels of schooling among the 25 students in Goodnews Bay are elementary school (13 | 52.0%), middle school (6 | 24.0%), and nursery / preschool (3 | 12.0%).
| School Level | # Students | % Students |
| Nursery / Preschool | 3 | 12.0% |
| Kindergarten | 0 | 0.0% |
| Elementary School | 13 | 52.0% |
| Middle School | 6 | 24.0% |
| High School | 3 | 12.0% |
| College / Undergraduate | 0 | 0.0% |
| Graduate / Professional | 0 | 0.0% |
| Total | 25 | 100.0% |
School Enrollment by Age by Funding Source in Goodnews Bay
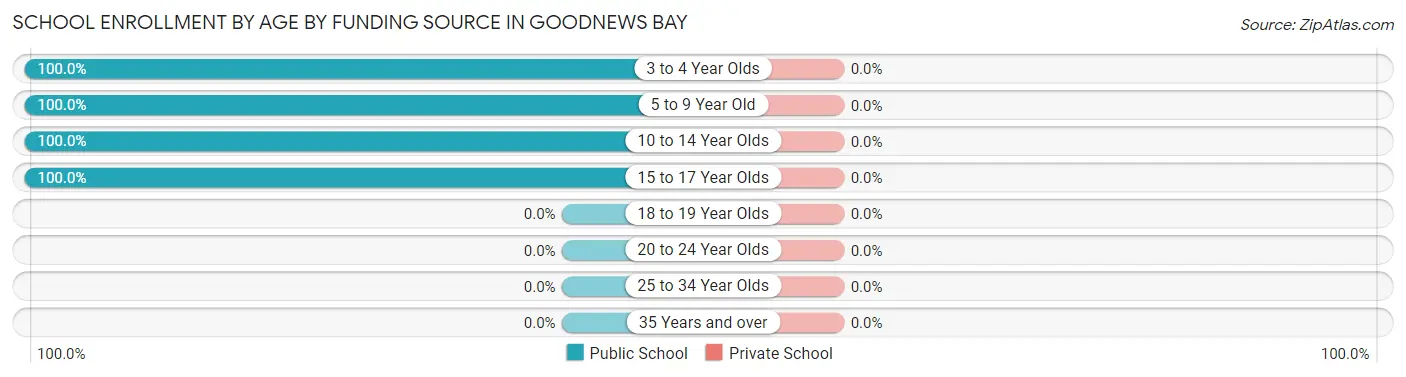
| Age Bracket | Public School | Private School |
| 3 to 4 Year Olds | 3 (100.0%) | 0 (0.0%) |
| 5 to 9 Year Old | 13 (100.0%) | 0 (0.0%) |
| 10 to 14 Year Olds | 6 (100.0%) | 0 (0.0%) |
| 15 to 17 Year Olds | 3 (100.0%) | 0 (0.0%) |
| 18 to 19 Year Olds | 0 (0.0%) | 0 (0.0%) |
| 20 to 24 Year Olds | 0 (0.0%) | 0 (0.0%) |
| 25 to 34 Year Olds | 0 (0.0%) | 0 (0.0%) |
| 35 Years and over | 0 (0.0%) | 0 (0.0%) |
| Total | 25 (100.0%) | 0 (0.0%) |
Educational Attainment by Field of Study in Goodnews Bay
Education (4 | 80.0%), and bio, nature & agricultural (1 | 20.0%) are the most common fields of study among 5 individuals in Goodnews Bay who have obtained a bachelor's degree or higher.
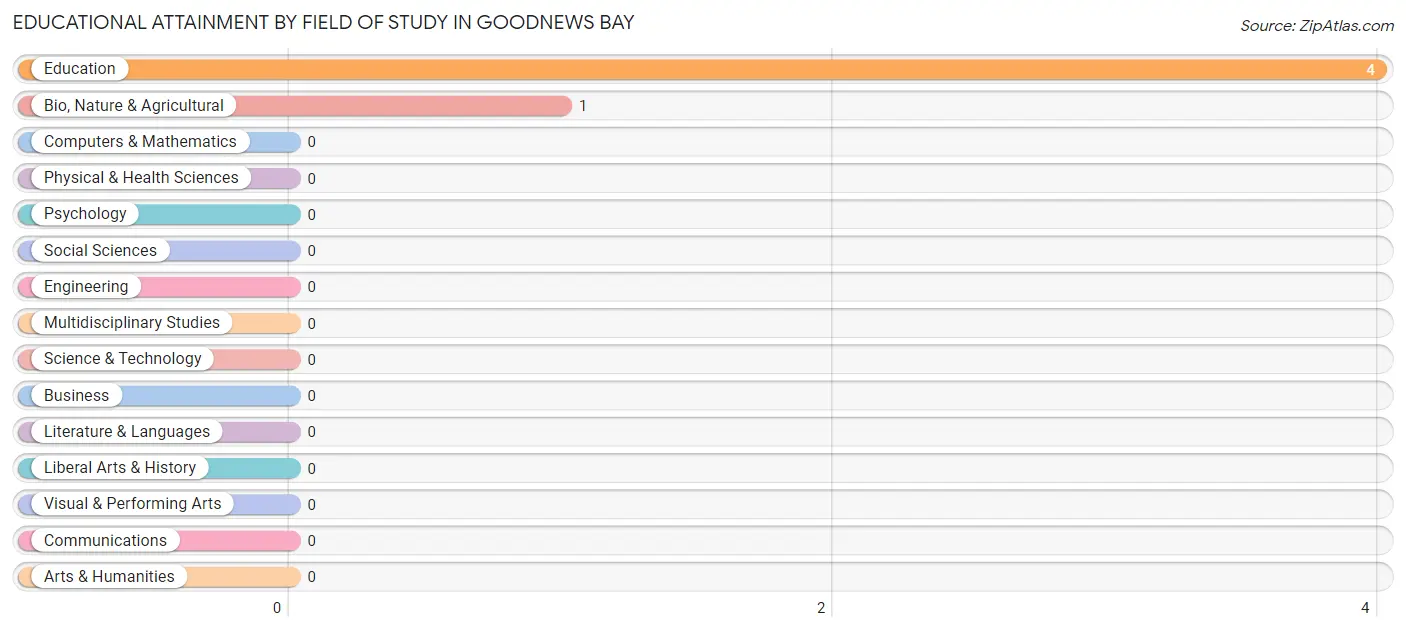
| Field of Study | # Graduates | % Graduates |
| Computers & Mathematics | 0 | 0.0% |
| Bio, Nature & Agricultural | 1 | 20.0% |
| Physical & Health Sciences | 0 | 0.0% |
| Psychology | 0 | 0.0% |
| Social Sciences | 0 | 0.0% |
| Engineering | 0 | 0.0% |
| Multidisciplinary Studies | 0 | 0.0% |
| Science & Technology | 0 | 0.0% |
| Business | 0 | 0.0% |
| Education | 4 | 80.0% |
| Literature & Languages | 0 | 0.0% |
| Liberal Arts & History | 0 | 0.0% |
| Visual & Performing Arts | 0 | 0.0% |
| Communications | 0 | 0.0% |
| Arts & Humanities | 0 | 0.0% |
| Total | 5 | 100.0% |
Transportation & Commute in Goodnews Bay
Vehicle Availability by Sex in Goodnews Bay
The most prevalent vehicle ownership categories in Goodnews Bay are males with no vehicle (20, accounting for 95.2%) and females with no vehicle (22, making up 80.0%).
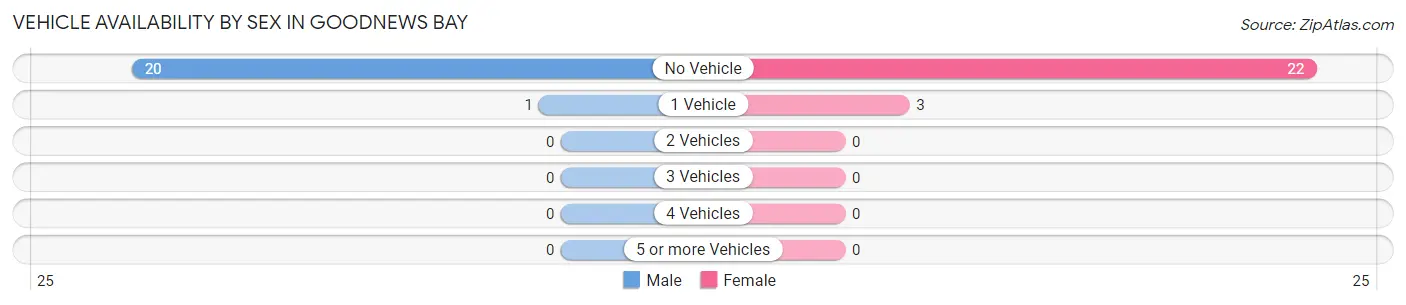
| Vehicles Available | Male | Female |
| No Vehicle | 20 (95.2%) | 22 (88.0%) |
| 1 Vehicle | 1 (4.8%) | 3 (12.0%) |
| 2 Vehicles | 0 (0.0%) | 0 (0.0%) |
| 3 Vehicles | 0 (0.0%) | 0 (0.0%) |
| 4 Vehicles | 0 (0.0%) | 0 (0.0%) |
| 5 or more Vehicles | 0 (0.0%) | 0 (0.0%) |
| Total | 21 (100.0%) | 25 (100.0%) |
Commute Time in Goodnews Bay
The most frequently occuring commute durations in Goodnews Bay are less than 5 minutes (23 commuters, 50.0%), 5 to 9 minutes (20 commuters, 43.5%), and 15 to 19 minutes (3 commuters, 6.5%).
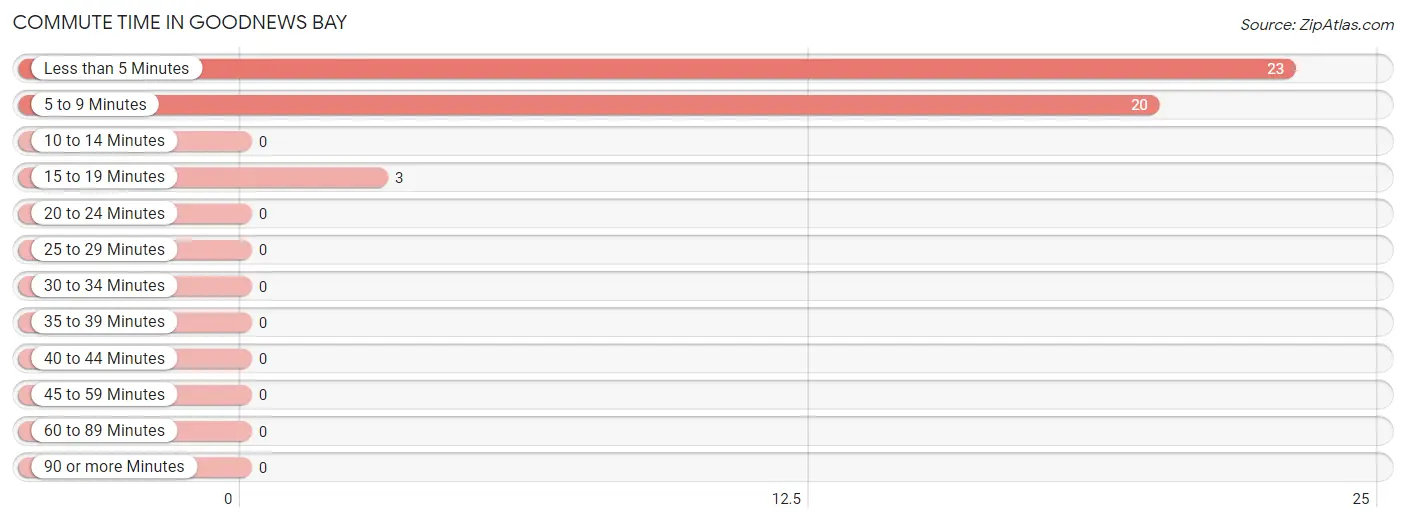
| Commute Time | # Commuters | % Commuters |
| Less than 5 Minutes | 23 | 50.0% |
| 5 to 9 Minutes | 20 | 43.5% |
| 10 to 14 Minutes | 0 | 0.0% |
| 15 to 19 Minutes | 3 | 6.5% |
| 20 to 24 Minutes | 0 | 0.0% |
| 25 to 29 Minutes | 0 | 0.0% |
| 30 to 34 Minutes | 0 | 0.0% |
| 35 to 39 Minutes | 0 | 0.0% |
| 40 to 44 Minutes | 0 | 0.0% |
| 45 to 59 Minutes | 0 | 0.0% |
| 60 to 89 Minutes | 0 | 0.0% |
| 90 or more Minutes | 0 | 0.0% |
Commute Time by Sex in Goodnews Bay
The most common commute times in Goodnews Bay are less than 5 minutes (15 commuters, 71.4%) for males and 5 to 9 minutes (14 commuters, 56.0%) for females.
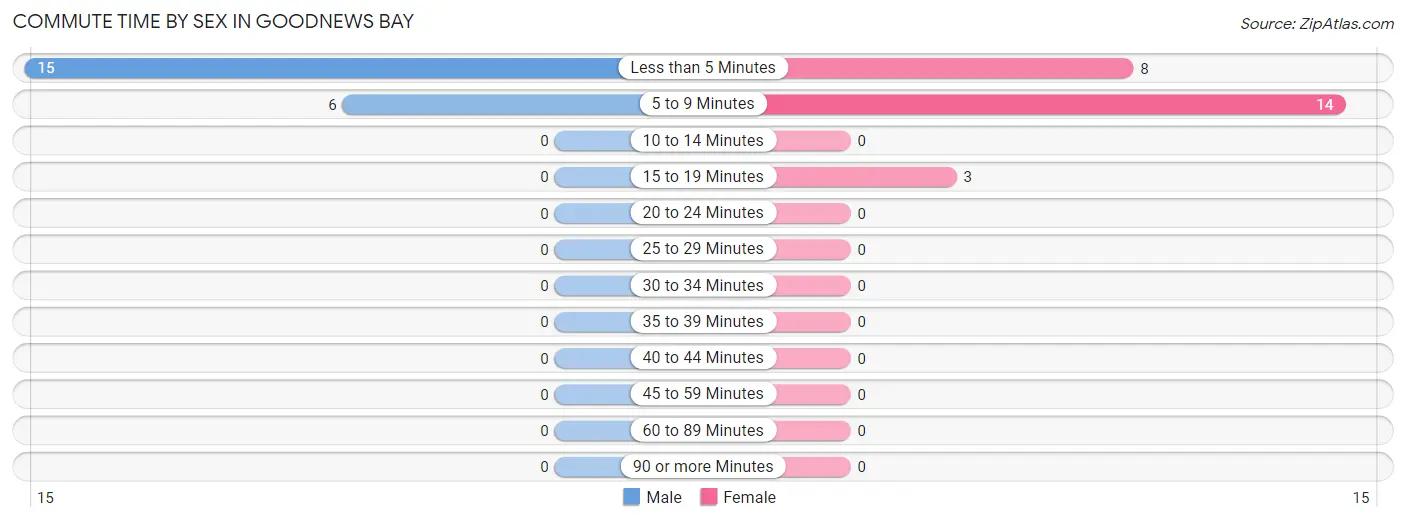
| Commute Time | Male | Female |
| Less than 5 Minutes | 15 (71.4%) | 8 (32.0%) |
| 5 to 9 Minutes | 6 (28.6%) | 14 (56.0%) |
| 10 to 14 Minutes | 0 (0.0%) | 0 (0.0%) |
| 15 to 19 Minutes | 0 (0.0%) | 3 (12.0%) |
| 20 to 24 Minutes | 0 (0.0%) | 0 (0.0%) |
| 25 to 29 Minutes | 0 (0.0%) | 0 (0.0%) |
| 30 to 34 Minutes | 0 (0.0%) | 0 (0.0%) |
| 35 to 39 Minutes | 0 (0.0%) | 0 (0.0%) |
| 40 to 44 Minutes | 0 (0.0%) | 0 (0.0%) |
| 45 to 59 Minutes | 0 (0.0%) | 0 (0.0%) |
| 60 to 89 Minutes | 0 (0.0%) | 0 (0.0%) |
| 90 or more Minutes | 0 (0.0%) | 0 (0.0%) |
Time of Departure to Work by Sex in Goodnews Bay
The most frequent times of departure to work in Goodnews Bay are 8:30 AM to 8:59 AM (8, 38.1%) for males and 8:00 AM to 8:29 AM (10, 40.0%) for females.
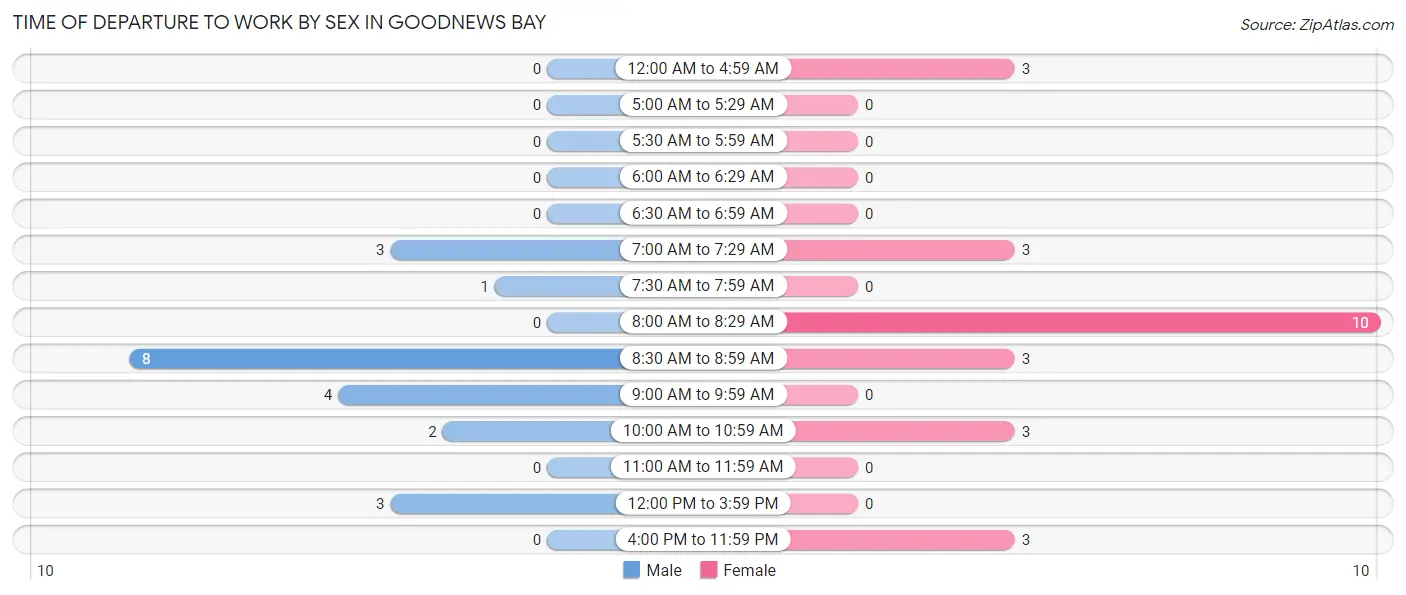
| Time of Departure | Male | Female |
| 12:00 AM to 4:59 AM | 0 (0.0%) | 3 (12.0%) |
| 5:00 AM to 5:29 AM | 0 (0.0%) | 0 (0.0%) |
| 5:30 AM to 5:59 AM | 0 (0.0%) | 0 (0.0%) |
| 6:00 AM to 6:29 AM | 0 (0.0%) | 0 (0.0%) |
| 6:30 AM to 6:59 AM | 0 (0.0%) | 0 (0.0%) |
| 7:00 AM to 7:29 AM | 3 (14.3%) | 3 (12.0%) |
| 7:30 AM to 7:59 AM | 1 (4.8%) | 0 (0.0%) |
| 8:00 AM to 8:29 AM | 0 (0.0%) | 10 (40.0%) |
| 8:30 AM to 8:59 AM | 8 (38.1%) | 3 (12.0%) |
| 9:00 AM to 9:59 AM | 4 (19.1%) | 0 (0.0%) |
| 10:00 AM to 10:59 AM | 2 (9.5%) | 3 (12.0%) |
| 11:00 AM to 11:59 AM | 0 (0.0%) | 0 (0.0%) |
| 12:00 PM to 3:59 PM | 3 (14.3%) | 0 (0.0%) |
| 4:00 PM to 11:59 PM | 0 (0.0%) | 3 (12.0%) |
| Total | 21 (100.0%) | 25 (100.0%) |
Housing Occupancy in Goodnews Bay
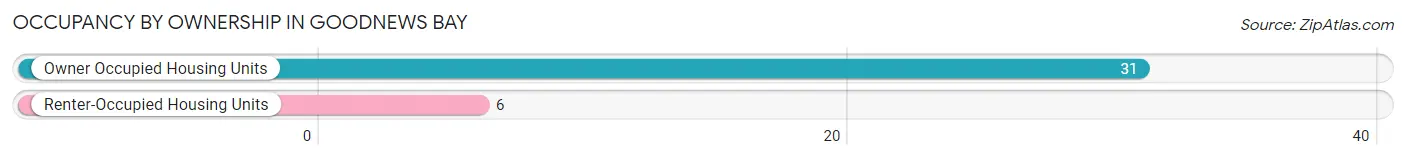
Occupancy by Ownership in Goodnews Bay
Of the total 37 dwellings in Goodnews Bay, owner-occupied units account for 31 (83.8%), while renter-occupied units make up 6 (16.2%).
| Occupancy | # Housing Units | % Housing Units |
| Owner Occupied Housing Units | 31 | 83.8% |
| Renter-Occupied Housing Units | 6 | 16.2% |
| Total Occupied Housing Units | 37 | 100.0% |
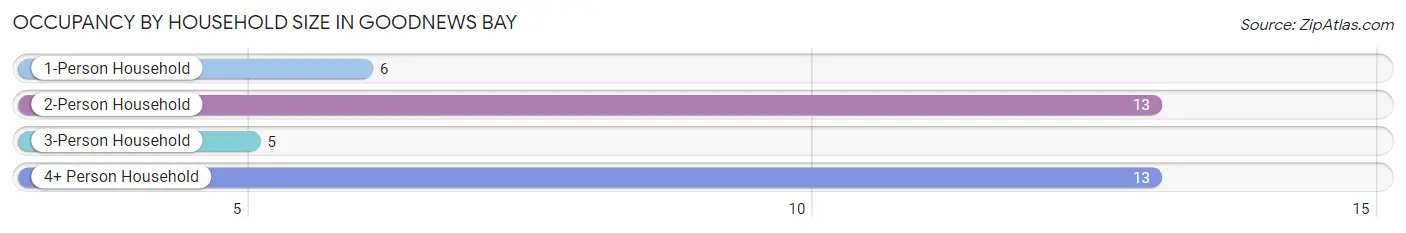
Occupancy by Household Size in Goodnews Bay
| Household Size | # Housing Units | % Housing Units |
| 1-Person Household | 6 | 16.2% |
| 2-Person Household | 13 | 35.1% |
| 3-Person Household | 5 | 13.5% |
| 4+ Person Household | 13 | 35.1% |
| Total Housing Units | 37 | 100.0% |
Occupancy by Ownership by Household Size in Goodnews Bay
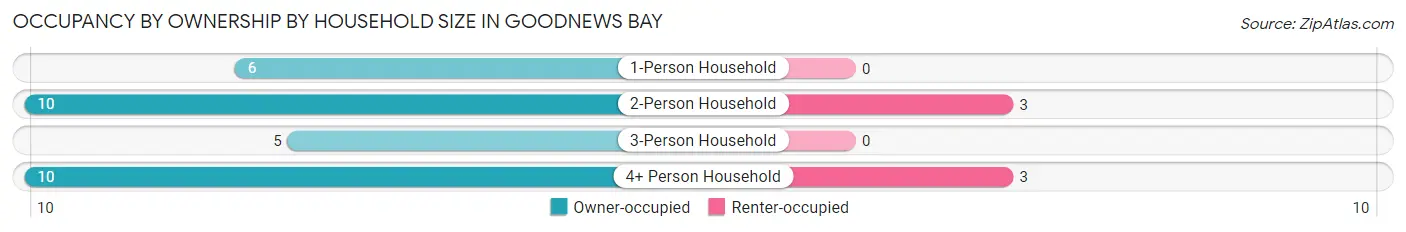
| Household Size | Owner-occupied | Renter-occupied |
| 1-Person Household | 6 (100.0%) | 0 (0.0%) |
| 2-Person Household | 10 (76.9%) | 3 (23.1%) |
| 3-Person Household | 5 (100.0%) | 0 (0.0%) |
| 4+ Person Household | 10 (76.9%) | 3 (23.1%) |
| Total Housing Units | 31 (83.8%) | 6 (16.2%) |
Occupancy by Educational Attainment in Goodnews Bay
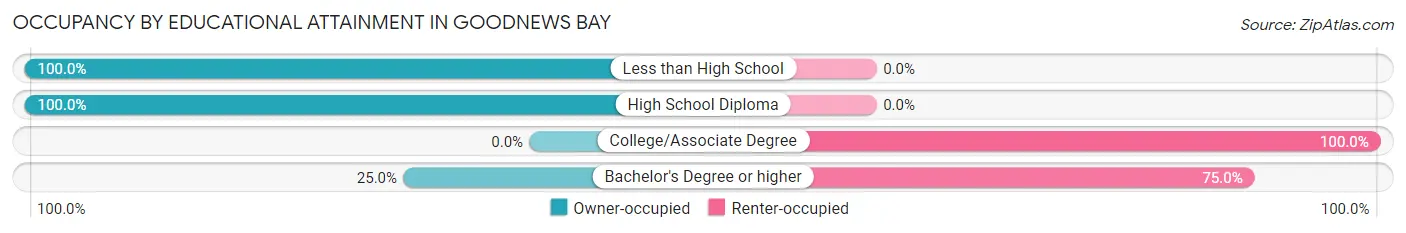
| Household Size | Owner-occupied | Renter-occupied |
| Less than High School | 13 (100.0%) | 0 (0.0%) |
| High School Diploma | 17 (100.0%) | 0 (0.0%) |
| College/Associate Degree | 0 (0.0%) | 3 (100.0%) |
| Bachelor's Degree or higher | 1 (25.0%) | 3 (75.0%) |
Occupancy by Age of Householder in Goodnews Bay
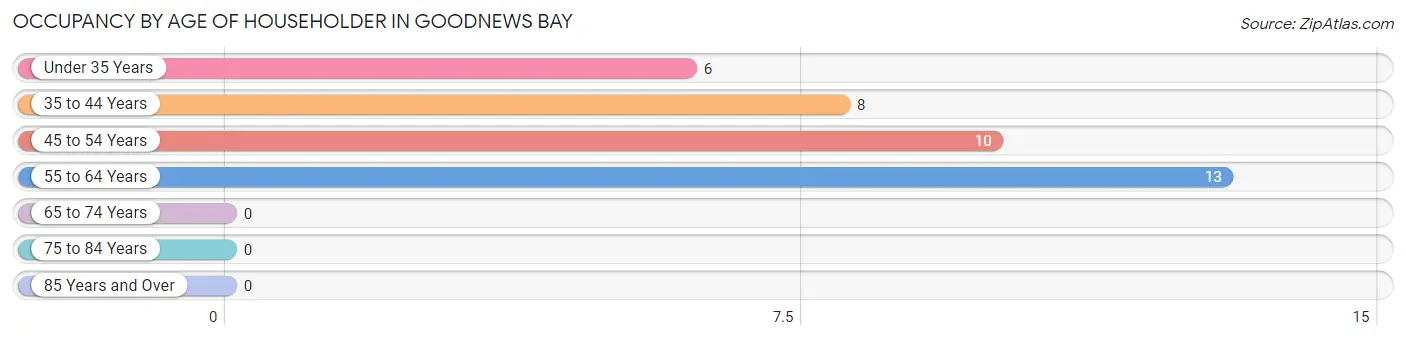
| Age Bracket | # Households | % Households |
| Under 35 Years | 6 | 16.2% |
| 35 to 44 Years | 8 | 21.6% |
| 45 to 54 Years | 10 | 27.0% |
| 55 to 64 Years | 13 | 35.1% |
| 65 to 74 Years | 0 | 0.0% |
| 75 to 84 Years | 0 | 0.0% |
| 85 Years and Over | 0 | 0.0% |
| Total | 37 | 100.0% |
Housing Finances in Goodnews Bay
Median Income by Occupancy in Goodnews Bay
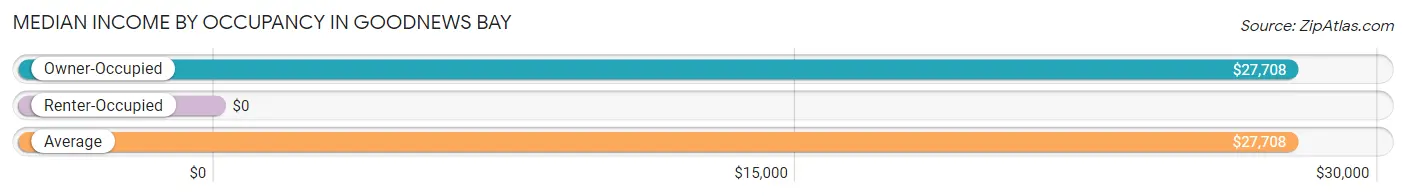
| Occupancy Type | # Households | Median Income |
| Owner-Occupied | 31 (83.8%) | $27,708 |
| Renter-Occupied | 6 (16.2%) | $0 |
| Average | 37 (100.0%) | $27,708 |
Occupancy by Householder Income Bracket in Goodnews Bay
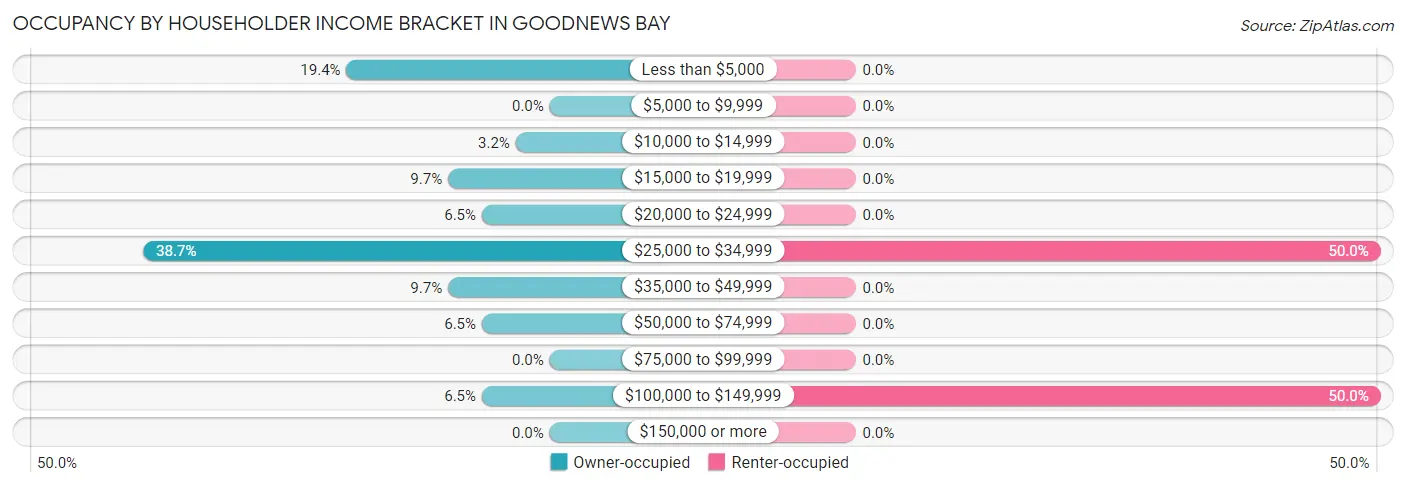
| Income Bracket | Owner-occupied | Renter-occupied |
| Less than $5,000 | 6 (19.4%) | 0 (0.0%) |
| $5,000 to $9,999 | 0 (0.0%) | 0 (0.0%) |
| $10,000 to $14,999 | 1 (3.2%) | 0 (0.0%) |
| $15,000 to $19,999 | 3 (9.7%) | 0 (0.0%) |
| $20,000 to $24,999 | 2 (6.5%) | 0 (0.0%) |
| $25,000 to $34,999 | 12 (38.7%) | 3 (50.0%) |
| $35,000 to $49,999 | 3 (9.7%) | 0 (0.0%) |
| $50,000 to $74,999 | 2 (6.5%) | 0 (0.0%) |
| $75,000 to $99,999 | 0 (0.0%) | 0 (0.0%) |
| $100,000 to $149,999 | 2 (6.5%) | 3 (50.0%) |
| $150,000 or more | 0 (0.0%) | 0 (0.0%) |
| Total | 31 (100.0%) | 6 (100.0%) |
Monthly Housing Cost Tiers in Goodnews Bay
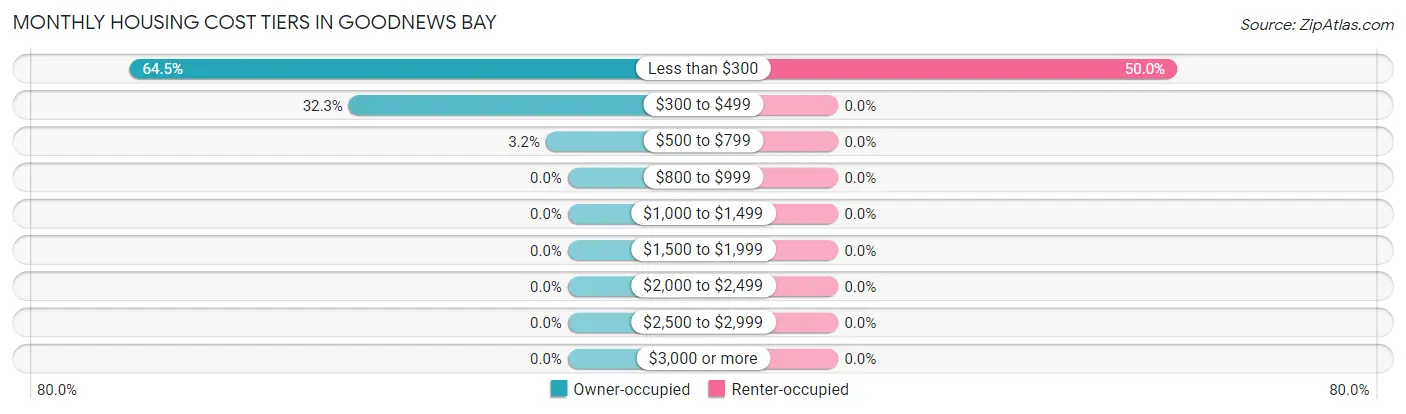
| Monthly Cost | Owner-occupied | Renter-occupied |
| Less than $300 | 20 (64.5%) | 3 (50.0%) |
| $300 to $499 | 10 (32.3%) | 0 (0.0%) |
| $500 to $799 | 1 (3.2%) | 0 (0.0%) |
| $800 to $999 | 0 (0.0%) | 0 (0.0%) |
| $1,000 to $1,499 | 0 (0.0%) | 0 (0.0%) |
| $1,500 to $1,999 | 0 (0.0%) | 0 (0.0%) |
| $2,000 to $2,499 | 0 (0.0%) | 0 (0.0%) |
| $2,500 to $2,999 | 0 (0.0%) | 0 (0.0%) |
| $3,000 or more | 0 (0.0%) | 0 (0.0%) |
| Total | 31 (100.0%) | 6 (100.0%) |
Physical Housing Characteristics in Goodnews Bay
Housing Structures in Goodnews Bay
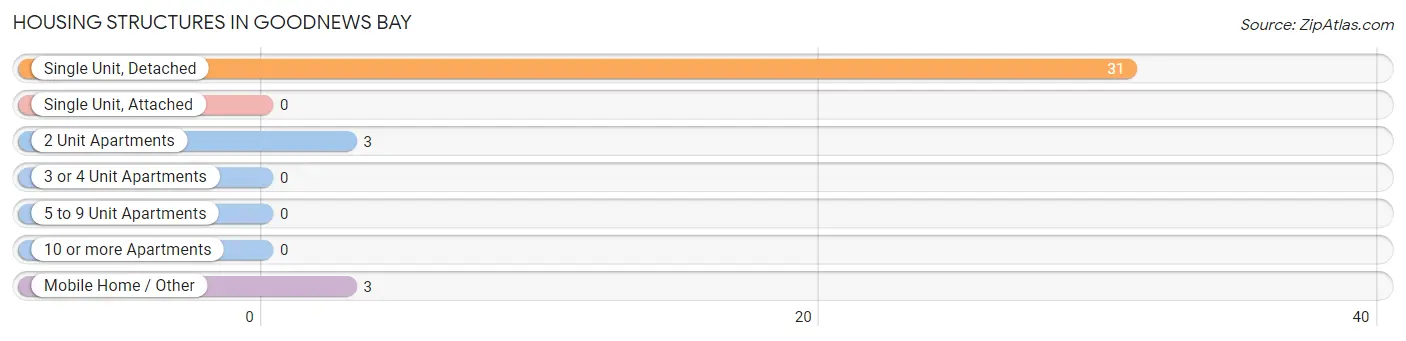
| Structure Type | # Housing Units | % Housing Units |
| Single Unit, Detached | 31 | 83.8% |
| Single Unit, Attached | 0 | 0.0% |
| 2 Unit Apartments | 3 | 8.1% |
| 3 or 4 Unit Apartments | 0 | 0.0% |
| 5 to 9 Unit Apartments | 0 | 0.0% |
| 10 or more Apartments | 0 | 0.0% |
| Mobile Home / Other | 3 | 8.1% |
| Total | 37 | 100.0% |
Housing Structures by Occupancy in Goodnews Bay
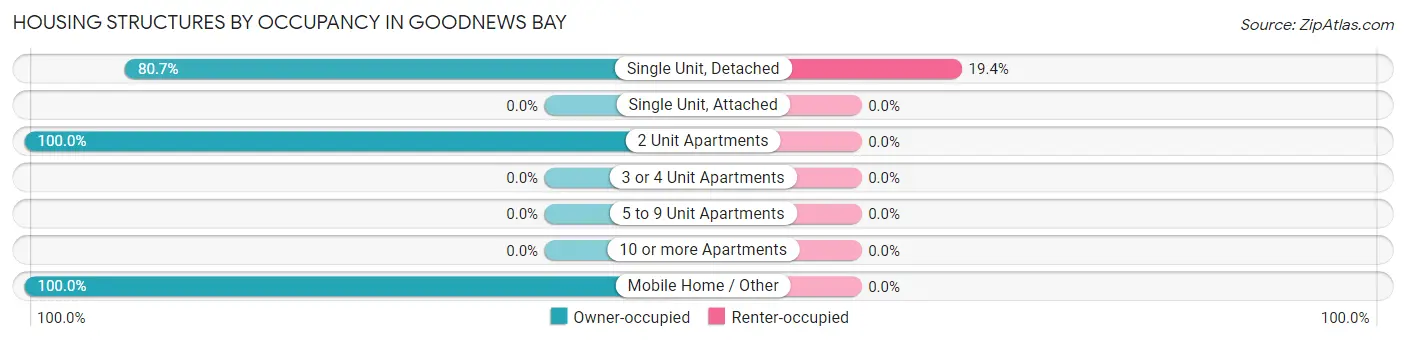
| Structure Type | Owner-occupied | Renter-occupied |
| Single Unit, Detached | 25 (80.6%) | 6 (19.4%) |
| Single Unit, Attached | 0 (0.0%) | 0 (0.0%) |
| 2 Unit Apartments | 3 (100.0%) | 0 (0.0%) |
| 3 or 4 Unit Apartments | 0 (0.0%) | 0 (0.0%) |
| 5 to 9 Unit Apartments | 0 (0.0%) | 0 (0.0%) |
| 10 or more Apartments | 0 (0.0%) | 0 (0.0%) |
| Mobile Home / Other | 3 (100.0%) | 0 (0.0%) |
| Total | 31 (83.8%) | 6 (16.2%) |
Housing Structures by Number of Rooms in Goodnews Bay
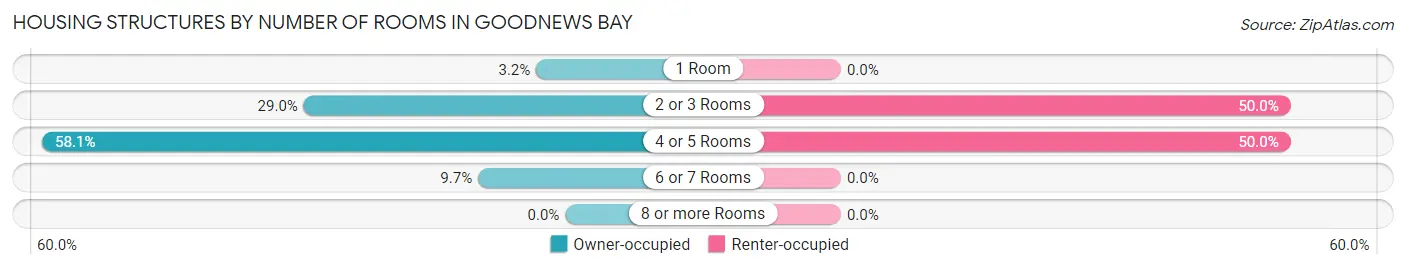
| Number of Rooms | Owner-occupied | Renter-occupied |
| 1 Room | 1 (3.2%) | 0 (0.0%) |
| 2 or 3 Rooms | 9 (29.0%) | 3 (50.0%) |
| 4 or 5 Rooms | 18 (58.1%) | 3 (50.0%) |
| 6 or 7 Rooms | 3 (9.7%) | 0 (0.0%) |
| 8 or more Rooms | 0 (0.0%) | 0 (0.0%) |
| Total | 31 (100.0%) | 6 (100.0%) |
Housing Structure by Heating Type in Goodnews Bay
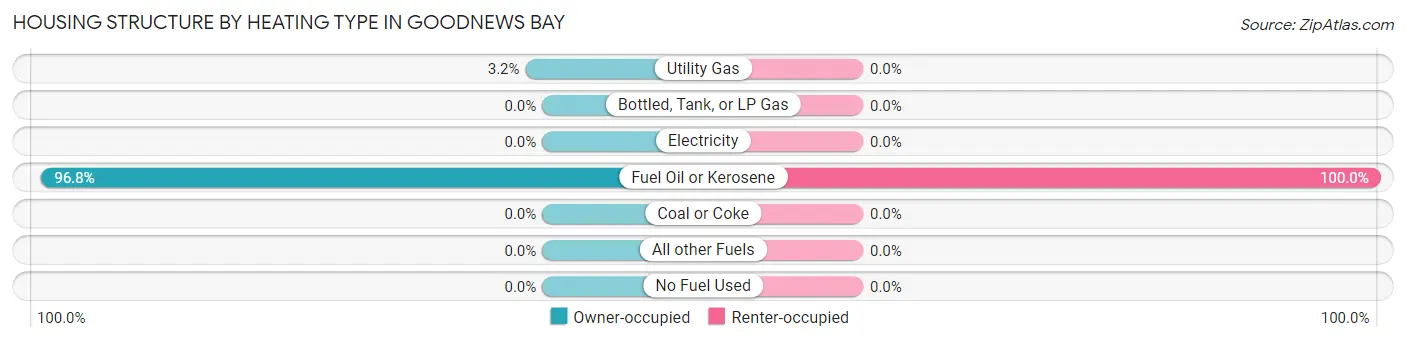
| Heating Type | Owner-occupied | Renter-occupied |
| Utility Gas | 1 (3.2%) | 0 (0.0%) |
| Bottled, Tank, or LP Gas | 0 (0.0%) | 0 (0.0%) |
| Electricity | 0 (0.0%) | 0 (0.0%) |
| Fuel Oil or Kerosene | 30 (96.8%) | 6 (100.0%) |
| Coal or Coke | 0 (0.0%) | 0 (0.0%) |
| All other Fuels | 0 (0.0%) | 0 (0.0%) |
| No Fuel Used | 0 (0.0%) | 0 (0.0%) |
| Total | 31 (100.0%) | 6 (100.0%) |
Household Vehicle Usage in Goodnews Bay
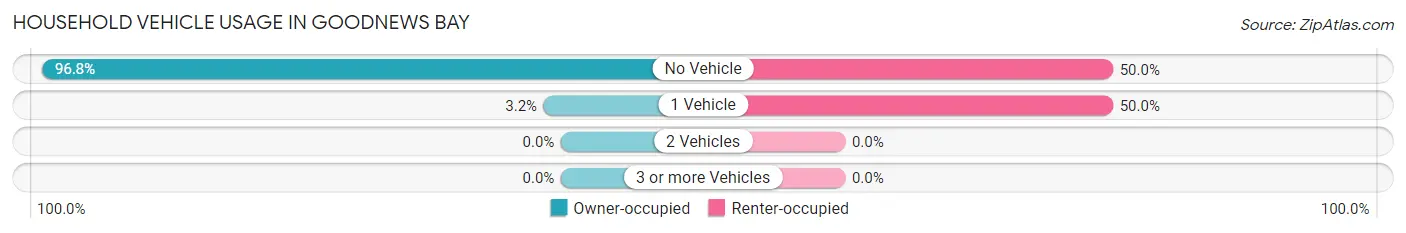
| Vehicles per Household | Owner-occupied | Renter-occupied |
| No Vehicle | 30 (96.8%) | 3 (50.0%) |
| 1 Vehicle | 1 (3.2%) | 3 (50.0%) |
| 2 Vehicles | 0 (0.0%) | 0 (0.0%) |
| 3 or more Vehicles | 0 (0.0%) | 0 (0.0%) |
| Total | 31 (100.0%) | 6 (100.0%) |
Real Estate & Mortgages in Goodnews Bay
Real Estate and Mortgage Overview in Goodnews Bay
| Characteristic | Without Mortgage | With Mortgage |
| Housing Units | 26 | 5 |
| Median Property Value | $108,300 | $0 |
| Median Household Income | $27,917 | $0 |
| Monthly Housing Costs | $236 | $0 |
| Real Estate Taxes | - | - |
Property Value by Mortgage Status in Goodnews Bay
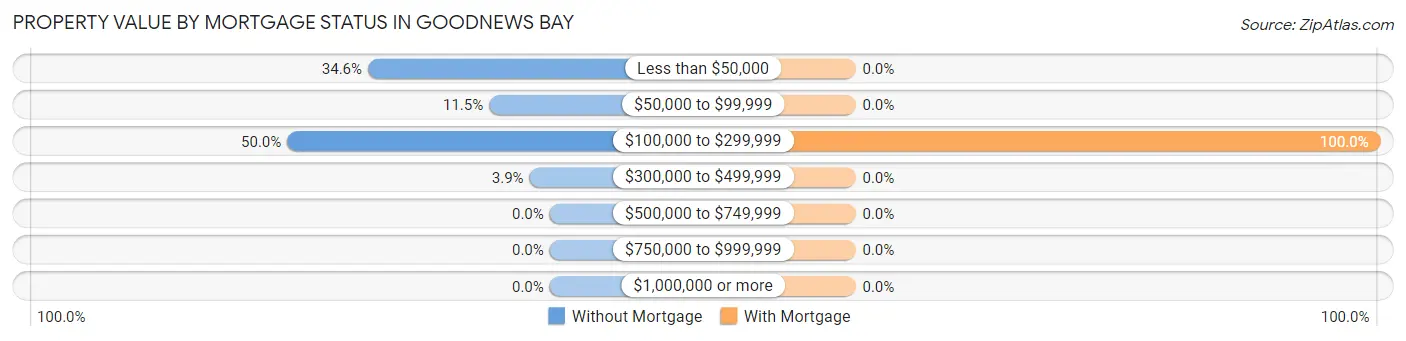
| Property Value | Without Mortgage | With Mortgage |
| Less than $50,000 | 9 (34.6%) | 0 (0.0%) |
| $50,000 to $99,999 | 3 (11.5%) | 0 (0.0%) |
| $100,000 to $299,999 | 13 (50.0%) | 5 (100.0%) |
| $300,000 to $499,999 | 1 (3.8%) | 0 (0.0%) |
| $500,000 to $749,999 | 0 (0.0%) | 0 (0.0%) |
| $750,000 to $999,999 | 0 (0.0%) | 0 (0.0%) |
| $1,000,000 or more | 0 (0.0%) | 0 (0.0%) |
| Total | 26 (100.0%) | 5 (100.0%) |
Household Income by Mortgage Status in Goodnews Bay
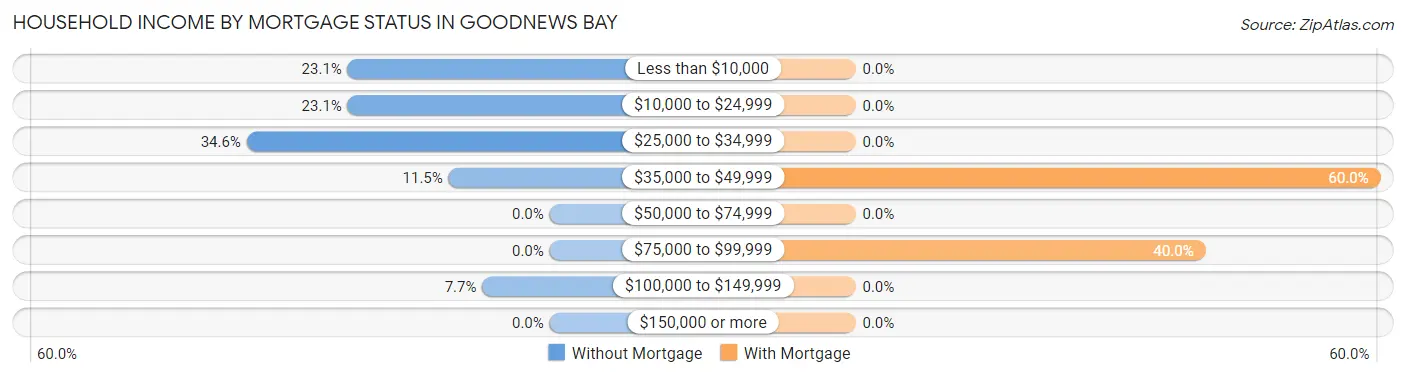
| Household Income | Without Mortgage | With Mortgage |
| Less than $10,000 | 6 (23.1%) | 0 (0.0%) |
| $10,000 to $24,999 | 6 (23.1%) | 0 (0.0%) |
| $25,000 to $34,999 | 9 (34.6%) | 0 (0.0%) |
| $35,000 to $49,999 | 3 (11.5%) | 3 (60.0%) |
| $50,000 to $74,999 | 0 (0.0%) | 0 (0.0%) |
| $75,000 to $99,999 | 0 (0.0%) | 2 (40.0%) |
| $100,000 to $149,999 | 2 (7.7%) | 0 (0.0%) |
| $150,000 or more | 0 (0.0%) | 0 (0.0%) |
| Total | 26 (100.0%) | 5 (100.0%) |
Property Value to Household Income Ratio in Goodnews Bay
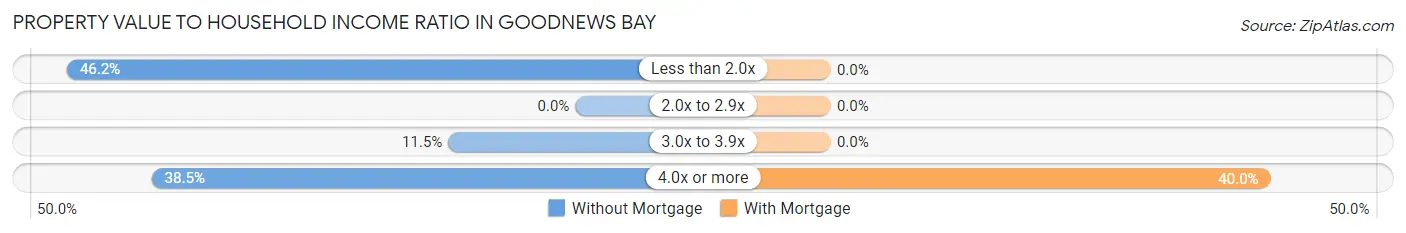
| Value-to-Income Ratio | Without Mortgage | With Mortgage |
| Less than 2.0x | 12 (46.2%) | 0 (0.0%) |
| 2.0x to 2.9x | 0 (0.0%) | 0 (0.0%) |
| 3.0x to 3.9x | 3 (11.5%) | 0 (0.0%) |
| 4.0x or more | 10 (38.5%) | 2 (40.0%) |
| Total | 26 (100.0%) | 5 (100.0%) |
Real Estate Taxes by Mortgage Status in Goodnews Bay
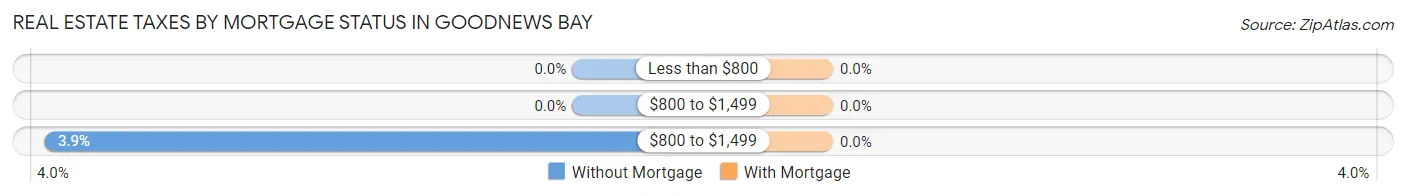
| Property Taxes | Without Mortgage | With Mortgage |
| Less than $800 | 0 (0.0%) | 0 (0.0%) |
| $800 to $1,499 | 0 (0.0%) | 0 (0.0%) |
| $800 to $1,499 | 1 (3.8%) | 0 (0.0%) |
| Total | 26 (100.0%) | 5 (100.0%) |
Health & Disability in Goodnews Bay
Health Insurance Coverage by Age in Goodnews Bay
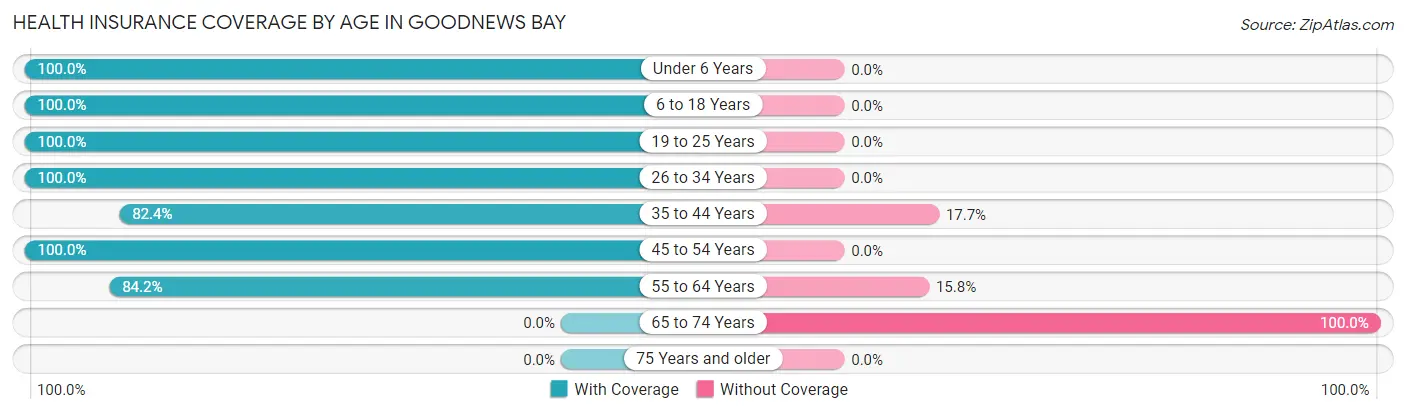
| Age Bracket | With Coverage | Without Coverage |
| Under 6 Years | 19 (100.0%) | 0 (0.0%) |
| 6 to 18 Years | 22 (100.0%) | 0 (0.0%) |
| 19 to 25 Years | 4 (100.0%) | 0 (0.0%) |
| 26 to 34 Years | 21 (100.0%) | 0 (0.0%) |
| 35 to 44 Years | 14 (82.4%) | 3 (17.6%) |
| 45 to 54 Years | 13 (100.0%) | 0 (0.0%) |
| 55 to 64 Years | 16 (84.2%) | 3 (15.8%) |
| 65 to 74 Years | 0 (0.0%) | 3 (100.0%) |
| 75 Years and older | 0 (0.0%) | 0 (0.0%) |
| Total | 109 (92.4%) | 9 (7.6%) |
Health Insurance Coverage by Citizenship Status in Goodnews Bay
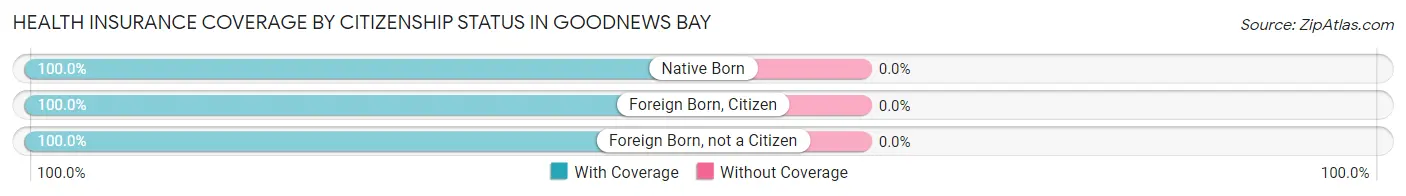
| Citizenship Status | With Coverage | Without Coverage |
| Native Born | 19 (100.0%) | 0 (0.0%) |
| Foreign Born, Citizen | 22 (100.0%) | 0 (0.0%) |
| Foreign Born, not a Citizen | 4 (100.0%) | 0 (0.0%) |
Health Insurance Coverage by Household Income in Goodnews Bay
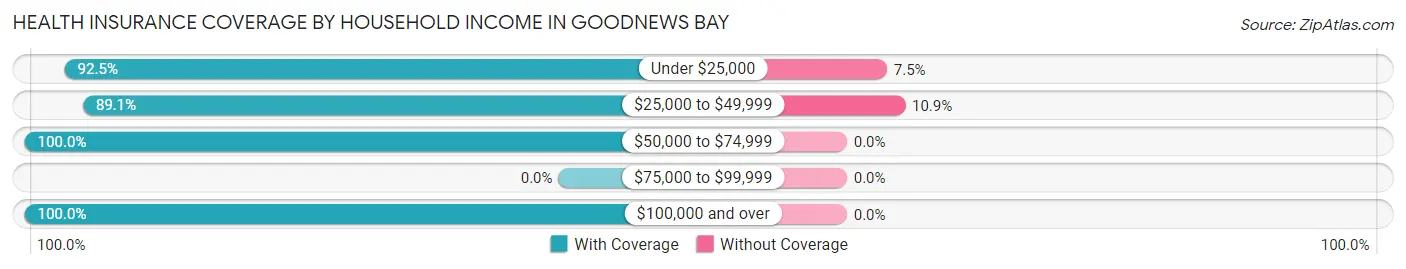
| Household Income | With Coverage | Without Coverage |
| Under $25,000 | 37 (92.5%) | 3 (7.5%) |
| $25,000 to $49,999 | 49 (89.1%) | 6 (10.9%) |
| $50,000 to $74,999 | 7 (100.0%) | 0 (0.0%) |
| $75,000 to $99,999 | 0 (0.0%) | 0 (0.0%) |
| $100,000 and over | 16 (100.0%) | 0 (0.0%) |
Public vs Private Health Insurance Coverage by Age in Goodnews Bay
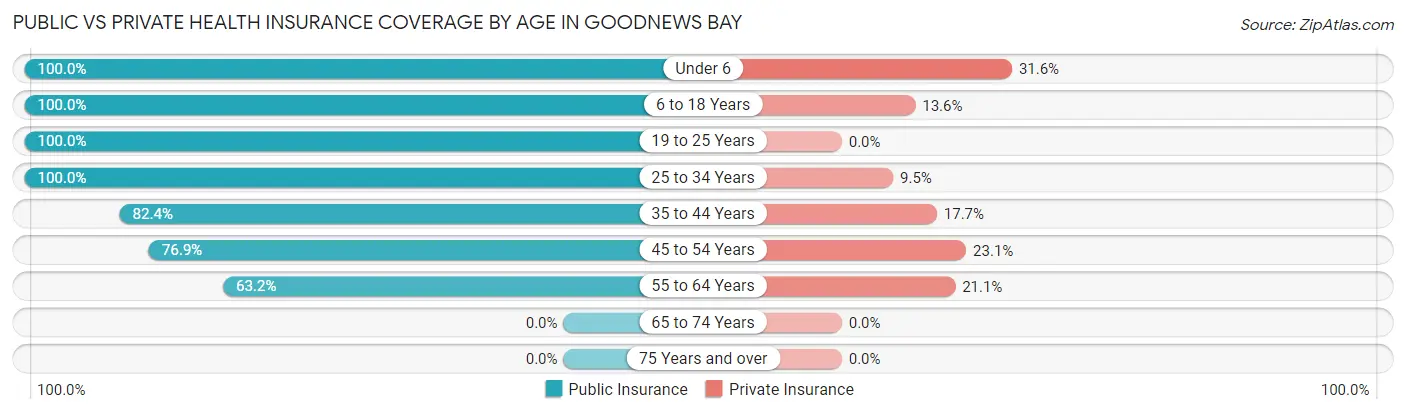
| Age Bracket | Public Insurance | Private Insurance |
| Under 6 | 19 (100.0%) | 6 (31.6%) |
| 6 to 18 Years | 22 (100.0%) | 3 (13.6%) |
| 19 to 25 Years | 4 (100.0%) | 0 (0.0%) |
| 25 to 34 Years | 21 (100.0%) | 2 (9.5%) |
| 35 to 44 Years | 14 (82.4%) | 3 (17.6%) |
| 45 to 54 Years | 10 (76.9%) | 3 (23.1%) |
| 55 to 64 Years | 12 (63.2%) | 4 (21.0%) |
| 65 to 74 Years | 0 (0.0%) | 0 (0.0%) |
| 75 Years and over | 0 (0.0%) | 0 (0.0%) |
| Total | 102 (86.4%) | 21 (17.8%) |
Disability Status by Sex by Age in Goodnews Bay
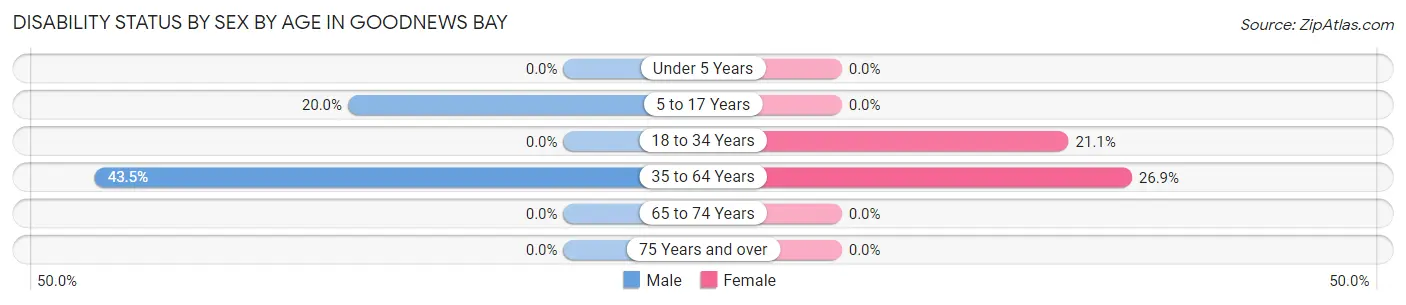
| Age Bracket | Male | Female |
| Under 5 Years | 0 (0.0%) | 0 (0.0%) |
| 5 to 17 Years | 2 (20.0%) | 0 (0.0%) |
| 18 to 34 Years | 0 (0.0%) | 4 (21.0%) |
| 35 to 64 Years | 10 (43.5%) | 7 (26.9%) |
| 65 to 74 Years | 0 (0.0%) | 0 (0.0%) |
| 75 Years and over | 0 (0.0%) | 0 (0.0%) |
Disability Class by Sex by Age in Goodnews Bay
Disability Class: Hearing Difficulty
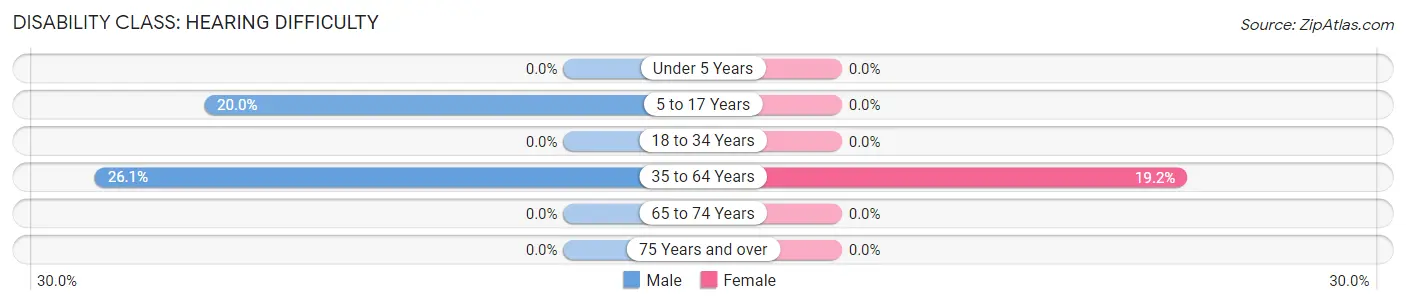
| Age Bracket | Male | Female |
| Under 5 Years | 0 (0.0%) | 0 (0.0%) |
| 5 to 17 Years | 2 (20.0%) | 0 (0.0%) |
| 18 to 34 Years | 0 (0.0%) | 0 (0.0%) |
| 35 to 64 Years | 6 (26.1%) | 5 (19.2%) |
| 65 to 74 Years | 0 (0.0%) | 0 (0.0%) |
| 75 Years and over | 0 (0.0%) | 0 (0.0%) |
Disability Class: Vision Difficulty
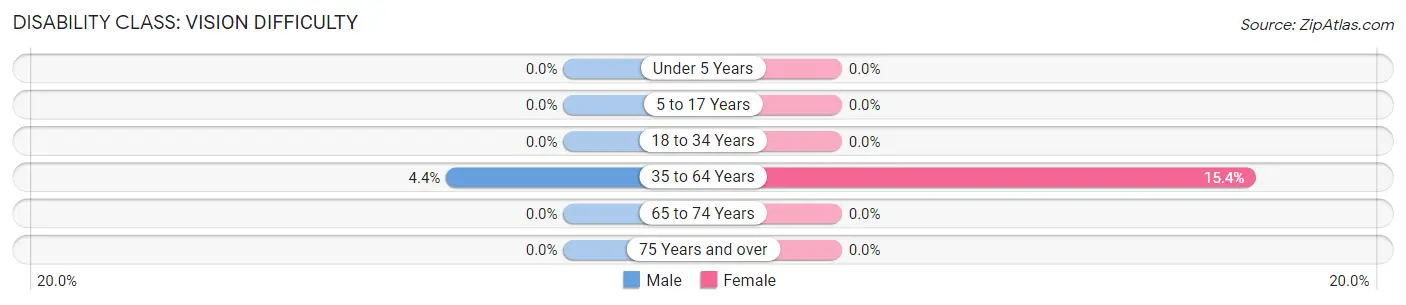
| Age Bracket | Male | Female |
| Under 5 Years | 0 (0.0%) | 0 (0.0%) |
| 5 to 17 Years | 0 (0.0%) | 0 (0.0%) |
| 18 to 34 Years | 0 (0.0%) | 0 (0.0%) |
| 35 to 64 Years | 1 (4.3%) | 4 (15.4%) |
| 65 to 74 Years | 0 (0.0%) | 0 (0.0%) |
| 75 Years and over | 0 (0.0%) | 0 (0.0%) |
Disability Class: Cognitive Difficulty
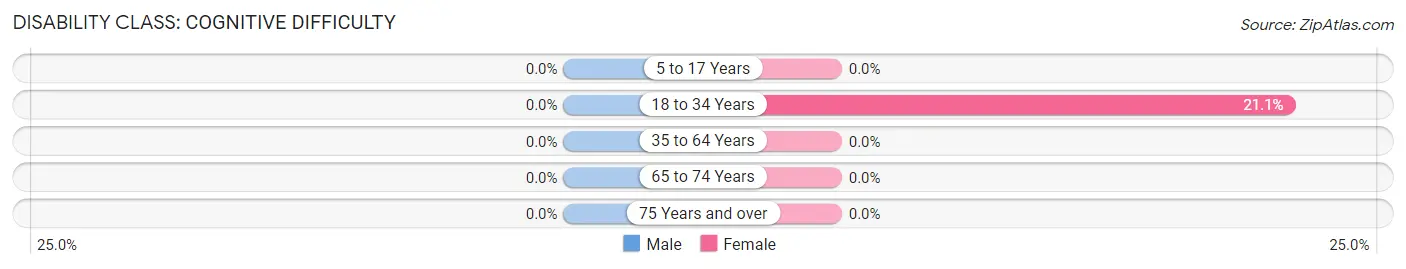
| Age Bracket | Male | Female |
| 5 to 17 Years | 0 (0.0%) | 0 (0.0%) |
| 18 to 34 Years | 0 (0.0%) | 4 (21.0%) |
| 35 to 64 Years | 0 (0.0%) | 0 (0.0%) |
| 65 to 74 Years | 0 (0.0%) | 0 (0.0%) |
| 75 Years and over | 0 (0.0%) | 0 (0.0%) |
Disability Class: Ambulatory Difficulty
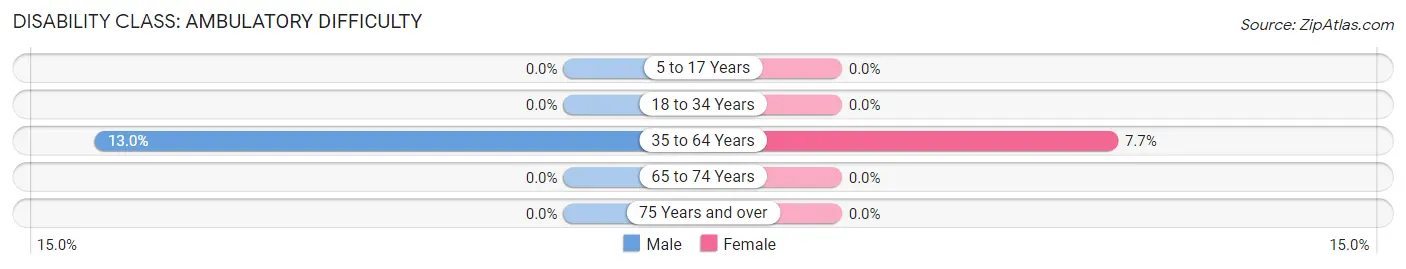
| Age Bracket | Male | Female |
| 5 to 17 Years | 0 (0.0%) | 0 (0.0%) |
| 18 to 34 Years | 0 (0.0%) | 0 (0.0%) |
| 35 to 64 Years | 3 (13.0%) | 2 (7.7%) |
| 65 to 74 Years | 0 (0.0%) | 0 (0.0%) |
| 75 Years and over | 0 (0.0%) | 0 (0.0%) |
Disability Class: Self-Care Difficulty
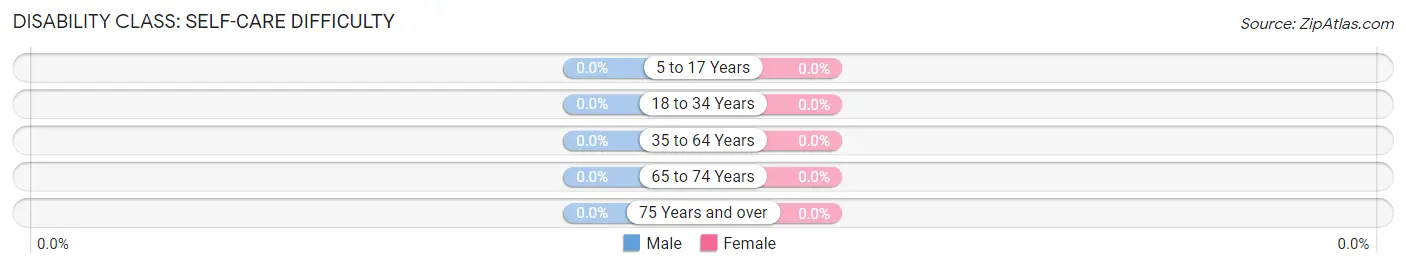
| Age Bracket | Male | Female |
| 5 to 17 Years | 0 (0.0%) | 0 (0.0%) |
| 18 to 34 Years | 0 (0.0%) | 0 (0.0%) |
| 35 to 64 Years | 0 (0.0%) | 0 (0.0%) |
| 65 to 74 Years | 0 (0.0%) | 0 (0.0%) |
| 75 Years and over | 0 (0.0%) | 0 (0.0%) |
Technology Access in Goodnews Bay
Computing Device Access in Goodnews Bay
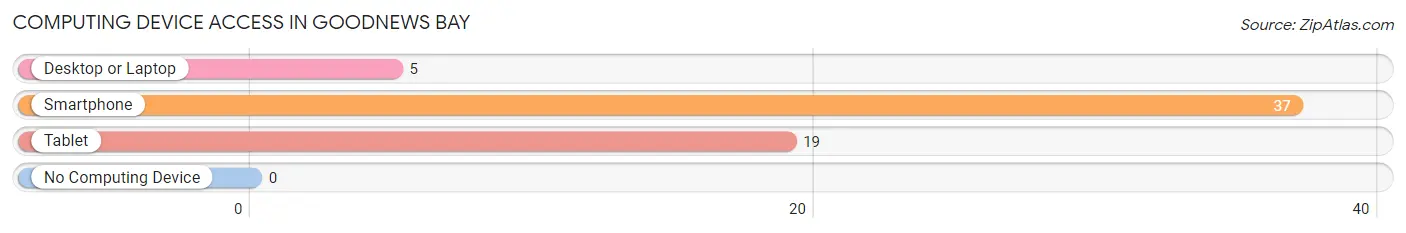
| Device Type | # Households | % Households |
| Desktop or Laptop | 5 | 13.5% |
| Smartphone | 37 | 100.0% |
| Tablet | 19 | 51.3% |
| No Computing Device | 0 | 0.0% |
| Total | 37 | 100.0% |
Internet Access in Goodnews Bay
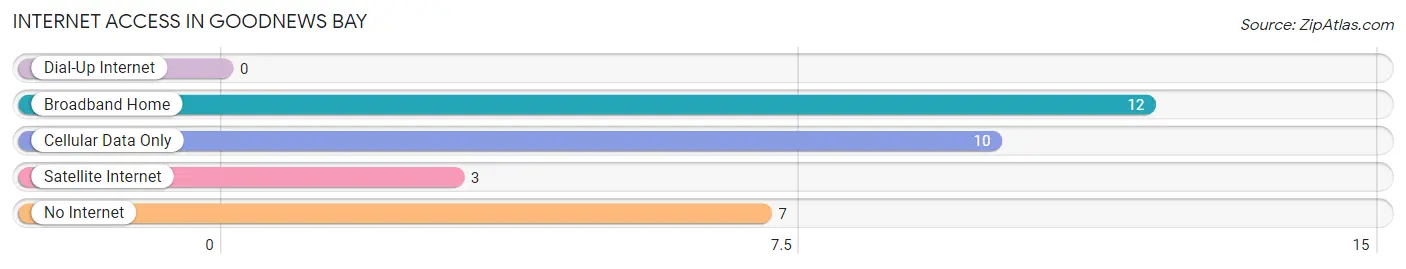
| Internet Type | # Households | % Households |
| Dial-Up Internet | 0 | 0.0% |
| Broadband Home | 12 | 32.4% |
| Cellular Data Only | 10 | 27.0% |
| Satellite Internet | 3 | 8.1% |
| No Internet | 7 | 18.9% |
| Total | 37 | 100.0% |
Goodnews Bay Summary
Goodnews Bay is a small unincorporated community located in the western part of the U.S. state of Alaska. It is situated on the north shore of Goodnews Bay, a large bay of the Bering Sea. The community is located in the Bethel Census Area, and is part of the Yukon-Kuskokwim Delta region.
History
Goodnews Bay has a long history of human habitation. Archaeological evidence suggests that the area has been inhabited for at least 4,000 years. The first recorded contact with Europeans was in 1741, when the Russian explorer Vitus Bering sailed through the area. The bay was named “Good News” by Bering, who was impressed by the abundance of fish and wildlife in the area.
In the late 19th century, the area was inhabited by Yup’ik Eskimos, who lived a subsistence lifestyle based on fishing and hunting. In the early 20th century, the area was settled by non-Native Americans, primarily from the Aleutian Islands. The first permanent settlement was established in 1912, and the community was incorporated in 1915.
Geography
Goodnews Bay is located on the north shore of Goodnews Bay, a large bay of the Bering Sea. The bay is approximately 25 miles (40 km) long and 10 miles (16 km) wide. The community is located at the mouth of the Goodnews River, which flows into the bay. The surrounding area is mostly flat, with rolling hills and low mountains in the distance. The climate is subarctic, with cold winters and mild summers.
Economy
The economy of Goodnews Bay is based primarily on fishing and subsistence activities. Commercial fishing is the main source of income for many residents, with salmon, halibut, and cod being the most important species. Subsistence activities, such as hunting and gathering, are also important sources of food and income.
The community also has a small tourism industry, with visitors coming to fish, hunt, and observe wildlife. The Goodnews Bay Lodge, located on the bay, offers accommodations and guided tours.
Demographics
As of the 2010 census, the population of Goodnews Bay was 517. The population is predominantly Native American, with the majority being Yup’ik Eskimos. The median age is 28.7 years, and the median household income is $25,000. The unemployment rate is high, at 17.3%.
Conclusion
Goodnews Bay is a small unincorporated community located in the western part of Alaska. It has a long history of human habitation, and is home to a predominantly Native American population. The economy is based primarily on fishing and subsistence activities, and the community also has a small tourism industry. The population is 517, with a median age of 28.7 years and a median household income of $25,000.
Common Questions
What is Per Capita Income in Goodnews Bay?
Per Capita income in Goodnews Bay is $11,503.
What is the Median Family Income in Goodnews Bay?
Median Family Income in Goodnews Bay is $27,083.
What is the Median Household income in Goodnews Bay?
Median Household Income in Goodnews Bay is $27,708.
What is Income or Wage Gap in Goodnews Bay?
Income or Wage Gap in Goodnews Bay is 3.3%.
Women in Goodnews Bay earn 96.7 cents for every dollar earned by a man.
What is Inequality or Gini Index in Goodnews Bay?
Inequality or Gini Index in Goodnews Bay is 0.46.
What is the Total Population of Goodnews Bay?
Total Population of Goodnews Bay is 118.
What is the Total Male Population of Goodnews Bay?
Total Male Population of Goodnews Bay is 48.
What is the Total Female Population of Goodnews Bay?
Total Female Population of Goodnews Bay is 70.
What is the Ratio of Males per 100 Females in Goodnews Bay?
There are 68.57 Males per 100 Females in Goodnews Bay.
What is the Ratio of Females per 100 Males in Goodnews Bay?
There are 145.83 Females per 100 Males in Goodnews Bay.
What is the Median Population Age in Goodnews Bay?
Median Population Age in Goodnews Bay is 32.8 Years.
What is the Average Family Size in Goodnews Bay
Average Family Size in Goodnews Bay is 3.6 People.
What is the Average Household Size in Goodnews Bay
Average Household Size in Goodnews Bay is 3.2 People.
How Large is the Labor Force in Goodnews Bay?
There are 49 People in the Labor Forcein in Goodnews Bay.
What is the Percentage of People in the Labor Force in Goodnews Bay?
61.3% of People are in the Labor Force in Goodnews Bay.
What is the Unemployment Rate in Goodnews Bay?
Unemployment Rate in Goodnews Bay is 6.1%.