Kotlik, AK Map & Demographics
Kotlik Map
Kotlik Overview
$10,256
PER CAPITA INCOME
$52,974
AVG FAMILY INCOME
$42,344
AVG HOUSEHOLD INCOME
35.8%
WAGE / INCOME GAP [ % ]
64.2¢/ $1
WAGE / INCOME GAP [ $ ]
$11,942
FAMILY INCOME DEFICIT
0.40
INEQUALITY / GINI INDEX
1,272
TOTAL POPULATION
674
MALE POPULATION
598
FEMALE POPULATION
112.71
MALES / 100 FEMALES
88.72
FEMALES / 100 MALES
18.6
MEDIAN AGE
5.7
AVG FAMILY SIZE
5.3
AVG HOUSEHOLD SIZE
415
LABOR FORCE [ PEOPLE ]
60.1%
PERCENT IN LABOR FORCE
22.4%
UNEMPLOYMENT RATE
Kotlik Zip Codes
Kotlik Area Codes
Income in Kotlik
Income Overview in Kotlik
Per Capita Income in Kotlik is $10,256, while median incomes of families and households are $52,974 and $42,344 respectively.
| Characteristic | Number | Measure |
| Per Capita Income | 1,272 | $10,256 |
| Median Family Income | 199 | $52,974 |
| Mean Family Income | 199 | $47,467 |
| Median Household Income | 241 | $42,344 |
| Mean Household Income | 241 | $50,305 |
| Income Deficit | 199 | $11,942 |
| Wage / Income Gap (%) | 1,272 | 35.78% |
| Wage / Income Gap ($) | 1,272 | 64.22¢ per $1 |
| Gini / Inequality Index | 1,272 | 0.40 |
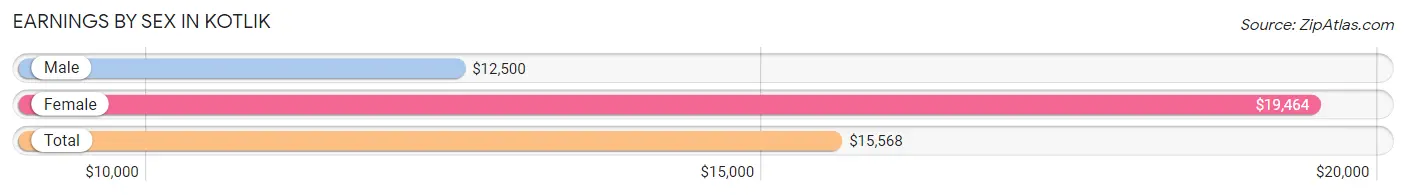
Earnings by Sex in Kotlik
Average Earnings in Kotlik are $15,568, $12,500 for men and $19,464 for women, a difference of 35.8%.
| Sex | Number | Average Earnings |
| Male | 194 (46.3%) | $12,500 |
| Female | 225 (53.7%) | $19,464 |
| Total | 419 (100.0%) | $15,568 |
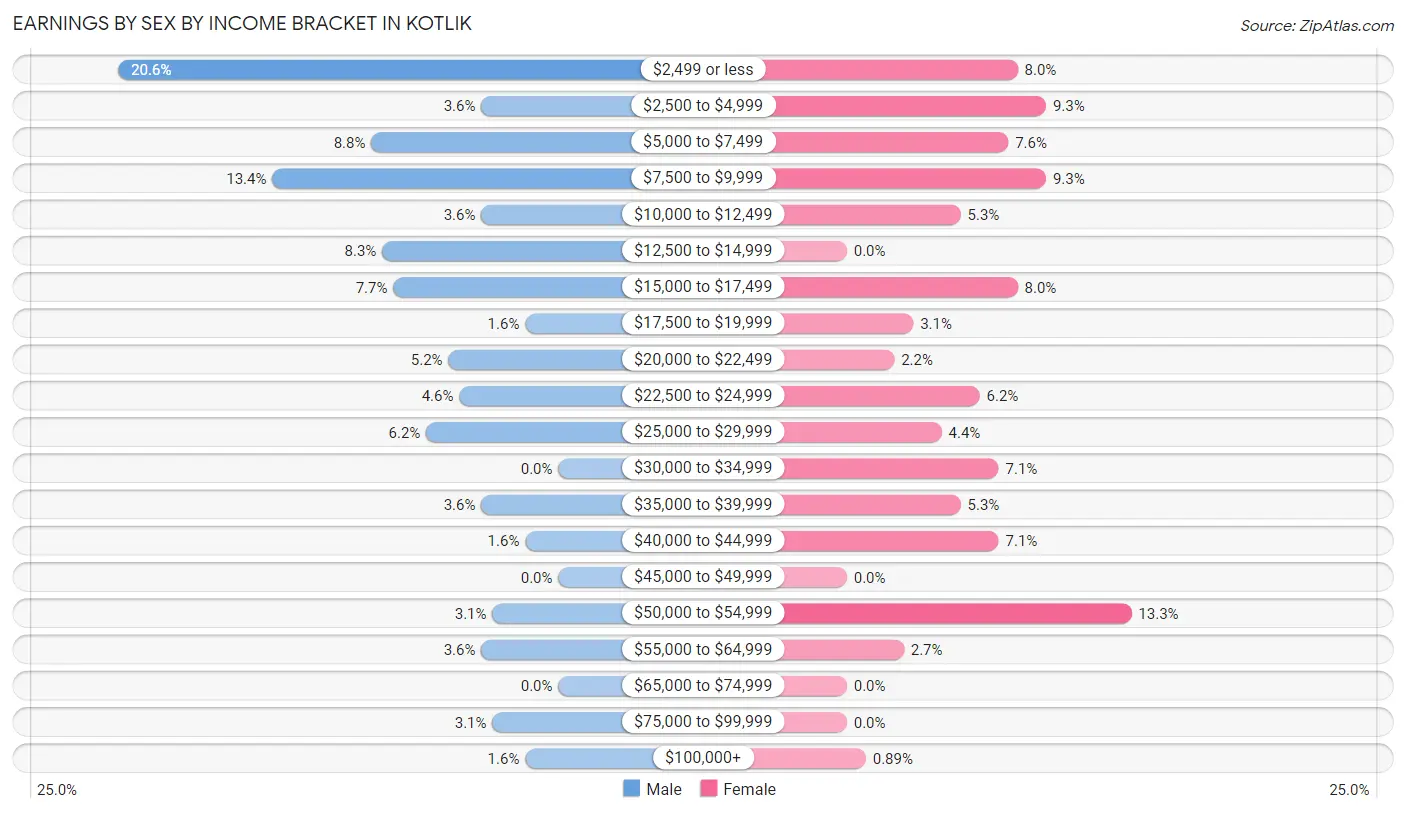
Earnings by Sex by Income Bracket in Kotlik
The most common earnings brackets in Kotlik are $2,499 or less for men (40 | 20.6%) and $50,000 to $54,999 for women (30 | 13.3%).
| Income | Male | Female |
| $2,499 or less | 40 (20.6%) | 18 (8.0%) |
| $2,500 to $4,999 | 7 (3.6%) | 21 (9.3%) |
| $5,000 to $7,499 | 17 (8.8%) | 17 (7.6%) |
| $7,500 to $9,999 | 26 (13.4%) | 21 (9.3%) |
| $10,000 to $12,499 | 7 (3.6%) | 12 (5.3%) |
| $12,500 to $14,999 | 16 (8.3%) | 0 (0.0%) |
| $15,000 to $17,499 | 15 (7.7%) | 18 (8.0%) |
| $17,500 to $19,999 | 3 (1.5%) | 7 (3.1%) |
| $20,000 to $22,499 | 10 (5.1%) | 5 (2.2%) |
| $22,500 to $24,999 | 9 (4.6%) | 14 (6.2%) |
| $25,000 to $29,999 | 12 (6.2%) | 10 (4.4%) |
| $30,000 to $34,999 | 0 (0.0%) | 16 (7.1%) |
| $35,000 to $39,999 | 7 (3.6%) | 12 (5.3%) |
| $40,000 to $44,999 | 3 (1.5%) | 16 (7.1%) |
| $45,000 to $49,999 | 0 (0.0%) | 0 (0.0%) |
| $50,000 to $54,999 | 6 (3.1%) | 30 (13.3%) |
| $55,000 to $64,999 | 7 (3.6%) | 6 (2.7%) |
| $65,000 to $74,999 | 0 (0.0%) | 0 (0.0%) |
| $75,000 to $99,999 | 6 (3.1%) | 0 (0.0%) |
| $100,000+ | 3 (1.5%) | 2 (0.9%) |
| Total | 194 (100.0%) | 225 (100.0%) |
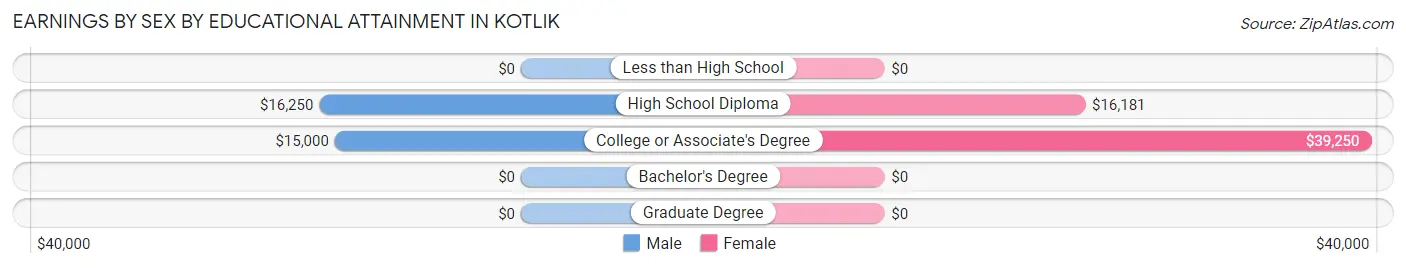
Earnings by Sex by Educational Attainment in Kotlik
Average earnings in Kotlik are $15,000 for men and $22,000 for women, a difference of 31.8%. Men with an educational attainment of high school diploma enjoy the highest average annual earnings of $16,250, while those with college or associate's degree education earn the least with $15,000. Women with an educational attainment of college or associate's degree earn the most with the average annual earnings of $39,250, while those with high school diploma education have the smallest earnings of $16,181.
| Educational Attainment | Male Income | Female Income |
| Less than High School | - | - |
| High School Diploma | $16,250 | $16,181 |
| College or Associate's Degree | $15,000 | $39,250 |
| Bachelor's Degree | - | - |
| Graduate Degree | - | - |
| Total | $15,000 | $22,000 |
Family Income in Kotlik
Family Income Brackets in Kotlik
According to the Kotlik family income data, there are 77 families falling into the $50,000 to $74,999 income range, which is the most common income bracket and makes up 38.7% of all families.
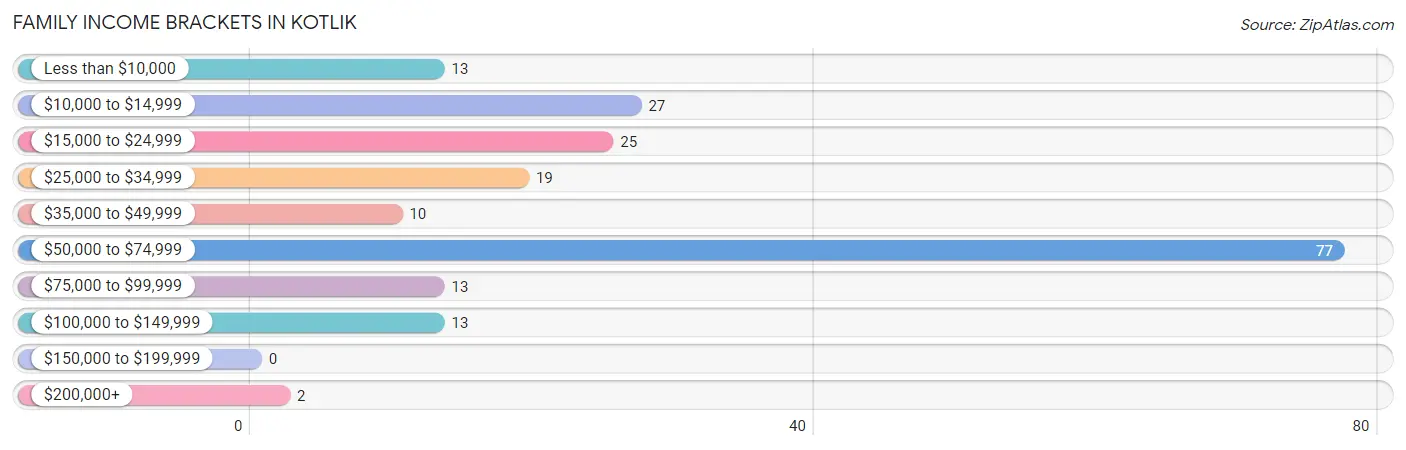
| Income Bracket | # Families | % Families |
| Less than $10,000 | 13 | 6.5% |
| $10,000 to $14,999 | 27 | 13.6% |
| $15,000 to $24,999 | 25 | 12.6% |
| $25,000 to $34,999 | 19 | 9.5% |
| $35,000 to $49,999 | 10 | 5.0% |
| $50,000 to $74,999 | 77 | 38.7% |
| $75,000 to $99,999 | 13 | 6.5% |
| $100,000 to $149,999 | 13 | 6.5% |
| $150,000 to $199,999 | 0 | 0.0% |
| $200,000+ | 2 | 1.0% |
Family Income by Famaliy Size in Kotlik
7+ person families (28 | 14.1%) account for the highest median family income in Kotlik with $75,000 per family, while 3-person families (65 | 32.7%) have the highest median income of $17,991 per family member.
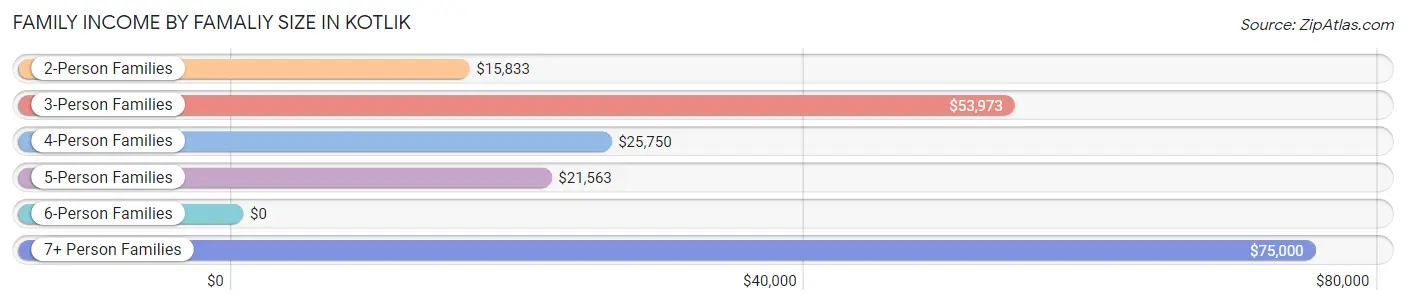
| Income Bracket | # Families | Median Income |
| 2-Person Families | 22 (11.1%) | $15,833 |
| 3-Person Families | 65 (32.7%) | $53,973 |
| 4-Person Families | 35 (17.6%) | $25,750 |
| 5-Person Families | 11 (5.5%) | $21,563 |
| 6-Person Families | 38 (19.1%) | $0 |
| 7+ Person Families | 28 (14.1%) | $75,000 |
| Total | 199 (100.0%) | $52,974 |
Family Income by Number of Earners in Kotlik
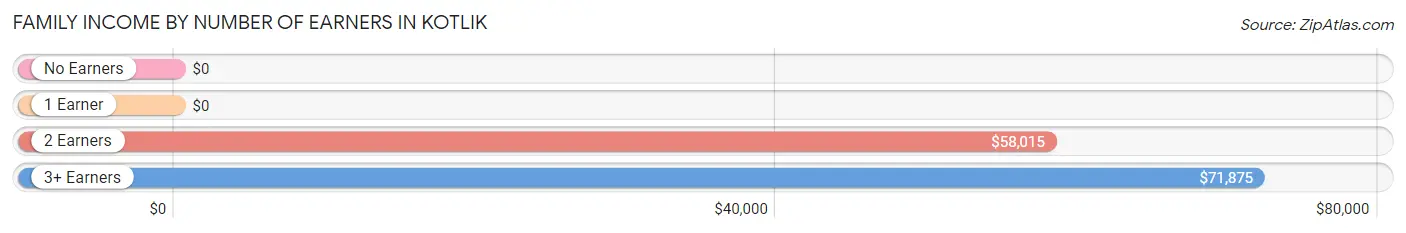
| Number of Earners | # Families | Median Income |
| No Earners | 20 (10.1%) | $0 |
| 1 Earner | 93 (46.7%) | $0 |
| 2 Earners | 47 (23.6%) | $58,015 |
| 3+ Earners | 39 (19.6%) | $71,875 |
| Total | 199 (100.0%) | $52,974 |
Household Income in Kotlik
Household Income Brackets in Kotlik
With 80 households falling in the category, the $50,000 to $74,999 income range is the most frequent in Kotlik, accounting for 33.2% of all households. In contrast, only 2 households (0.8%) fall into the $150,000 to $199,999 income bracket, making it the least populous group.
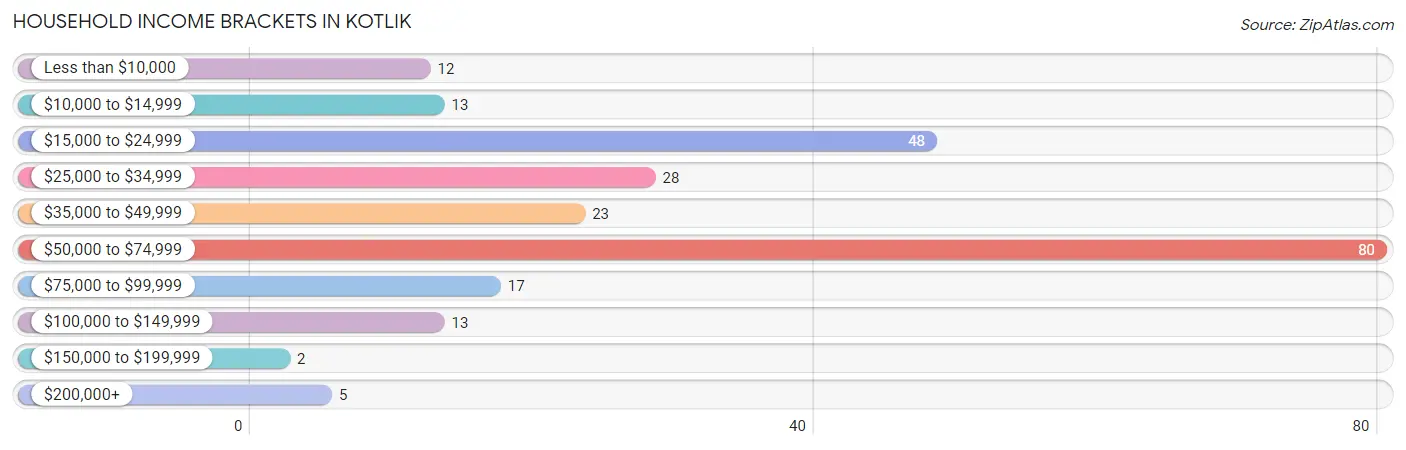
| Income Bracket | # Households | % Households |
| Less than $10,000 | 12 | 5.0% |
| $10,000 to $14,999 | 13 | 5.4% |
| $15,000 to $24,999 | 48 | 19.9% |
| $25,000 to $34,999 | 28 | 11.6% |
| $35,000 to $49,999 | 23 | 9.5% |
| $50,000 to $74,999 | 80 | 33.2% |
| $75,000 to $99,999 | 17 | 7.1% |
| $100,000 to $149,999 | 13 | 5.4% |
| $150,000 to $199,999 | 2 | 0.8% |
| $200,000+ | 5 | 2.1% |
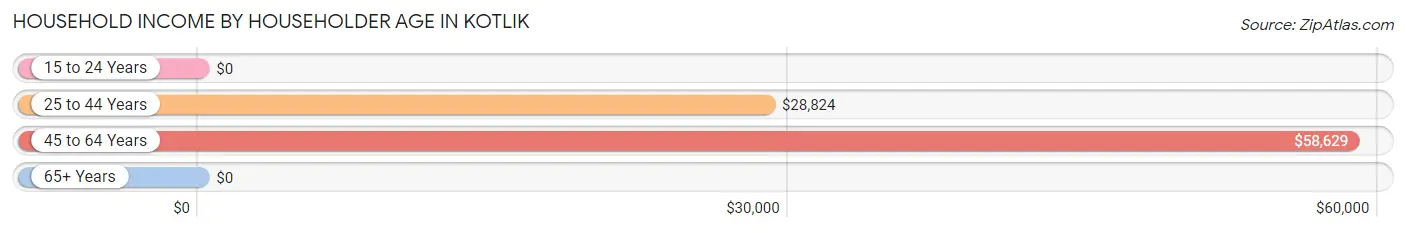
Household Income by Householder Age in Kotlik
The median household income in Kotlik is $42,344, with the highest median household income of $58,629 found in the 45 to 64 years age bracket for the primary householder. A total of 104 households (43.1%) fall into this category. Meanwhile, the 15 to 24 years age bracket for the primary householder has the lowest median household income of $0, with 7 households (2.9%) in this group.
| Income Bracket | # Households | Median Income |
| 15 to 24 Years | 7 (2.9%) | $0 |
| 25 to 44 Years | 90 (37.3%) | $28,824 |
| 45 to 64 Years | 104 (43.1%) | $58,629 |
| 65+ Years | 40 (16.6%) | $0 |
| Total | 241 (100.0%) | $42,344 |
Poverty in Kotlik
Income Below Poverty by Sex and Age in Kotlik
With 35.1% poverty level for males and 35.7% for females among the residents of Kotlik, 16 and 17 year old males and 16 and 17 year old females are the most vulnerable to poverty, with 3 males (100.0%) and 30 females (93.8%) in their respective age groups living below the poverty level.
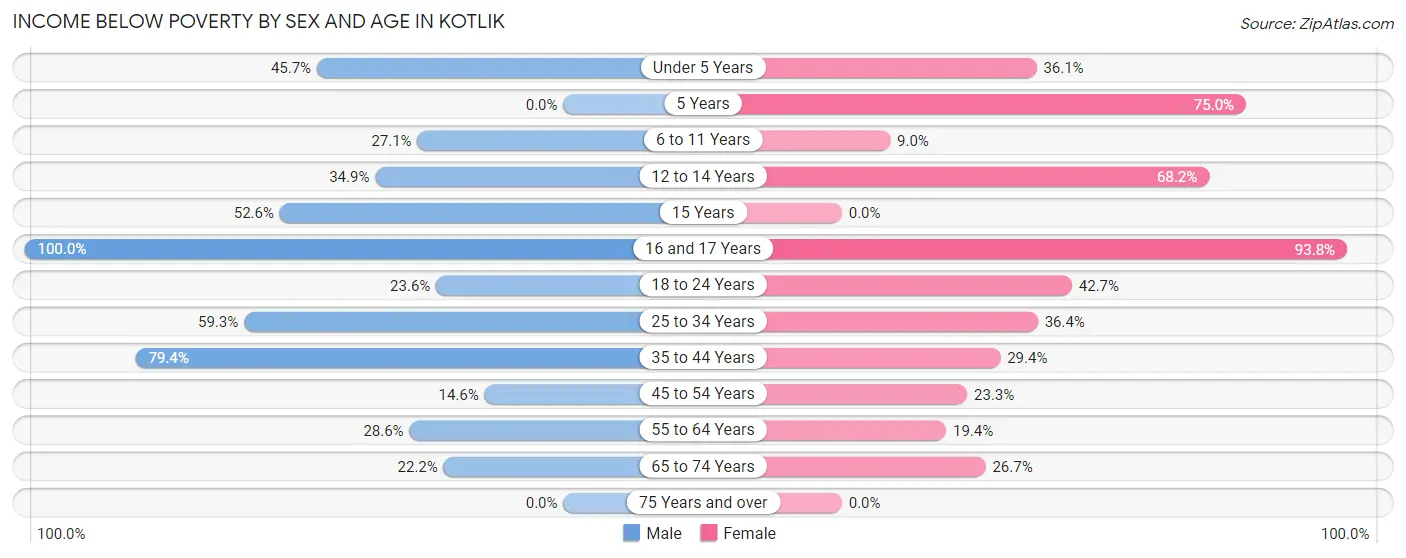
| Age Bracket | Male | Female |
| Under 5 Years | 43 (45.7%) | 43 (36.1%) |
| 5 Years | 0 (0.0%) | 12 (75.0%) |
| 6 to 11 Years | 39 (27.1%) | 7 (9.0%) |
| 12 to 14 Years | 22 (34.9%) | 15 (68.2%) |
| 15 Years | 10 (52.6%) | 0 (0.0%) |
| 16 and 17 Years | 3 (100.0%) | 30 (93.8%) |
| 18 to 24 Years | 17 (23.6%) | 38 (42.7%) |
| 25 to 34 Years | 48 (59.3%) | 32 (36.4%) |
| 35 to 44 Years | 27 (79.4%) | 15 (29.4%) |
| 45 to 54 Years | 12 (14.6%) | 10 (23.3%) |
| 55 to 64 Years | 10 (28.6%) | 6 (19.4%) |
| 65 to 74 Years | 4 (22.2%) | 4 (26.7%) |
| 75 Years and over | 0 (0.0%) | 0 (0.0%) |
| Total | 235 (35.1%) | 212 (35.7%) |
Income Above Poverty by Sex and Age in Kotlik
According to the poverty statistics in Kotlik, males aged 5 years and females aged 75 years and over are the age groups that are most secure financially, with 100.0% of males and 100.0% of females in these age groups living above the poverty line.
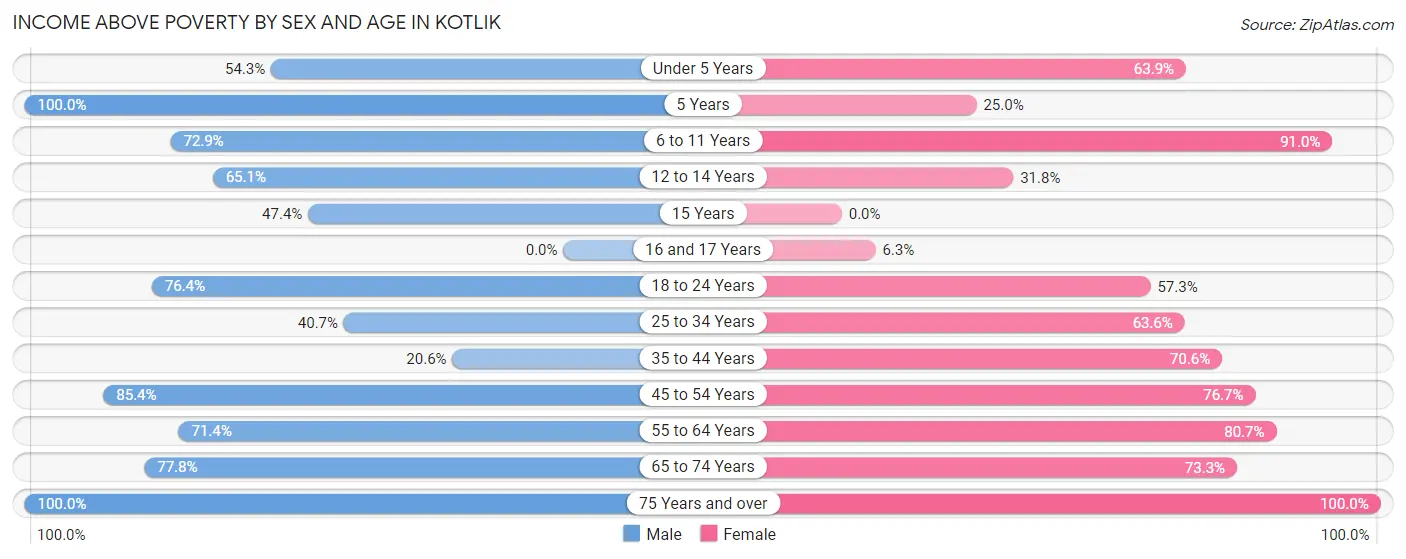
| Age Bracket | Male | Female |
| Under 5 Years | 51 (54.3%) | 76 (63.9%) |
| 5 Years | 18 (100.0%) | 4 (25.0%) |
| 6 to 11 Years | 105 (72.9%) | 71 (91.0%) |
| 12 to 14 Years | 41 (65.1%) | 7 (31.8%) |
| 15 Years | 9 (47.4%) | 0 (0.0%) |
| 16 and 17 Years | 0 (0.0%) | 2 (6.2%) |
| 18 to 24 Years | 55 (76.4%) | 51 (57.3%) |
| 25 to 34 Years | 33 (40.7%) | 56 (63.6%) |
| 35 to 44 Years | 7 (20.6%) | 36 (70.6%) |
| 45 to 54 Years | 70 (85.4%) | 33 (76.7%) |
| 55 to 64 Years | 25 (71.4%) | 25 (80.6%) |
| 65 to 74 Years | 14 (77.8%) | 11 (73.3%) |
| 75 Years and over | 7 (100.0%) | 10 (100.0%) |
| Total | 435 (64.9%) | 382 (64.3%) |
Income Below Poverty Among Married-Couple Families in Kotlik
The poverty statistics for married-couple families in Kotlik show that 25.4% or 17 of the total 67 families live below the poverty line. Families with 3 or 4 children have the highest poverty rate of 53.8%, comprising of 14 families. On the other hand, families with no children have the lowest poverty rate of 0.0%, which includes 0 families.
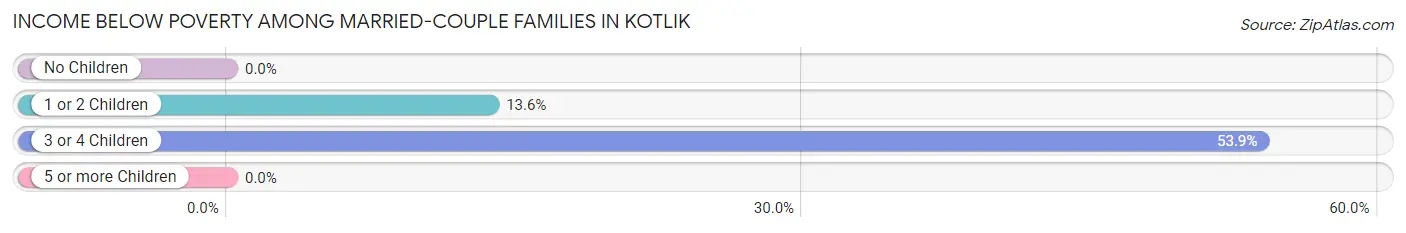
| Children | Above Poverty | Below Poverty |
| No Children | 11 (100.0%) | 0 (0.0%) |
| 1 or 2 Children | 19 (86.4%) | 3 (13.6%) |
| 3 or 4 Children | 12 (46.2%) | 14 (53.8%) |
| 5 or more Children | 8 (100.0%) | 0 (0.0%) |
| Total | 50 (74.6%) | 17 (25.4%) |
Income Below Poverty Among Single-Parent Households in Kotlik
According to the poverty data in Kotlik, 63.2% or 36 single-father households and 44.0% or 33 single-mother households are living below the poverty line. Among single-father households, those with 3 or 4 children have the highest poverty rate, with 14 households (100.0%) experiencing poverty. Likewise, among single-mother households, those with 5 or more children have the highest poverty rate, with 11 households (100.0%) falling below the poverty line.
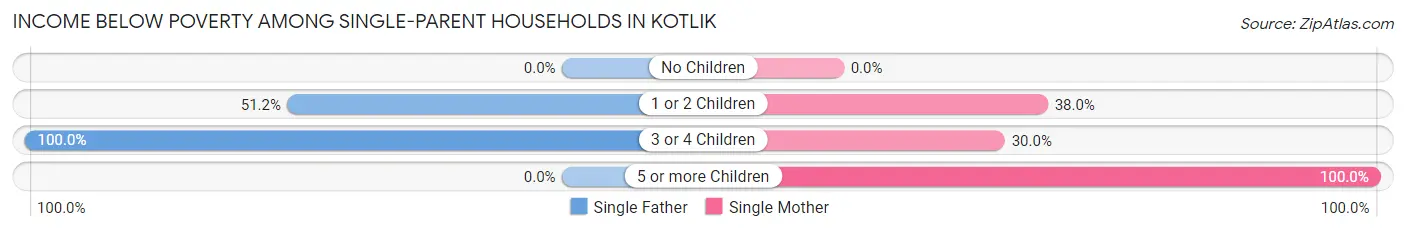
| Children | Single Father | Single Mother |
| No Children | 0 (0.0%) | 0 (0.0%) |
| 1 or 2 Children | 22 (51.2%) | 19 (38.0%) |
| 3 or 4 Children | 14 (100.0%) | 3 (30.0%) |
| 5 or more Children | 0 (0.0%) | 11 (100.0%) |
| Total | 36 (63.2%) | 33 (44.0%) |
Income Below Poverty Among Married-Couple vs Single-Parent Households in Kotlik
The poverty data for Kotlik shows that 17 of the married-couple family households (25.4%) and 69 of the single-parent households (52.3%) are living below the poverty level. Within the married-couple family households, those with 3 or 4 children have the highest poverty rate, with 14 households (53.8%) falling below the poverty line. Among the single-parent households, those with 5 or more children have the highest poverty rate, with 11 household (100.0%) living below poverty.
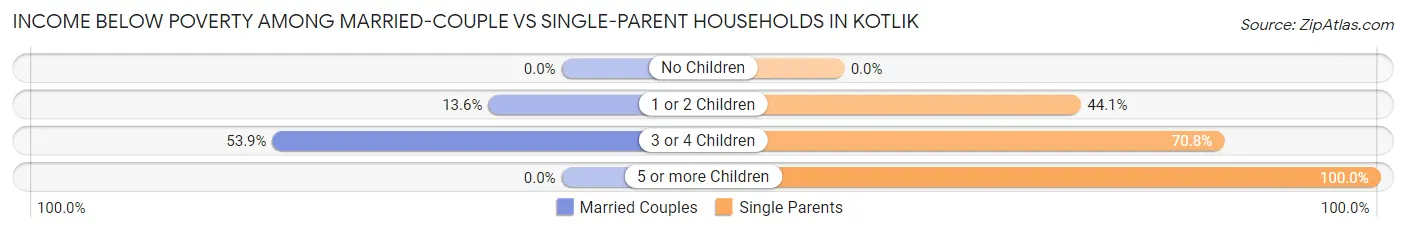
| Children | Married-Couple Families | Single-Parent Households |
| No Children | 0 (0.0%) | 0 (0.0%) |
| 1 or 2 Children | 3 (13.6%) | 41 (44.1%) |
| 3 or 4 Children | 14 (53.8%) | 17 (70.8%) |
| 5 or more Children | 0 (0.0%) | 11 (100.0%) |
| Total | 17 (25.4%) | 69 (52.3%) |
Race in Kotlik
The most populous races in Kotlik are Native / Alaskan (1,249 | 98.2%), Two or more Races (15 | 1.2%), and Asian (4 | 0.3%).
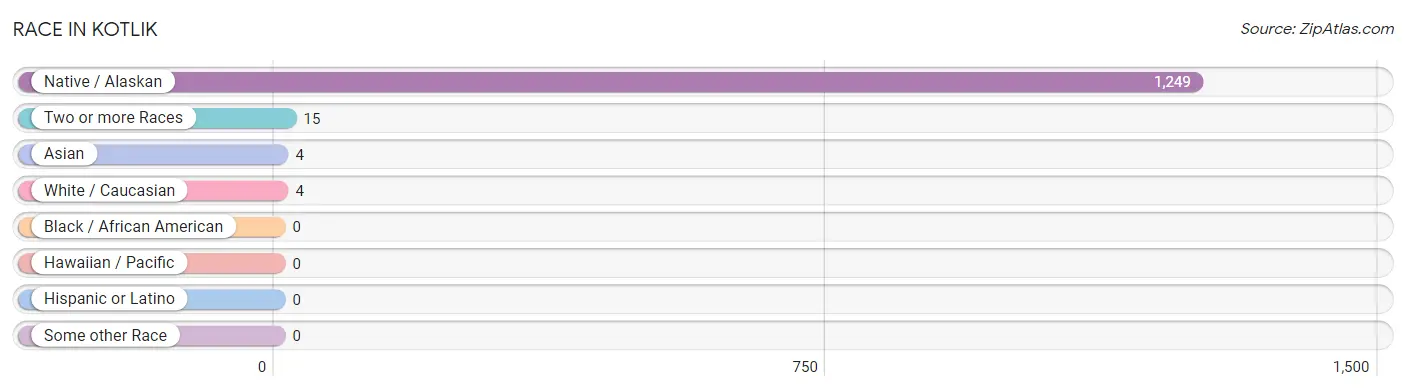
| Race | # Population | % Population |
| Asian | 4 | 0.3% |
| Black / African American | 0 | 0.0% |
| Hawaiian / Pacific | 0 | 0.0% |
| Hispanic or Latino | 0 | 0.0% |
| Native / Alaskan | 1,249 | 98.2% |
| White / Caucasian | 4 | 0.3% |
| Two or more Races | 15 | 1.2% |
| Some other Race | 0 | 0.0% |
| Total | 1,272 | 100.0% |
Ancestry in Kotlik
The most populous ancestries reported in Kotlik are Yup'ik (1,016 | 79.9%), Alaska Native (194 | 15.2%), Inupiat (56 | 4.4%), Korean (8 | 0.6%), and Navajo (4 | 0.3%), together accounting for 100.5% of all Kotlik residents.
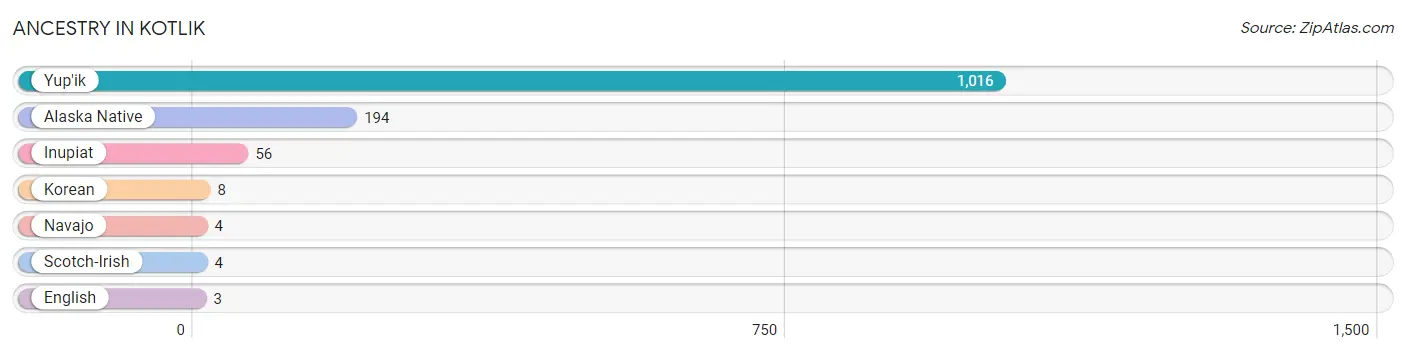
| Ancestry | # Population | % Population |
| Alaska Native | 194 | 15.2% |
| English | 3 | 0.2% |
| Inupiat | 56 | 4.4% |
| Korean | 8 | 0.6% |
| Navajo | 4 | 0.3% |
| Scotch-Irish | 4 | 0.3% |
| Yup'ik | 1,016 | 79.9% | View All 7 Rows |
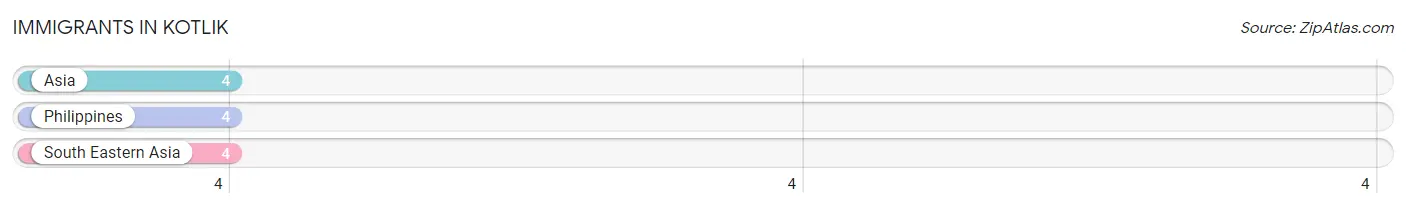
Immigrants in Kotlik
The most numerous immigrant groups reported in Kotlik came from Asia (4 | 0.3%), Philippines (4 | 0.3%), and South Eastern Asia (4 | 0.3%), together accounting for 0.9% of all Kotlik residents.
| Immigration Origin | # Population | % Population |
| Asia | 4 | 0.3% |
| Philippines | 4 | 0.3% |
| South Eastern Asia | 4 | 0.3% | View All 3 Rows |
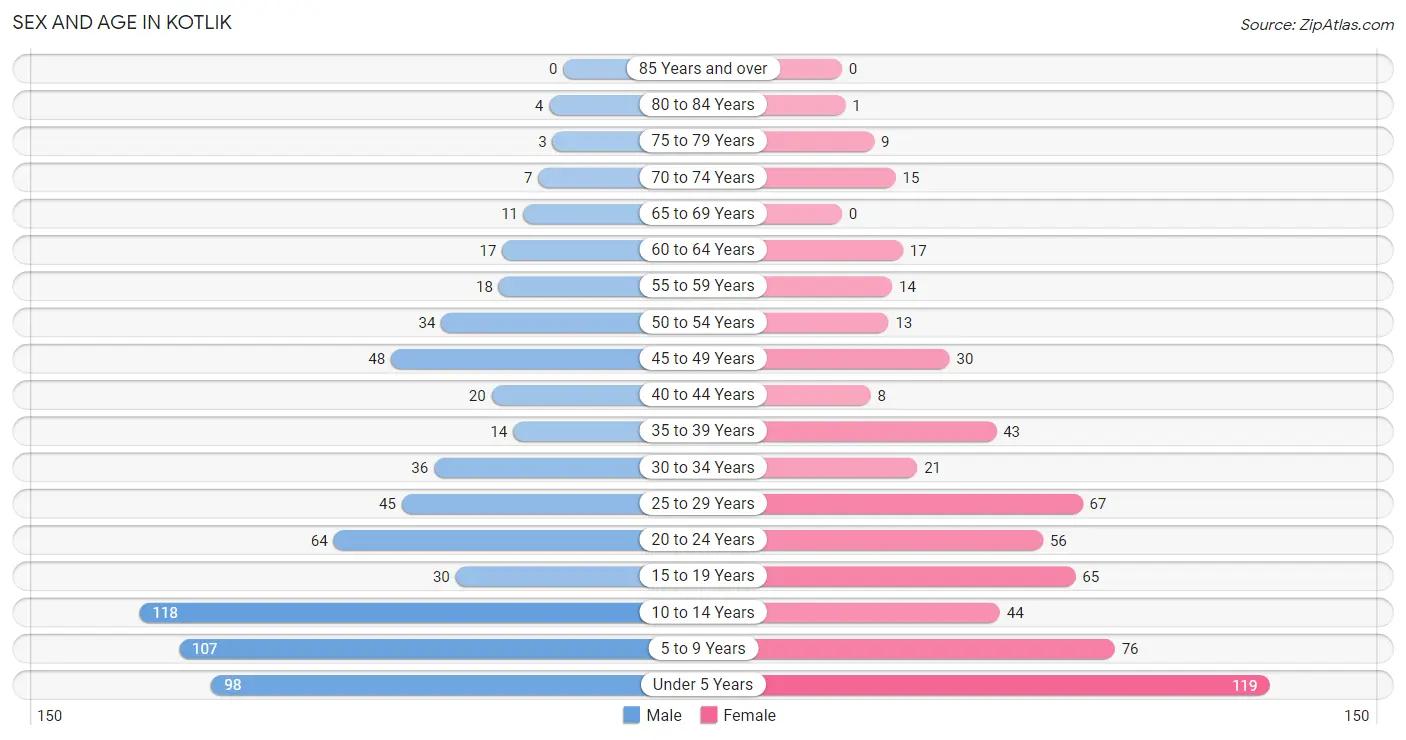
Sex and Age in Kotlik
Sex and Age in Kotlik
The most populous age groups in Kotlik are 10 to 14 Years (118 | 17.5%) for men and Under 5 Years (119 | 19.9%) for women.
| Age Bracket | Male | Female |
| Under 5 Years | 98 (14.5%) | 119 (19.9%) |
| 5 to 9 Years | 107 (15.9%) | 76 (12.7%) |
| 10 to 14 Years | 118 (17.5%) | 44 (7.4%) |
| 15 to 19 Years | 30 (4.4%) | 65 (10.9%) |
| 20 to 24 Years | 64 (9.5%) | 56 (9.4%) |
| 25 to 29 Years | 45 (6.7%) | 67 (11.2%) |
| 30 to 34 Years | 36 (5.3%) | 21 (3.5%) |
| 35 to 39 Years | 14 (2.1%) | 43 (7.2%) |
| 40 to 44 Years | 20 (3.0%) | 8 (1.3%) |
| 45 to 49 Years | 48 (7.1%) | 30 (5.0%) |
| 50 to 54 Years | 34 (5.0%) | 13 (2.2%) |
| 55 to 59 Years | 18 (2.7%) | 14 (2.3%) |
| 60 to 64 Years | 17 (2.5%) | 17 (2.8%) |
| 65 to 69 Years | 11 (1.6%) | 0 (0.0%) |
| 70 to 74 Years | 7 (1.0%) | 15 (2.5%) |
| 75 to 79 Years | 3 (0.4%) | 9 (1.5%) |
| 80 to 84 Years | 4 (0.6%) | 1 (0.2%) |
| 85 Years and over | 0 (0.0%) | 0 (0.0%) |
| Total | 674 (100.0%) | 598 (100.0%) |
Families and Households in Kotlik
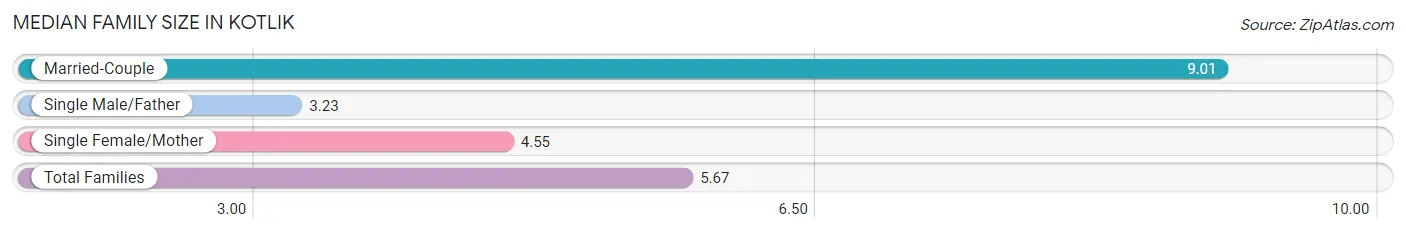
Median Family Size in Kotlik
The median family size in Kotlik is 5.67 persons per family, with married-couple families (67 | 33.7%) accounting for the largest median family size of 9.01 persons per family. On the other hand, single male/father families (57 | 28.6%) represent the smallest median family size with 3.23 persons per family.
| Family Type | # Families | Family Size |
| Married-Couple | 67 (33.7%) | 9.01 |
| Single Male/Father | 57 (28.6%) | 3.23 |
| Single Female/Mother | 75 (37.7%) | 4.55 |
| Total Families | 199 (100.0%) | 5.67 |
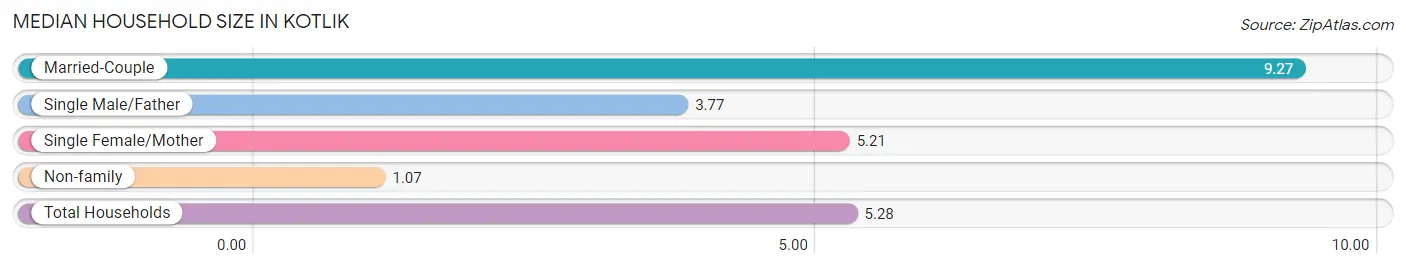
Median Household Size in Kotlik
The median household size in Kotlik is 5.28 persons per household, with married-couple households (67 | 27.8%) accounting for the largest median household size of 9.27 persons per household. non-family households (42 | 17.4%) represent the smallest median household size with 1.07 persons per household.
| Household Type | # Households | Household Size |
| Married-Couple | 67 (27.8%) | 9.27 |
| Single Male/Father | 57 (23.6%) | 3.77 |
| Single Female/Mother | 75 (31.1%) | 5.21 |
| Non-family | 42 (17.4%) | 1.07 |
| Total Households | 241 (100.0%) | 5.28 |
Household Size by Marriage Status in Kotlik
Out of a total of 241 households in Kotlik, 199 (82.6%) are family households, while 42 (17.4%) are nonfamily households. The most numerous type of family households are 3-person households, comprising 77, and the most common type of nonfamily households are 1-person households, comprising 35.
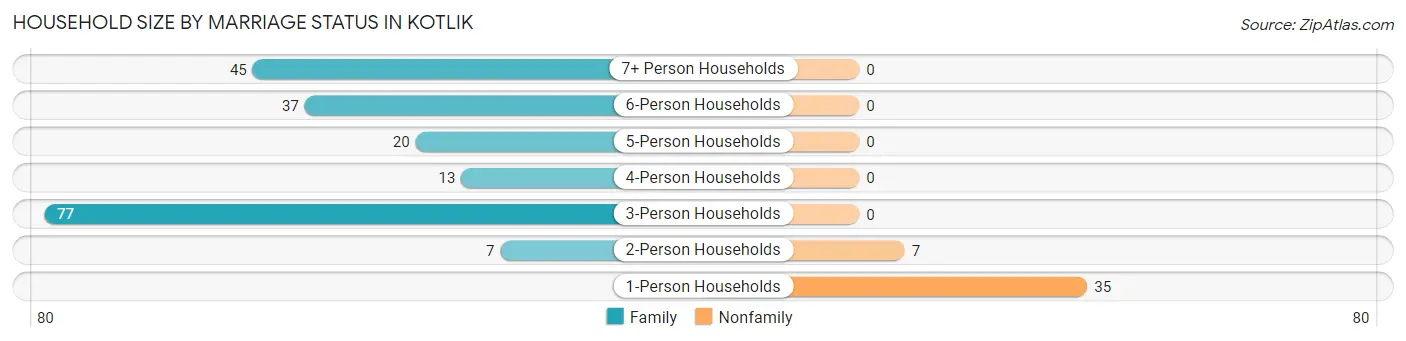
| Household Size | Family Households | Nonfamily Households |
| 1-Person Households | - | 35 (14.5%) |
| 2-Person Households | 7 (2.9%) | 7 (2.9%) |
| 3-Person Households | 77 (32.0%) | 0 (0.0%) |
| 4-Person Households | 13 (5.4%) | 0 (0.0%) |
| 5-Person Households | 20 (8.3%) | 0 (0.0%) |
| 6-Person Households | 37 (15.3%) | 0 (0.0%) |
| 7+ Person Households | 45 (18.7%) | 0 (0.0%) |
| Total | 199 (82.6%) | 42 (17.4%) |
Female Fertility in Kotlik
Fertility by Age in Kotlik
Average fertility rate in Kotlik is 190.0 births per 1,000 women. Women in the age bracket of 20 to 34 years have the highest fertility rate with 264.0 births per 1,000 women. Women in the age bracket of 20 to 34 years acount for 69.1% of all women with births.
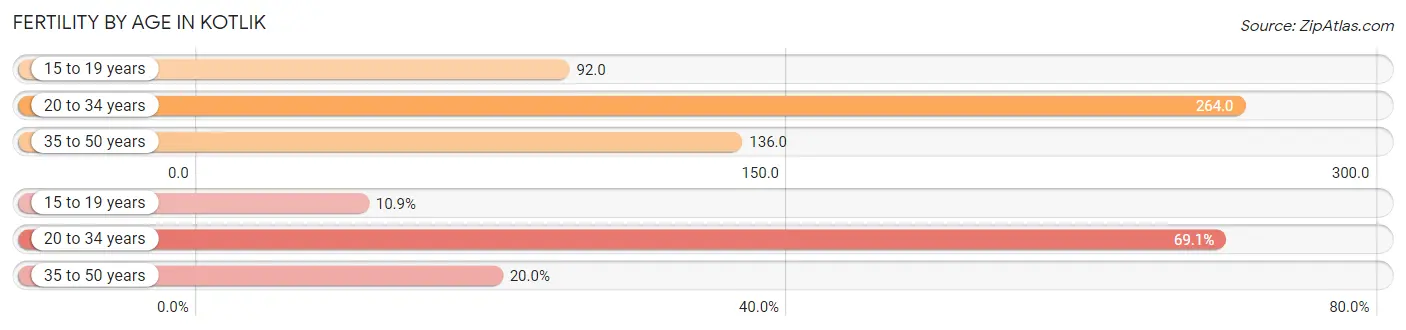
| Age Bracket | Women with Births | Births / 1,000 Women |
| 15 to 19 years | 6 (10.9%) | 92.0 |
| 20 to 34 years | 38 (69.1%) | 264.0 |
| 35 to 50 years | 11 (20.0%) | 136.0 |
| Total | 55 (100.0%) | 190.0 |
Fertility by Age by Marriage Status in Kotlik
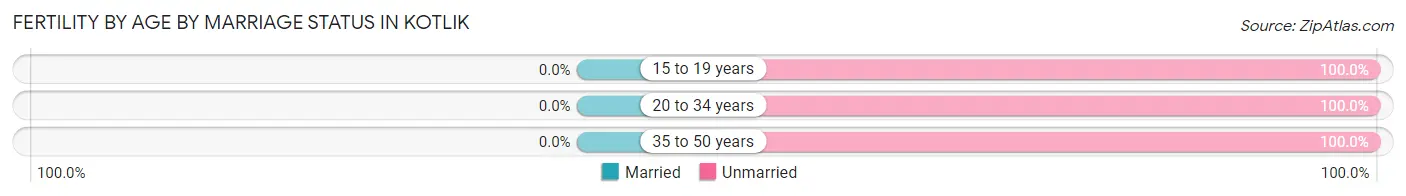
| Age Bracket | Married | Unmarried |
| 15 to 19 years | 0 (0.0%) | 6 (100.0%) |
| 20 to 34 years | 0 (0.0%) | 38 (100.0%) |
| 35 to 50 years | 0 (0.0%) | 11 (100.0%) |
| Total | 0 (0.0%) | 55 (100.0%) |
Fertility by Education in Kotlik
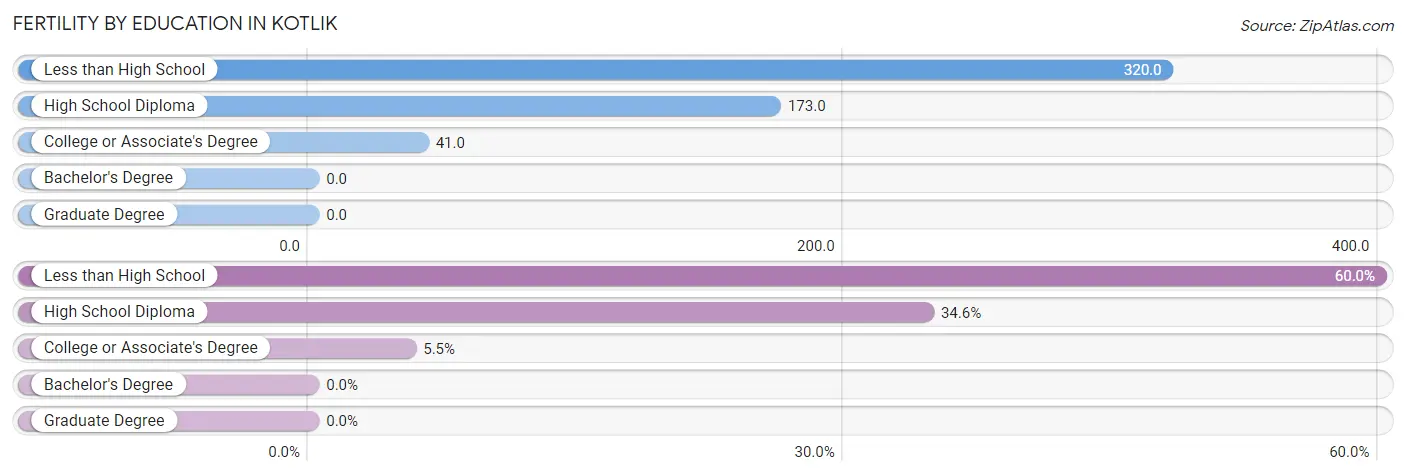
| Educational Attainment | Women with Births | Births / 1,000 Women |
| Less than High School | 33 (60.0%) | 320.0 |
| High School Diploma | 19 (34.5%) | 173.0 |
| College or Associate's Degree | 3 (5.4%) | 41.0 |
| Bachelor's Degree | 0 (0.0%) | 0.0 |
| Graduate Degree | 0 (0.0%) | 0.0 |
| Total | 55 (100.0%) | 190.0 |
Fertility by Education by Marriage Status in Kotlik
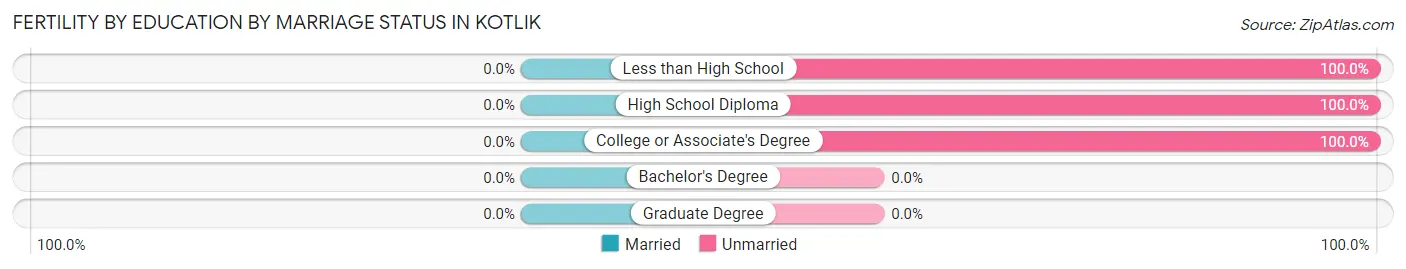
| Educational Attainment | Married | Unmarried |
| Less than High School | 0 (0.0%) | 33 (100.0%) |
| High School Diploma | 0 (0.0%) | 19 (100.0%) |
| College or Associate's Degree | 0 (0.0%) | 3 (100.0%) |
| Bachelor's Degree | 0 (0.0%) | 0 (0.0%) |
| Graduate Degree | 0 (0.0%) | 0 (0.0%) |
| Total | 0 (0.0%) | 55 (100.0%) |
Employment Characteristics in Kotlik
Employment by Class of Employer in Kotlik
Among the 322 employed individuals in Kotlik, local government employees (186 | 57.8%), not-for-profit organizations (47 | 14.6%), and state government employees (47 | 14.6%) make up the most common classes of employment.
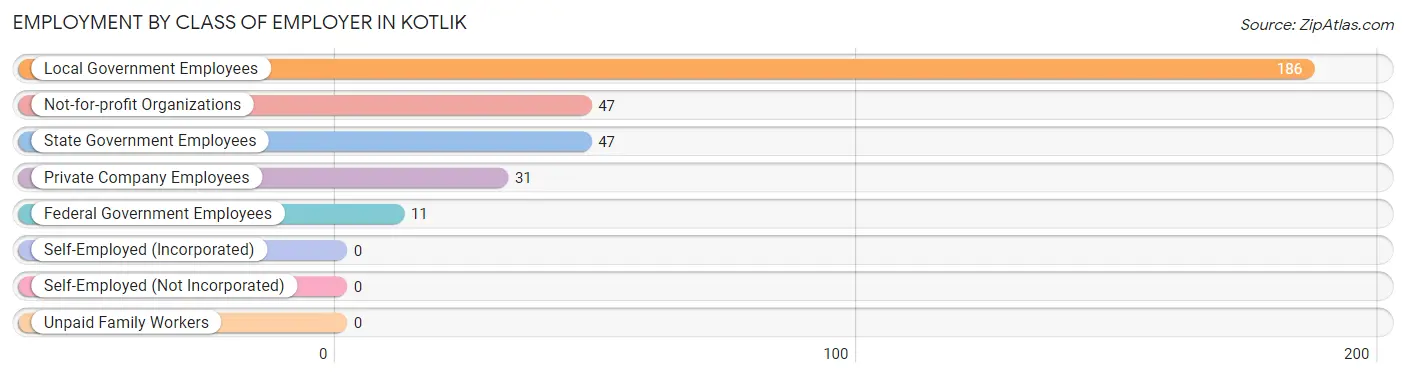
| Employer Class | # Employees | % Employees |
| Private Company Employees | 31 | 9.6% |
| Self-Employed (Incorporated) | 0 | 0.0% |
| Self-Employed (Not Incorporated) | 0 | 0.0% |
| Not-for-profit Organizations | 47 | 14.6% |
| Local Government Employees | 186 | 57.8% |
| State Government Employees | 47 | 14.6% |
| Federal Government Employees | 11 | 3.4% |
| Unpaid Family Workers | 0 | 0.0% |
| Total | 322 | 100.0% |
Employment Status by Age in Kotlik
According to the labor force statistics for Kotlik, out of the total population over 16 years of age (691), 60.1% or 415 individuals are in the labor force, with 22.4% or 93 of them unemployed. The age group with the highest labor force participation rate is 30 to 34 years, with 80.7% or 46 individuals in the labor force. Within the labor force, the 16 to 19 years age range has the highest percentage of unemployed individuals, with 100.0% or 9 of them being unemployed.
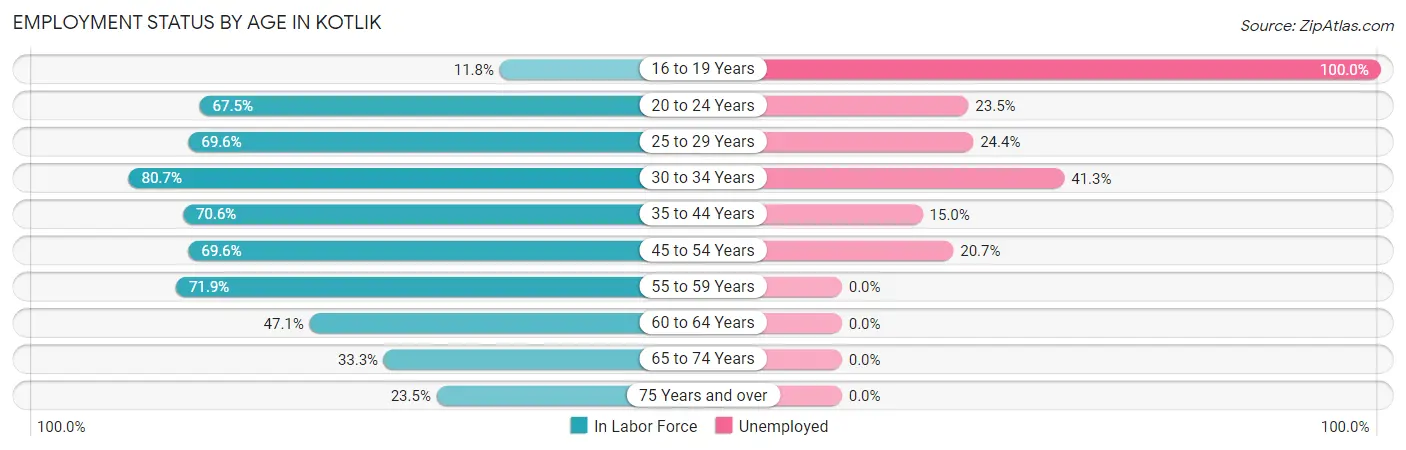
| Age Bracket | In Labor Force | Unemployed |
| 16 to 19 Years | 9 (11.8%) | 9 (100.0%) |
| 20 to 24 Years | 81 (67.5%) | 19 (23.5%) |
| 25 to 29 Years | 78 (69.6%) | 19 (24.4%) |
| 30 to 34 Years | 46 (80.7%) | 19 (41.3%) |
| 35 to 44 Years | 60 (70.6%) | 9 (15.0%) |
| 45 to 54 Years | 87 (69.6%) | 18 (20.7%) |
| 55 to 59 Years | 23 (71.9%) | 0 (0.0%) |
| 60 to 64 Years | 16 (47.1%) | 0 (0.0%) |
| 65 to 74 Years | 11 (33.3%) | 0 (0.0%) |
| 75 Years and over | 4 (23.5%) | 0 (0.0%) |
| Total | 415 (60.1%) | 93 (22.4%) |
Employment Status by Educational Attainment in Kotlik
According to labor force statistics for Kotlik, 69.7% of individuals (310) out of the total population between 25 and 64 years of age (445) are in the labor force, with 21.0% or 65 of them being unemployed. The group with the highest labor force participation rate are those with the educational attainment of bachelor's degree or higher, with 100.0% or 4 individuals in the labor force. Within the labor force, individuals with less than high school education have the highest percentage of unemployment, with 27.6% or 8 of them being unemployed.
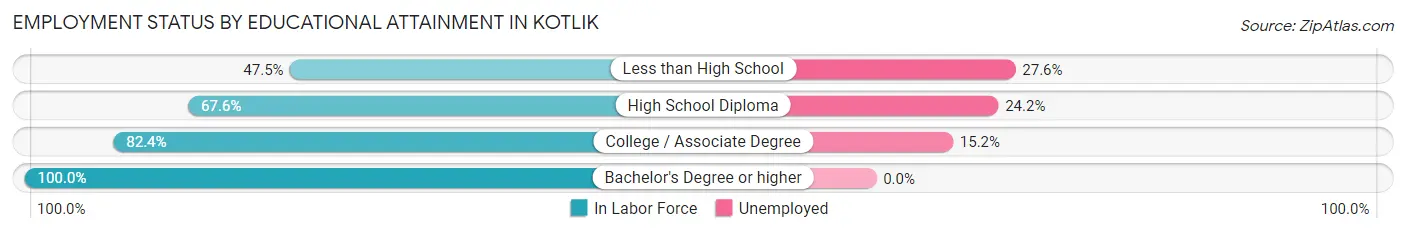
| Educational Attainment | In Labor Force | Unemployed |
| Less than High School | 29 (47.5%) | 17 (27.6%) |
| High School Diploma | 165 (67.6%) | 59 (24.2%) |
| College / Associate Degree | 112 (82.4%) | 21 (15.2%) |
| Bachelor's Degree or higher | 4 (100.0%) | 0 (0.0%) |
| Total | 310 (69.7%) | 93 (21.0%) |
Employment Occupations by Sex in Kotlik
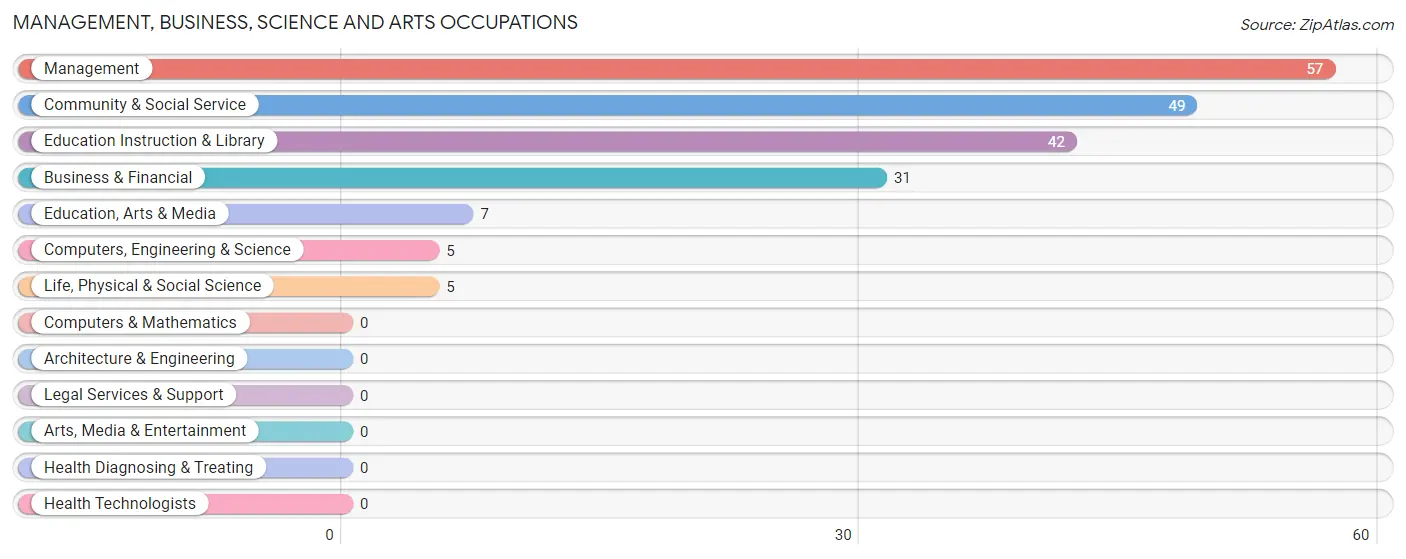
Management, Business, Science and Arts Occupations
The most common Management, Business, Science and Arts occupations in Kotlik are Management (57 | 17.7%), Community & Social Service (49 | 15.2%), Education Instruction & Library (42 | 13.0%), Business & Financial (31 | 9.6%), and Education, Arts & Media (7 | 2.2%).
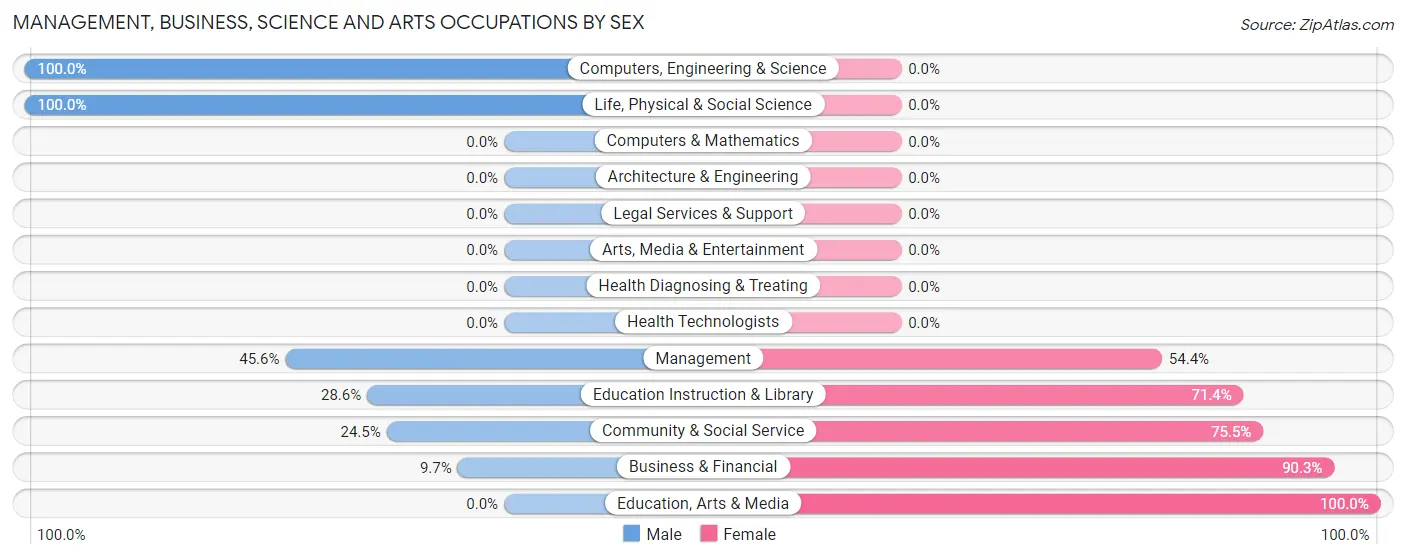
Management, Business, Science and Arts Occupations by Sex
Within the Management, Business, Science and Arts occupations in Kotlik, the most male-oriented occupations are Computers, Engineering & Science (100.0%), Life, Physical & Social Science (100.0%), and Management (45.6%), while the most female-oriented occupations are Education, Arts & Media (100.0%), Business & Financial (90.3%), and Community & Social Service (75.5%).
| Occupation | Male | Female |
| Management | 26 (45.6%) | 31 (54.4%) |
| Business & Financial | 3 (9.7%) | 28 (90.3%) |
| Computers, Engineering & Science | 5 (100.0%) | 0 (0.0%) |
| Computers & Mathematics | 0 (0.0%) | 0 (0.0%) |
| Architecture & Engineering | 0 (0.0%) | 0 (0.0%) |
| Life, Physical & Social Science | 5 (100.0%) | 0 (0.0%) |
| Community & Social Service | 12 (24.5%) | 37 (75.5%) |
| Education, Arts & Media | 0 (0.0%) | 7 (100.0%) |
| Legal Services & Support | 0 (0.0%) | 0 (0.0%) |
| Education Instruction & Library | 12 (28.6%) | 30 (71.4%) |
| Arts, Media & Entertainment | 0 (0.0%) | 0 (0.0%) |
| Health Diagnosing & Treating | 0 (0.0%) | 0 (0.0%) |
| Health Technologists | 0 (0.0%) | 0 (0.0%) |
| Total (Category) | 46 (32.4%) | 96 (67.6%) |
| Total (Overall) | 142 (44.1%) | 180 (55.9%) |
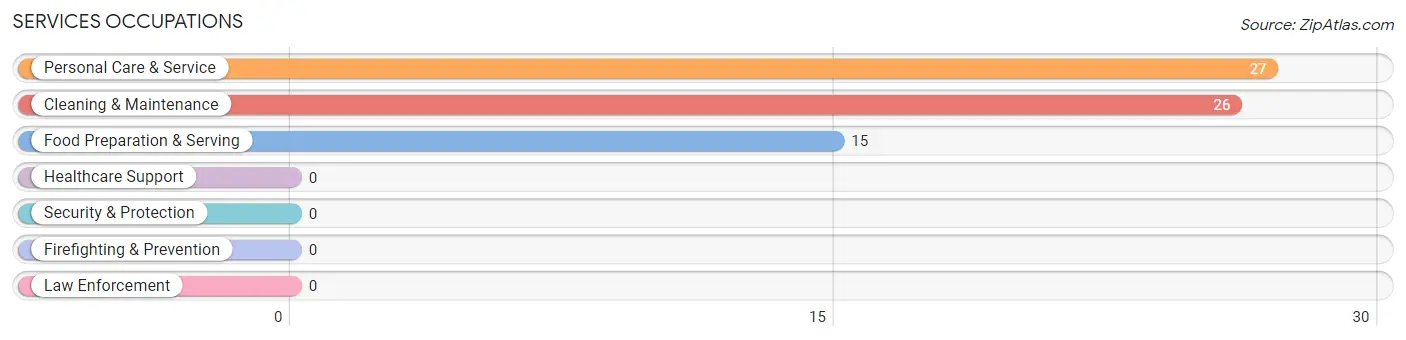
Services Occupations
The most common Services occupations in Kotlik are Personal Care & Service (27 | 8.4%), Cleaning & Maintenance (26 | 8.1%), and Food Preparation & Serving (15 | 4.7%).
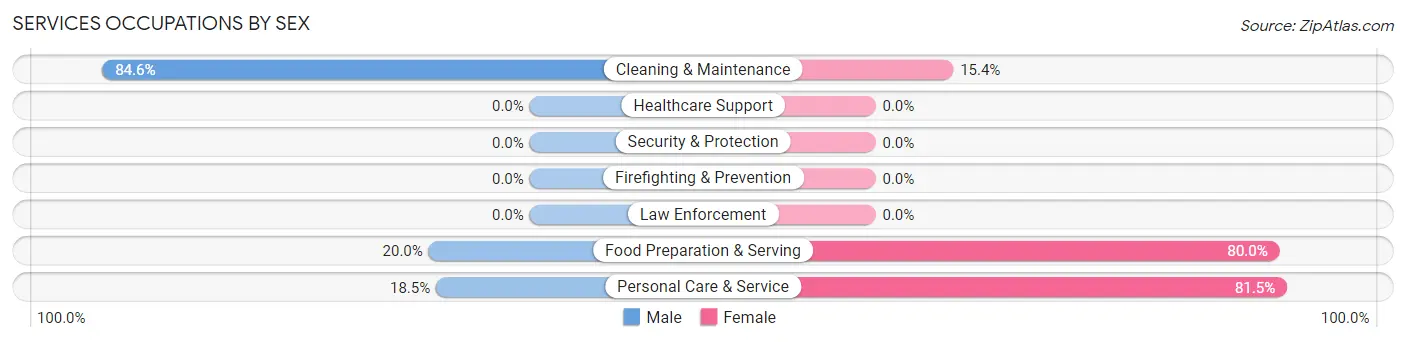
Services Occupations by Sex
Within the Services occupations in Kotlik, the most male-oriented occupations are Cleaning & Maintenance (84.6%), Food Preparation & Serving (20.0%), and Personal Care & Service (18.5%), while the most female-oriented occupations are Personal Care & Service (81.5%), Food Preparation & Serving (80.0%), and Cleaning & Maintenance (15.4%).
| Occupation | Male | Female |
| Healthcare Support | 0 (0.0%) | 0 (0.0%) |
| Security & Protection | 0 (0.0%) | 0 (0.0%) |
| Firefighting & Prevention | 0 (0.0%) | 0 (0.0%) |
| Law Enforcement | 0 (0.0%) | 0 (0.0%) |
| Food Preparation & Serving | 3 (20.0%) | 12 (80.0%) |
| Cleaning & Maintenance | 22 (84.6%) | 4 (15.4%) |
| Personal Care & Service | 5 (18.5%) | 22 (81.5%) |
| Total (Category) | 30 (44.1%) | 38 (55.9%) |
| Total (Overall) | 142 (44.1%) | 180 (55.9%) |
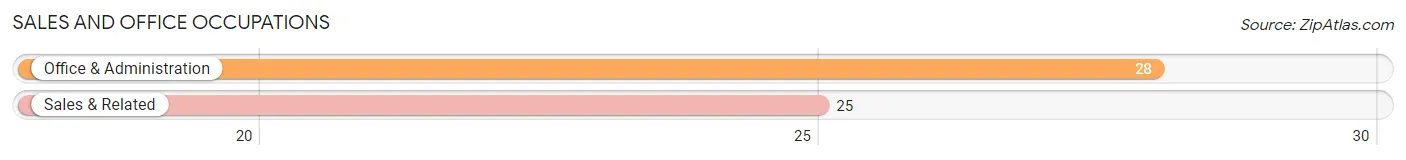
Sales and Office Occupations
The most common Sales and Office occupations in Kotlik are Office & Administration (28 | 8.7%), and Sales & Related (25 | 7.8%).
Sales and Office Occupations by Sex
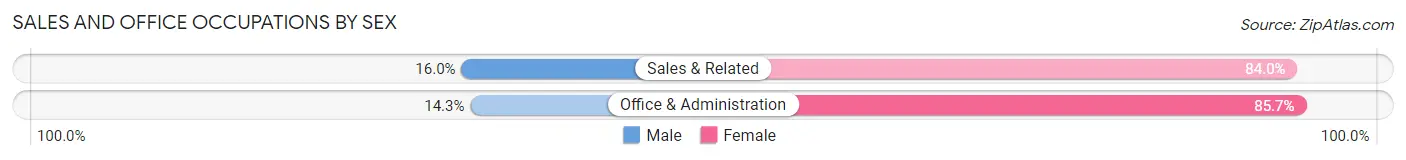
| Occupation | Male | Female |
| Sales & Related | 4 (16.0%) | 21 (84.0%) |
| Office & Administration | 4 (14.3%) | 24 (85.7%) |
| Total (Category) | 8 (15.1%) | 45 (84.9%) |
| Total (Overall) | 142 (44.1%) | 180 (55.9%) |
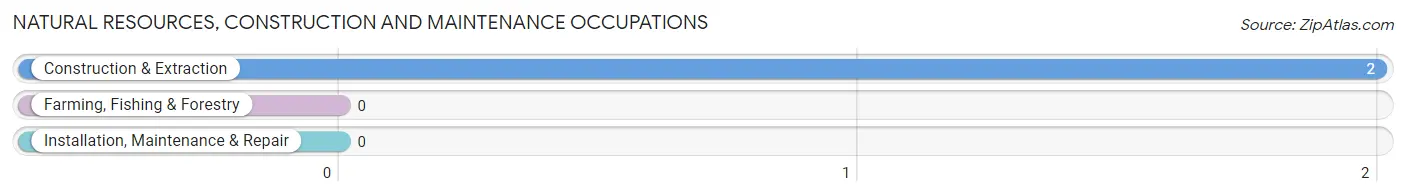
Natural Resources, Construction and Maintenance Occupations
The most common Natural Resources, Construction and Maintenance occupations in Kotlik are , and Construction & Extraction (2 | 0.6%).
Natural Resources, Construction and Maintenance Occupations by Sex
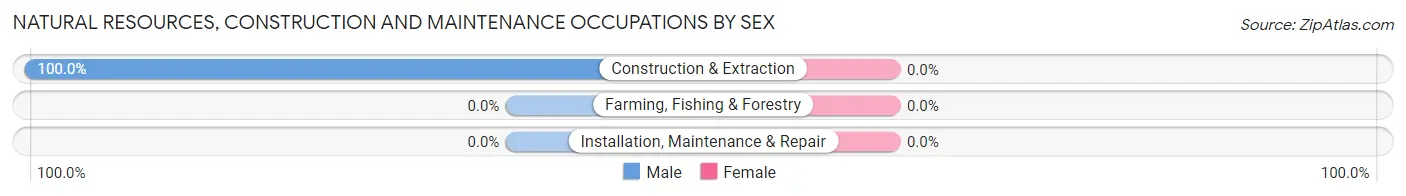
| Occupation | Male | Female |
| Farming, Fishing & Forestry | 0 (0.0%) | 0 (0.0%) |
| Construction & Extraction | 2 (100.0%) | 0 (0.0%) |
| Installation, Maintenance & Repair | 0 (0.0%) | 0 (0.0%) |
| Total (Category) | 2 (100.0%) | 0 (0.0%) |
| Total (Overall) | 142 (44.1%) | 180 (55.9%) |
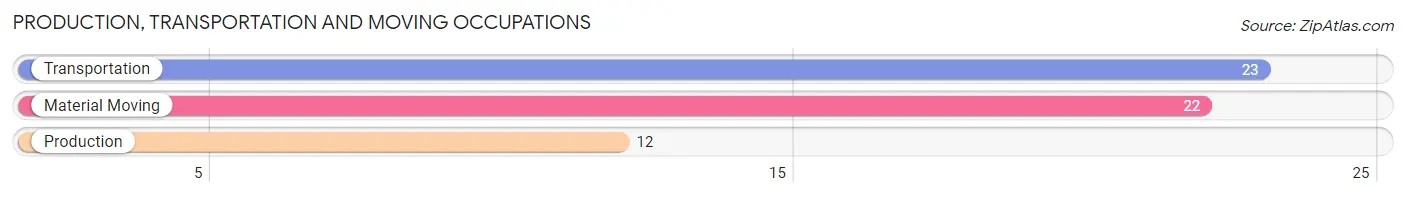
Production, Transportation and Moving Occupations
The most common Production, Transportation and Moving occupations in Kotlik are Transportation (23 | 7.1%), Material Moving (22 | 6.8%), and Production (12 | 3.7%).
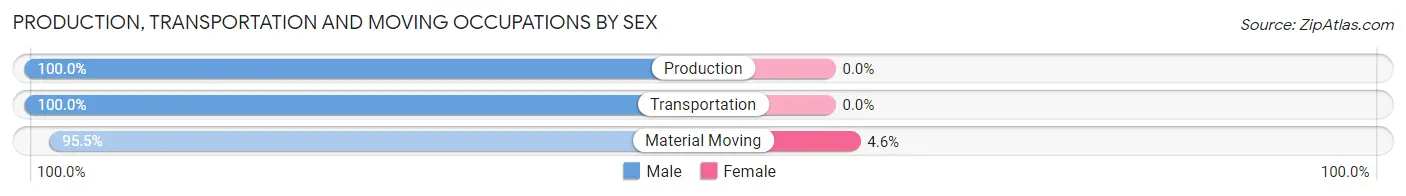
Production, Transportation and Moving Occupations by Sex
| Occupation | Male | Female |
| Production | 12 (100.0%) | 0 (0.0%) |
| Transportation | 23 (100.0%) | 0 (0.0%) |
| Material Moving | 21 (95.5%) | 1 (4.5%) |
| Total (Category) | 56 (98.3%) | 1 (1.8%) |
| Total (Overall) | 142 (44.1%) | 180 (55.9%) |
Employment Industries by Sex in Kotlik
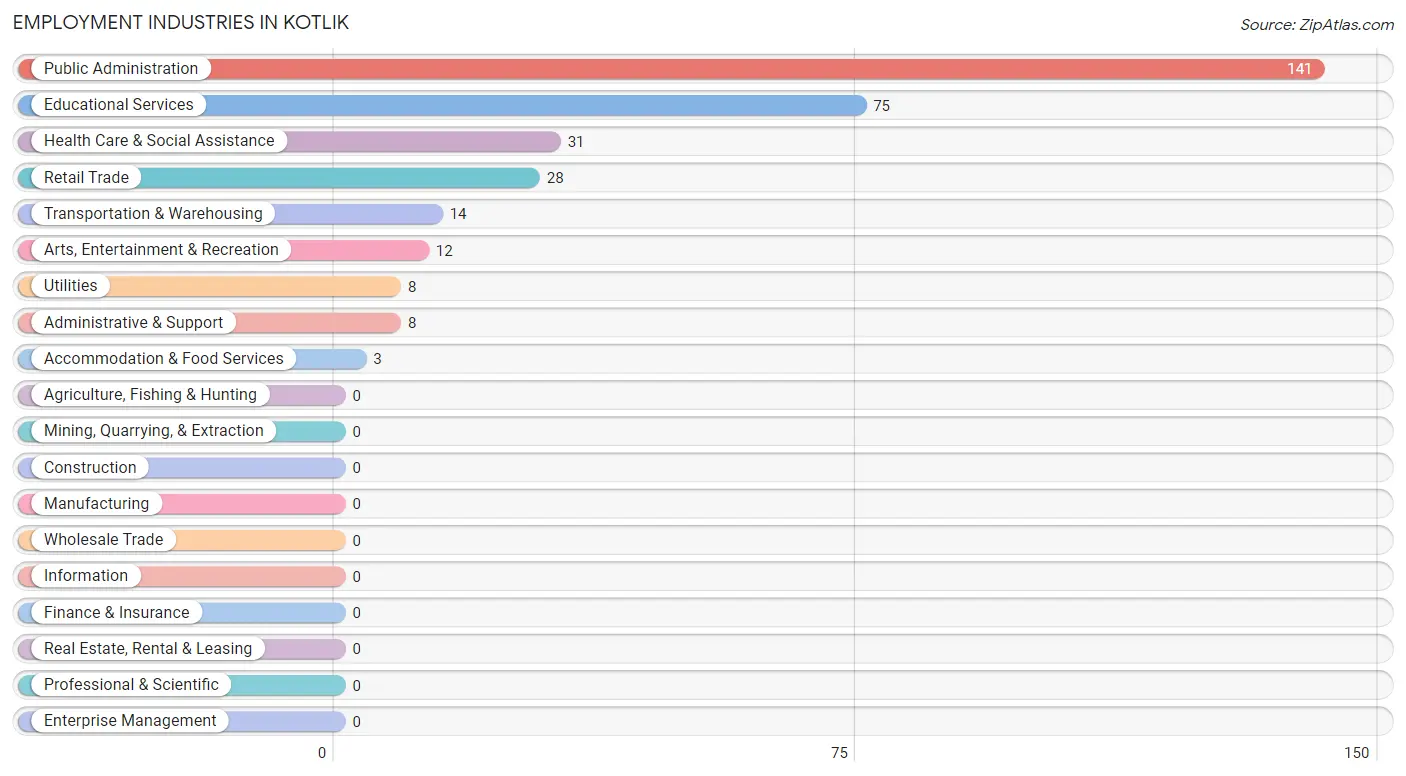
Employment Industries in Kotlik
The major employment industries in Kotlik include Public Administration (141 | 43.8%), Educational Services (75 | 23.3%), Health Care & Social Assistance (31 | 9.6%), Retail Trade (28 | 8.7%), and Transportation & Warehousing (14 | 4.3%).
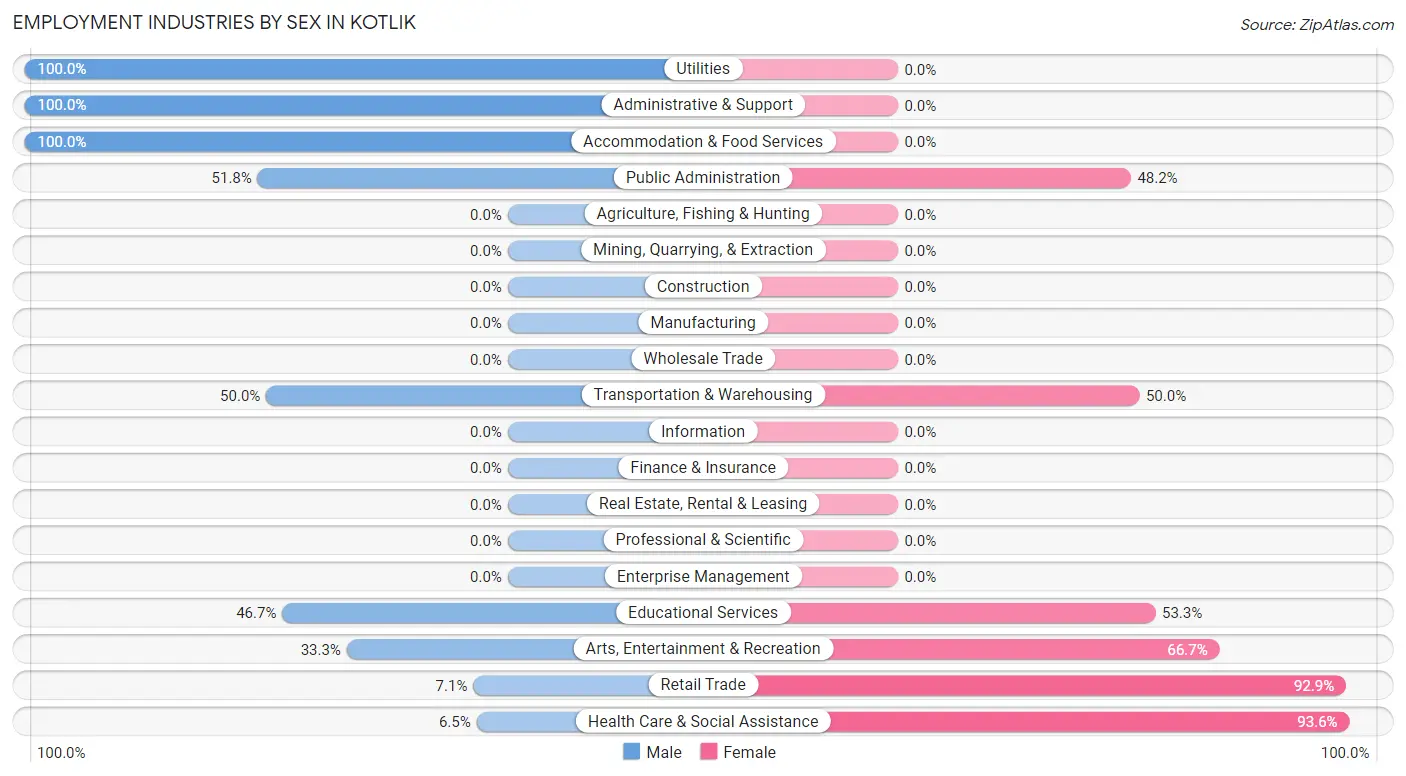
Employment Industries by Sex in Kotlik
The Kotlik industries that see more men than women are Utilities (100.0%), Administrative & Support (100.0%), and Accommodation & Food Services (100.0%), whereas the industries that tend to have a higher number of women are Health Care & Social Assistance (93.5%), Retail Trade (92.9%), and Arts, Entertainment & Recreation (66.7%).
| Industry | Male | Female |
| Agriculture, Fishing & Hunting | 0 (0.0%) | 0 (0.0%) |
| Mining, Quarrying, & Extraction | 0 (0.0%) | 0 (0.0%) |
| Construction | 0 (0.0%) | 0 (0.0%) |
| Manufacturing | 0 (0.0%) | 0 (0.0%) |
| Wholesale Trade | 0 (0.0%) | 0 (0.0%) |
| Retail Trade | 2 (7.1%) | 26 (92.9%) |
| Transportation & Warehousing | 7 (50.0%) | 7 (50.0%) |
| Utilities | 8 (100.0%) | 0 (0.0%) |
| Information | 0 (0.0%) | 0 (0.0%) |
| Finance & Insurance | 0 (0.0%) | 0 (0.0%) |
| Real Estate, Rental & Leasing | 0 (0.0%) | 0 (0.0%) |
| Professional & Scientific | 0 (0.0%) | 0 (0.0%) |
| Enterprise Management | 0 (0.0%) | 0 (0.0%) |
| Administrative & Support | 8 (100.0%) | 0 (0.0%) |
| Educational Services | 35 (46.7%) | 40 (53.3%) |
| Health Care & Social Assistance | 2 (6.5%) | 29 (93.5%) |
| Arts, Entertainment & Recreation | 4 (33.3%) | 8 (66.7%) |
| Accommodation & Food Services | 3 (100.0%) | 0 (0.0%) |
| Public Administration | 73 (51.8%) | 68 (48.2%) |
| Total | 142 (44.1%) | 180 (55.9%) |
Education in Kotlik
School Enrollment in Kotlik
The most common levels of schooling among the 474 students in Kotlik are elementary school (152 | 32.1%), middle school (145 | 30.6%), and high school (78 | 16.5%).
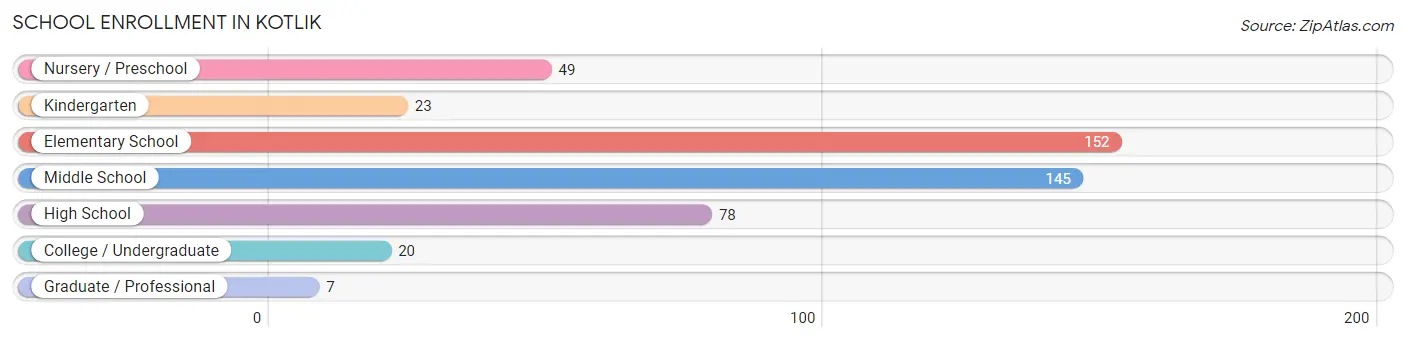
| School Level | # Students | % Students |
| Nursery / Preschool | 49 | 10.3% |
| Kindergarten | 23 | 4.9% |
| Elementary School | 152 | 32.1% |
| Middle School | 145 | 30.6% |
| High School | 78 | 16.5% |
| College / Undergraduate | 20 | 4.2% |
| Graduate / Professional | 7 | 1.5% |
| Total | 474 | 100.0% |
School Enrollment by Age by Funding Source in Kotlik
Out of a total of 474 students who are enrolled in schools in Kotlik, 8 (1.7%) attend a private institution, while the remaining 466 (98.3%) are enrolled in public schools. The age group of 25 to 34 year olds has the highest likelihood of being enrolled in private schools, with 4 (100.0% in the age bracket) enrolled. Conversely, the age group of 3 to 4 year olds has the lowest likelihood of being enrolled in a private school, with 34 (100.0% in the age bracket) attending a public institution.
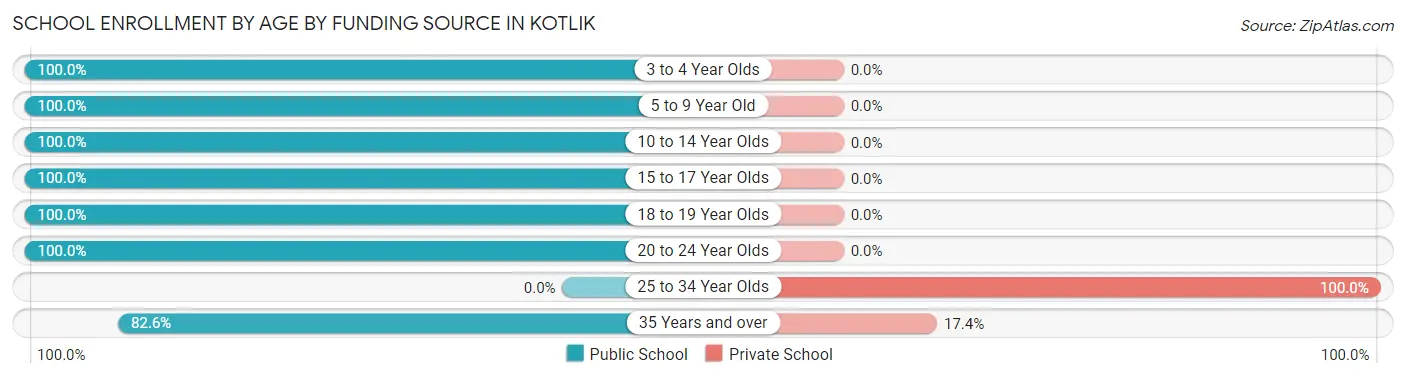
| Age Bracket | Public School | Private School |
| 3 to 4 Year Olds | 34 (100.0%) | 0 (0.0%) |
| 5 to 9 Year Old | 183 (100.0%) | 0 (0.0%) |
| 10 to 14 Year Olds | 158 (100.0%) | 0 (0.0%) |
| 15 to 17 Year Olds | 47 (100.0%) | 0 (0.0%) |
| 18 to 19 Year Olds | 21 (100.0%) | 0 (0.0%) |
| 20 to 24 Year Olds | 4 (100.0%) | 0 (0.0%) |
| 25 to 34 Year Olds | 0 (0.0%) | 4 (100.0%) |
| 35 Years and over | 19 (82.6%) | 4 (17.4%) |
| Total | 466 (98.3%) | 8 (1.7%) |
Educational Attainment by Field of Study in Kotlik
, and education (7 | 100.0%) are the most common fields of study among 7 individuals in Kotlik who have obtained a bachelor's degree or higher.
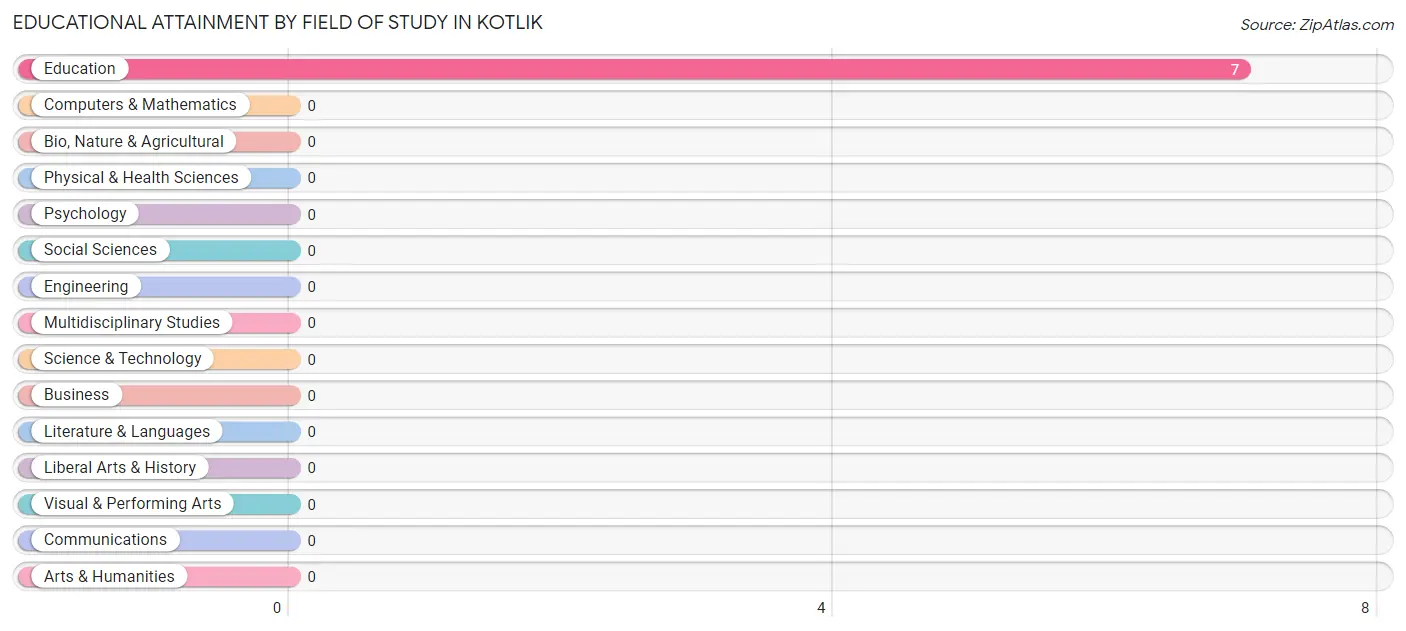
| Field of Study | # Graduates | % Graduates |
| Computers & Mathematics | 0 | 0.0% |
| Bio, Nature & Agricultural | 0 | 0.0% |
| Physical & Health Sciences | 0 | 0.0% |
| Psychology | 0 | 0.0% |
| Social Sciences | 0 | 0.0% |
| Engineering | 0 | 0.0% |
| Multidisciplinary Studies | 0 | 0.0% |
| Science & Technology | 0 | 0.0% |
| Business | 0 | 0.0% |
| Education | 7 | 100.0% |
| Literature & Languages | 0 | 0.0% |
| Liberal Arts & History | 0 | 0.0% |
| Visual & Performing Arts | 0 | 0.0% |
| Communications | 0 | 0.0% |
| Arts & Humanities | 0 | 0.0% |
| Total | 7 | 100.0% |
Transportation & Commute in Kotlik
Vehicle Availability by Sex in Kotlik
The most prevalent vehicle ownership categories in Kotlik are males with no vehicle (142, accounting for 100.0%) and females with no vehicle (180, making up 78.9%).
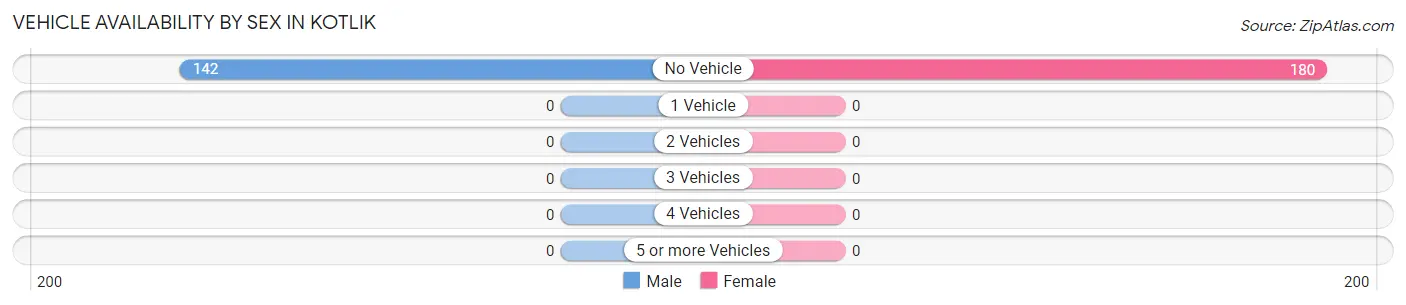
| Vehicles Available | Male | Female |
| No Vehicle | 142 (100.0%) | 180 (100.0%) |
| 1 Vehicle | 0 (0.0%) | 0 (0.0%) |
| 2 Vehicles | 0 (0.0%) | 0 (0.0%) |
| 3 Vehicles | 0 (0.0%) | 0 (0.0%) |
| 4 Vehicles | 0 (0.0%) | 0 (0.0%) |
| 5 or more Vehicles | 0 (0.0%) | 0 (0.0%) |
| Total | 142 (100.0%) | 180 (100.0%) |
Commute Time in Kotlik
The most frequently occuring commute durations in Kotlik are 5 to 9 minutes (185 commuters, 57.8%), less than 5 minutes (73 commuters, 22.8%), and 10 to 14 minutes (59 commuters, 18.4%).
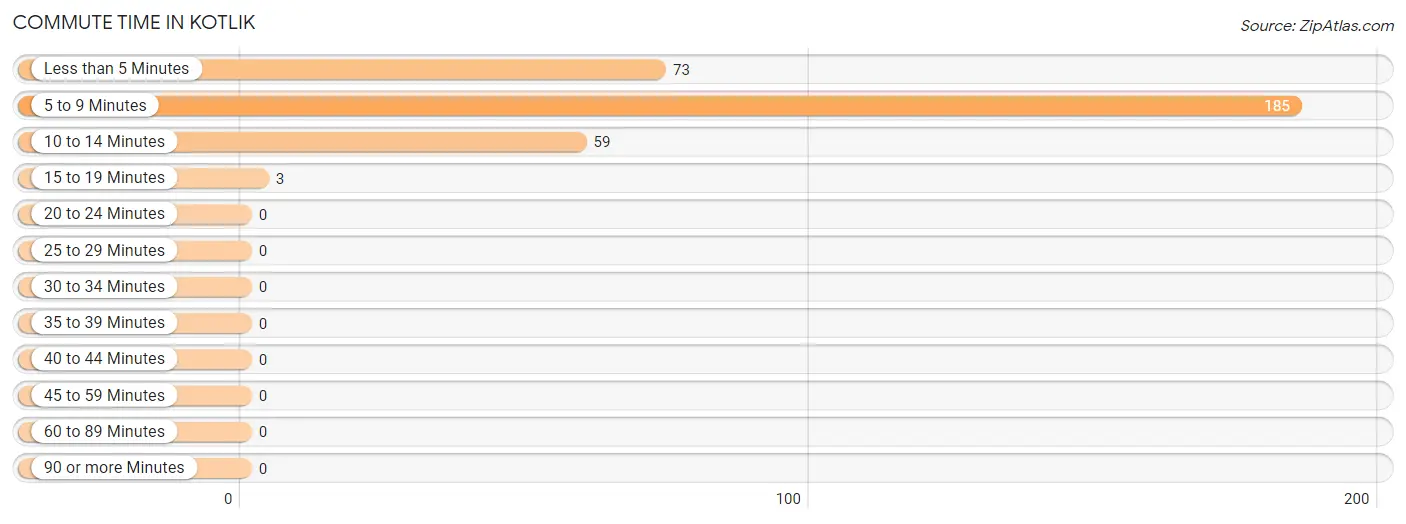
| Commute Time | # Commuters | % Commuters |
| Less than 5 Minutes | 73 | 22.8% |
| 5 to 9 Minutes | 185 | 57.8% |
| 10 to 14 Minutes | 59 | 18.4% |
| 15 to 19 Minutes | 3 | 0.9% |
| 20 to 24 Minutes | 0 | 0.0% |
| 25 to 29 Minutes | 0 | 0.0% |
| 30 to 34 Minutes | 0 | 0.0% |
| 35 to 39 Minutes | 0 | 0.0% |
| 40 to 44 Minutes | 0 | 0.0% |
| 45 to 59 Minutes | 0 | 0.0% |
| 60 to 89 Minutes | 0 | 0.0% |
| 90 or more Minutes | 0 | 0.0% |
Commute Time by Sex in Kotlik
The most common commute times in Kotlik are 5 to 9 minutes (70 commuters, 49.3%) for males and 5 to 9 minutes (115 commuters, 64.6%) for females.
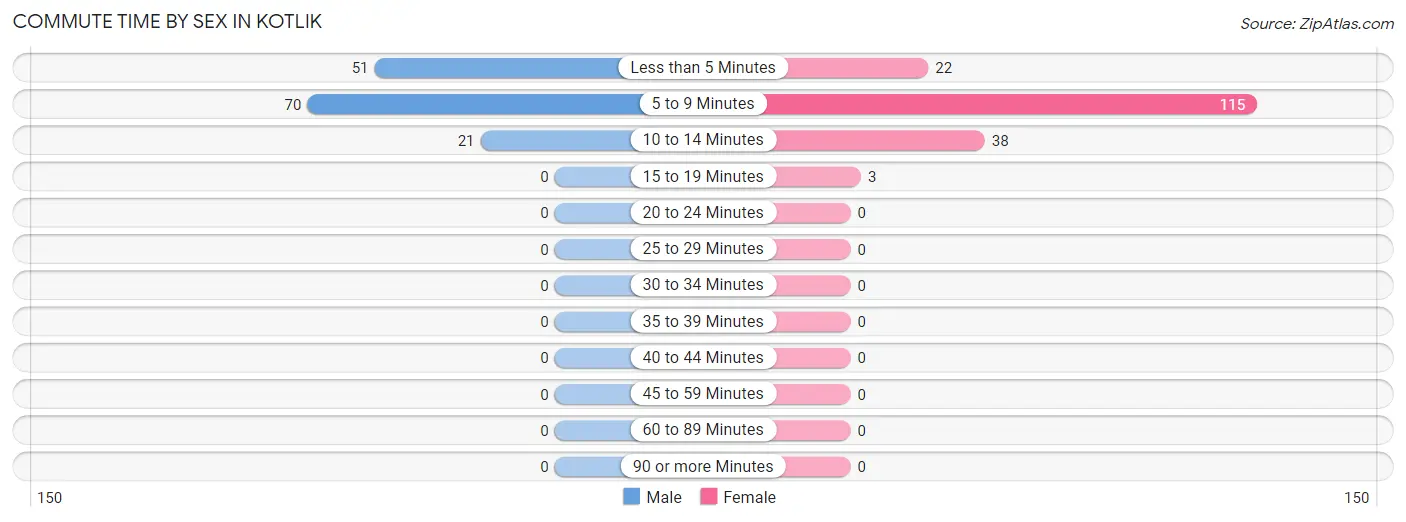
| Commute Time | Male | Female |
| Less than 5 Minutes | 51 (35.9%) | 22 (12.4%) |
| 5 to 9 Minutes | 70 (49.3%) | 115 (64.6%) |
| 10 to 14 Minutes | 21 (14.8%) | 38 (21.3%) |
| 15 to 19 Minutes | 0 (0.0%) | 3 (1.7%) |
| 20 to 24 Minutes | 0 (0.0%) | 0 (0.0%) |
| 25 to 29 Minutes | 0 (0.0%) | 0 (0.0%) |
| 30 to 34 Minutes | 0 (0.0%) | 0 (0.0%) |
| 35 to 39 Minutes | 0 (0.0%) | 0 (0.0%) |
| 40 to 44 Minutes | 0 (0.0%) | 0 (0.0%) |
| 45 to 59 Minutes | 0 (0.0%) | 0 (0.0%) |
| 60 to 89 Minutes | 0 (0.0%) | 0 (0.0%) |
| 90 or more Minutes | 0 (0.0%) | 0 (0.0%) |
Time of Departure to Work by Sex in Kotlik
The most frequent times of departure to work in Kotlik are 10:00 AM to 10:59 AM (30, 21.1%) for males and 9:00 AM to 9:59 AM (39, 21.9%) for females.
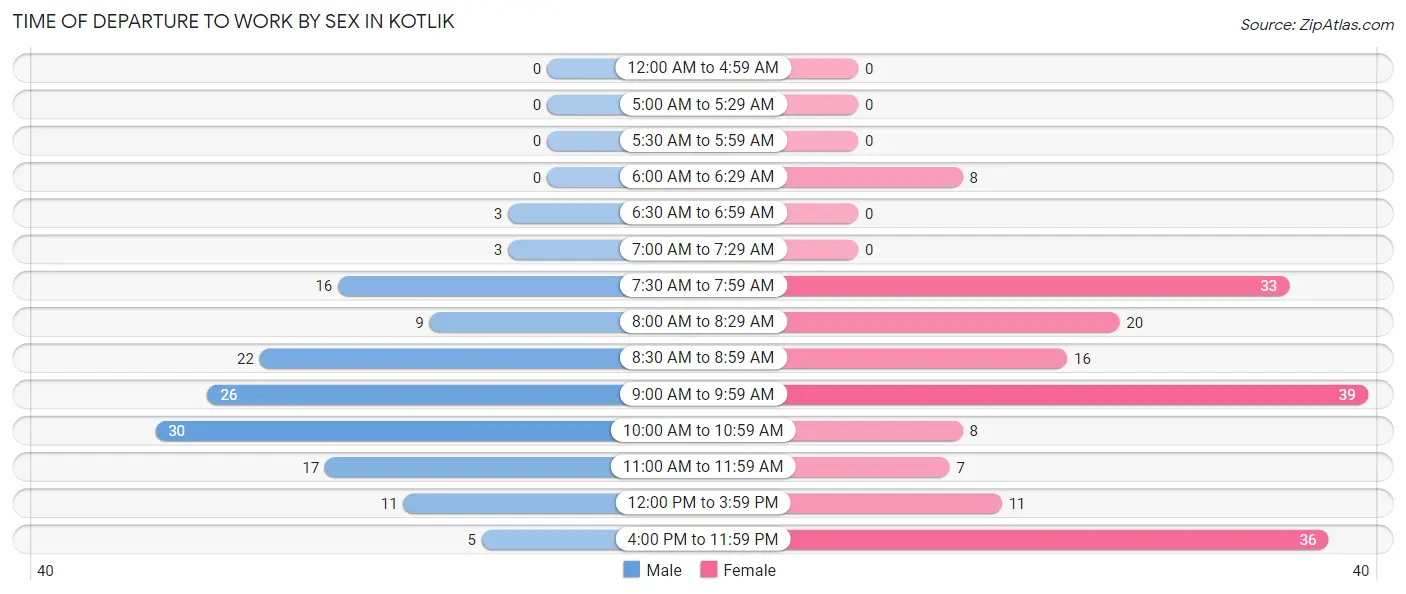
| Time of Departure | Male | Female |
| 12:00 AM to 4:59 AM | 0 (0.0%) | 0 (0.0%) |
| 5:00 AM to 5:29 AM | 0 (0.0%) | 0 (0.0%) |
| 5:30 AM to 5:59 AM | 0 (0.0%) | 0 (0.0%) |
| 6:00 AM to 6:29 AM | 0 (0.0%) | 8 (4.5%) |
| 6:30 AM to 6:59 AM | 3 (2.1%) | 0 (0.0%) |
| 7:00 AM to 7:29 AM | 3 (2.1%) | 0 (0.0%) |
| 7:30 AM to 7:59 AM | 16 (11.3%) | 33 (18.5%) |
| 8:00 AM to 8:29 AM | 9 (6.3%) | 20 (11.2%) |
| 8:30 AM to 8:59 AM | 22 (15.5%) | 16 (9.0%) |
| 9:00 AM to 9:59 AM | 26 (18.3%) | 39 (21.9%) |
| 10:00 AM to 10:59 AM | 30 (21.1%) | 8 (4.5%) |
| 11:00 AM to 11:59 AM | 17 (12.0%) | 7 (3.9%) |
| 12:00 PM to 3:59 PM | 11 (7.7%) | 11 (6.2%) |
| 4:00 PM to 11:59 PM | 5 (3.5%) | 36 (20.2%) |
| Total | 142 (100.0%) | 178 (100.0%) |
Housing Occupancy in Kotlik
Occupancy by Ownership in Kotlik
Of the total 241 dwellings in Kotlik, owner-occupied units account for 176 (73.0%), while renter-occupied units make up 65 (27.0%).
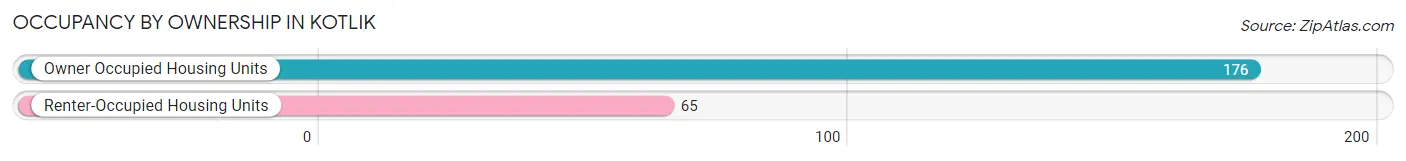
| Occupancy | # Housing Units | % Housing Units |
| Owner Occupied Housing Units | 176 | 73.0% |
| Renter-Occupied Housing Units | 65 | 27.0% |
| Total Occupied Housing Units | 241 | 100.0% |
Occupancy by Household Size in Kotlik
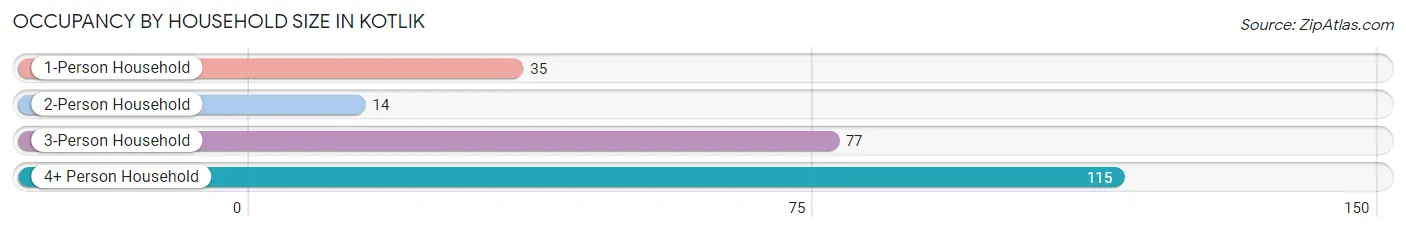
| Household Size | # Housing Units | % Housing Units |
| 1-Person Household | 35 | 14.5% |
| 2-Person Household | 14 | 5.8% |
| 3-Person Household | 77 | 32.0% |
| 4+ Person Household | 115 | 47.7% |
| Total Housing Units | 241 | 100.0% |
Occupancy by Ownership by Household Size in Kotlik
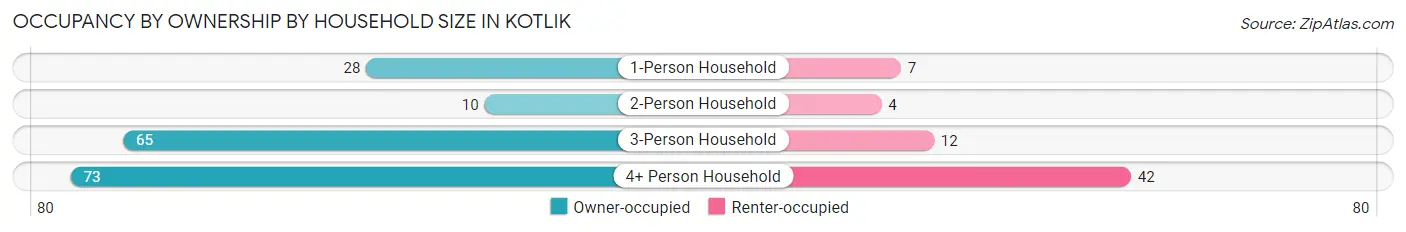
| Household Size | Owner-occupied | Renter-occupied |
| 1-Person Household | 28 (80.0%) | 7 (20.0%) |
| 2-Person Household | 10 (71.4%) | 4 (28.6%) |
| 3-Person Household | 65 (84.4%) | 12 (15.6%) |
| 4+ Person Household | 73 (63.5%) | 42 (36.5%) |
| Total Housing Units | 176 (73.0%) | 65 (27.0%) |
Occupancy by Educational Attainment in Kotlik
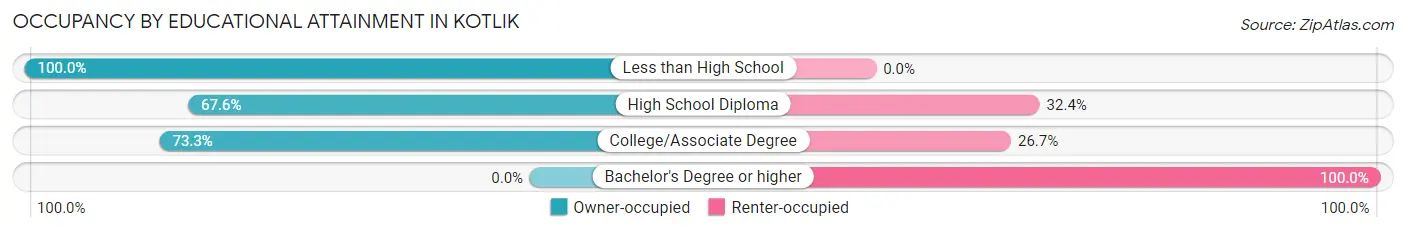
| Household Size | Owner-occupied | Renter-occupied |
| Less than High School | 40 (100.0%) | 0 (0.0%) |
| High School Diploma | 73 (67.6%) | 35 (32.4%) |
| College/Associate Degree | 63 (73.3%) | 23 (26.7%) |
| Bachelor's Degree or higher | 0 (0.0%) | 7 (100.0%) |
Occupancy by Age of Householder in Kotlik
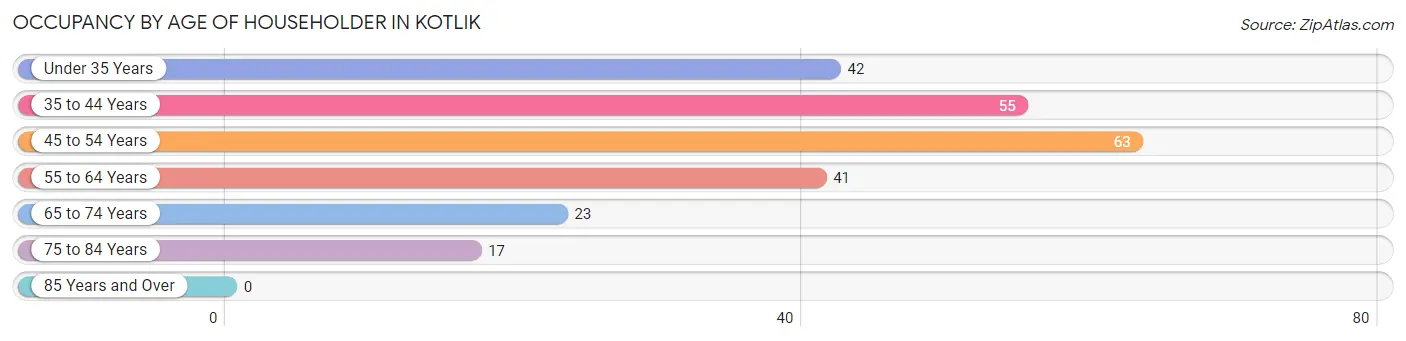
| Age Bracket | # Households | % Households |
| Under 35 Years | 42 | 17.4% |
| 35 to 44 Years | 55 | 22.8% |
| 45 to 54 Years | 63 | 26.1% |
| 55 to 64 Years | 41 | 17.0% |
| 65 to 74 Years | 23 | 9.5% |
| 75 to 84 Years | 17 | 7.0% |
| 85 Years and Over | 0 | 0.0% |
| Total | 241 | 100.0% |
Housing Finances in Kotlik
Median Income by Occupancy in Kotlik
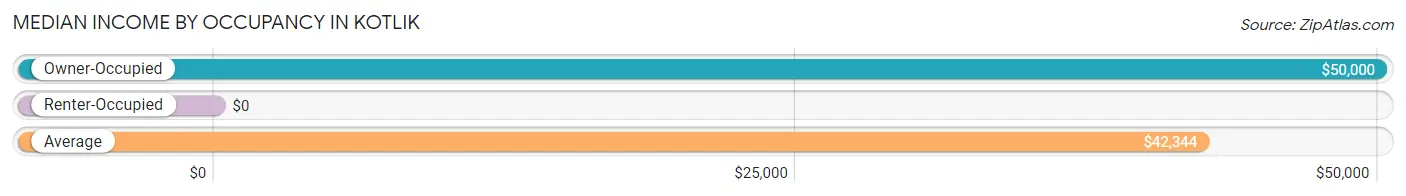
| Occupancy Type | # Households | Median Income |
| Owner-Occupied | 176 (73.0%) | $50,000 |
| Renter-Occupied | 65 (27.0%) | $0 |
| Average | 241 (100.0%) | $42,344 |
Occupancy by Householder Income Bracket in Kotlik
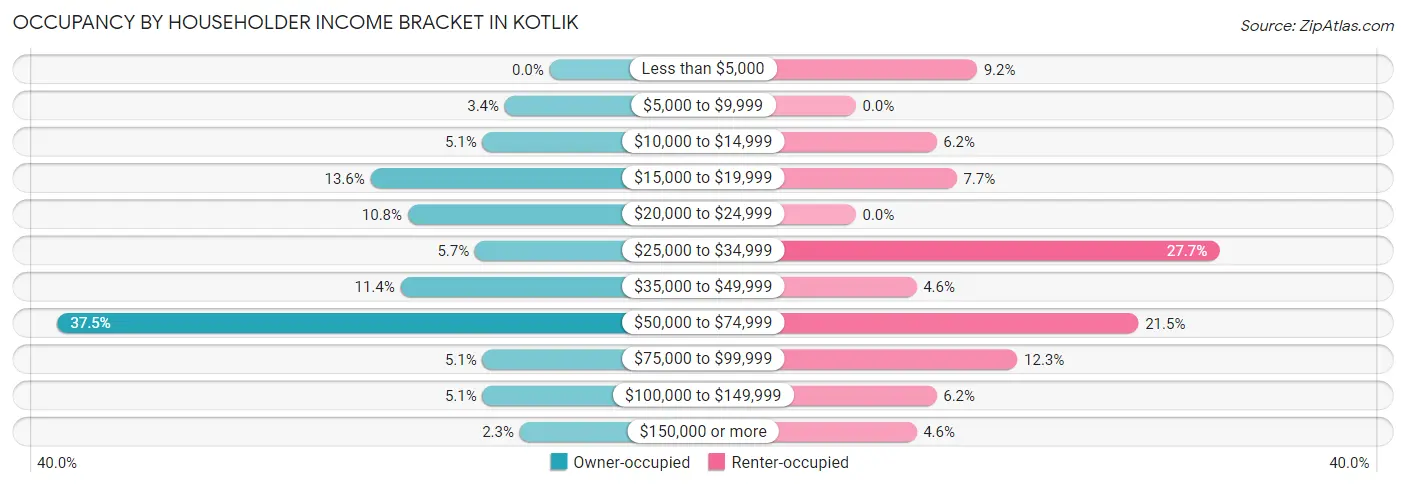
| Income Bracket | Owner-occupied | Renter-occupied |
| Less than $5,000 | 0 (0.0%) | 6 (9.2%) |
| $5,000 to $9,999 | 6 (3.4%) | 0 (0.0%) |
| $10,000 to $14,999 | 9 (5.1%) | 4 (6.1%) |
| $15,000 to $19,999 | 24 (13.6%) | 5 (7.7%) |
| $20,000 to $24,999 | 19 (10.8%) | 0 (0.0%) |
| $25,000 to $34,999 | 10 (5.7%) | 18 (27.7%) |
| $35,000 to $49,999 | 20 (11.4%) | 3 (4.6%) |
| $50,000 to $74,999 | 66 (37.5%) | 14 (21.5%) |
| $75,000 to $99,999 | 9 (5.1%) | 8 (12.3%) |
| $100,000 to $149,999 | 9 (5.1%) | 4 (6.1%) |
| $150,000 or more | 4 (2.3%) | 3 (4.6%) |
| Total | 176 (100.0%) | 65 (100.0%) |
Monthly Housing Cost Tiers in Kotlik
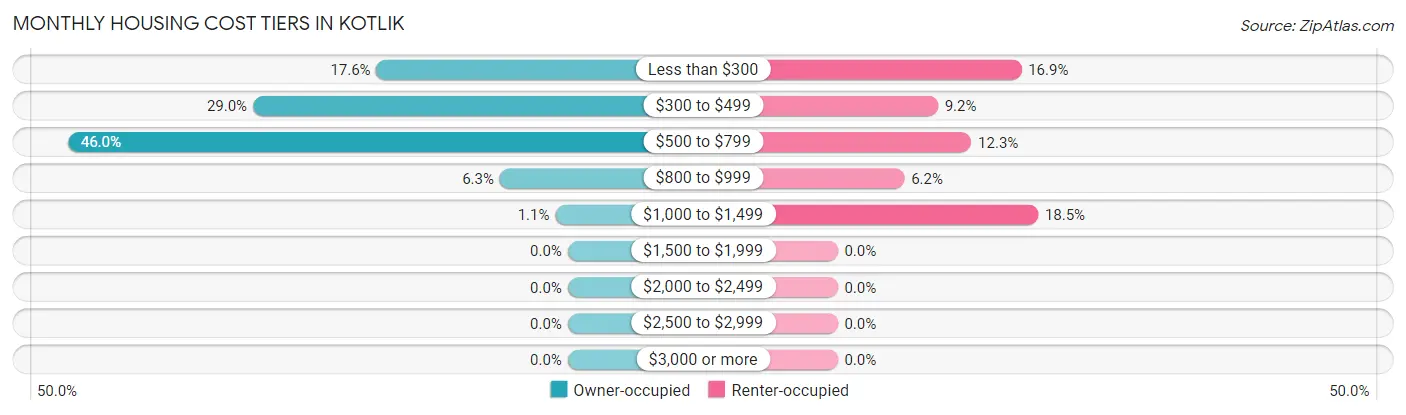
| Monthly Cost | Owner-occupied | Renter-occupied |
| Less than $300 | 31 (17.6%) | 11 (16.9%) |
| $300 to $499 | 51 (29.0%) | 6 (9.2%) |
| $500 to $799 | 81 (46.0%) | 8 (12.3%) |
| $800 to $999 | 11 (6.2%) | 4 (6.1%) |
| $1,000 to $1,499 | 2 (1.1%) | 12 (18.5%) |
| $1,500 to $1,999 | 0 (0.0%) | 0 (0.0%) |
| $2,000 to $2,499 | 0 (0.0%) | 0 (0.0%) |
| $2,500 to $2,999 | 0 (0.0%) | 0 (0.0%) |
| $3,000 or more | 0 (0.0%) | 0 (0.0%) |
| Total | 176 (100.0%) | 65 (100.0%) |
Physical Housing Characteristics in Kotlik
Housing Structures in Kotlik
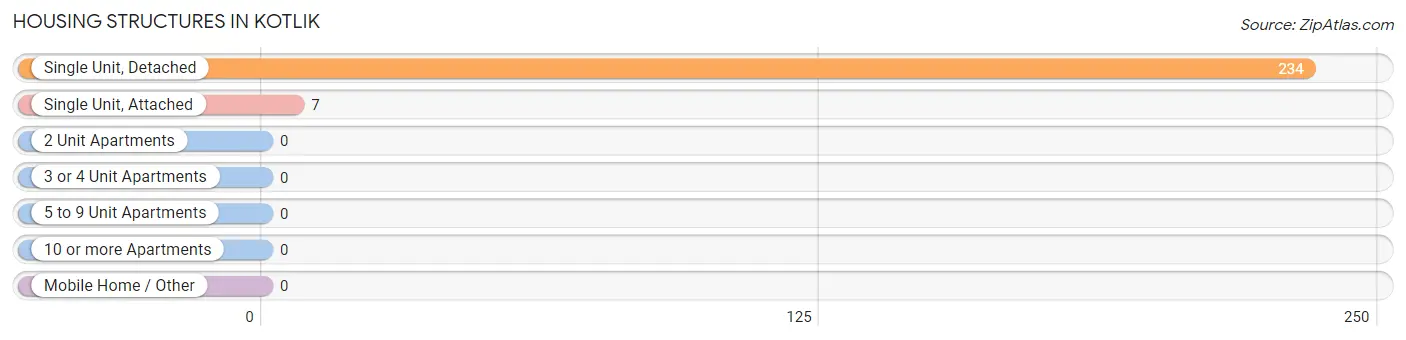
| Structure Type | # Housing Units | % Housing Units |
| Single Unit, Detached | 234 | 97.1% |
| Single Unit, Attached | 7 | 2.9% |
| 2 Unit Apartments | 0 | 0.0% |
| 3 or 4 Unit Apartments | 0 | 0.0% |
| 5 to 9 Unit Apartments | 0 | 0.0% |
| 10 or more Apartments | 0 | 0.0% |
| Mobile Home / Other | 0 | 0.0% |
| Total | 241 | 100.0% |
Housing Structures by Occupancy in Kotlik
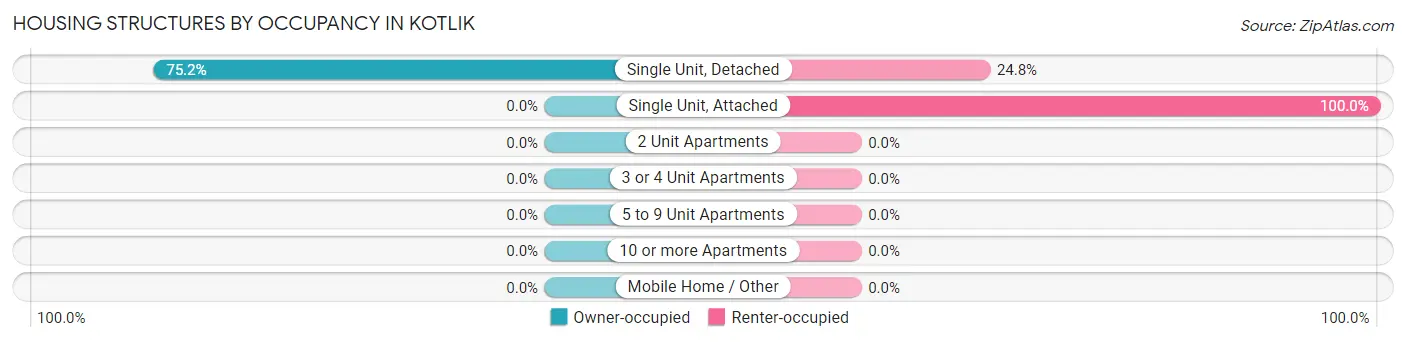
| Structure Type | Owner-occupied | Renter-occupied |
| Single Unit, Detached | 176 (75.2%) | 58 (24.8%) |
| Single Unit, Attached | 0 (0.0%) | 7 (100.0%) |
| 2 Unit Apartments | 0 (0.0%) | 0 (0.0%) |
| 3 or 4 Unit Apartments | 0 (0.0%) | 0 (0.0%) |
| 5 to 9 Unit Apartments | 0 (0.0%) | 0 (0.0%) |
| 10 or more Apartments | 0 (0.0%) | 0 (0.0%) |
| Mobile Home / Other | 0 (0.0%) | 0 (0.0%) |
| Total | 176 (73.0%) | 65 (27.0%) |
Housing Structures by Number of Rooms in Kotlik
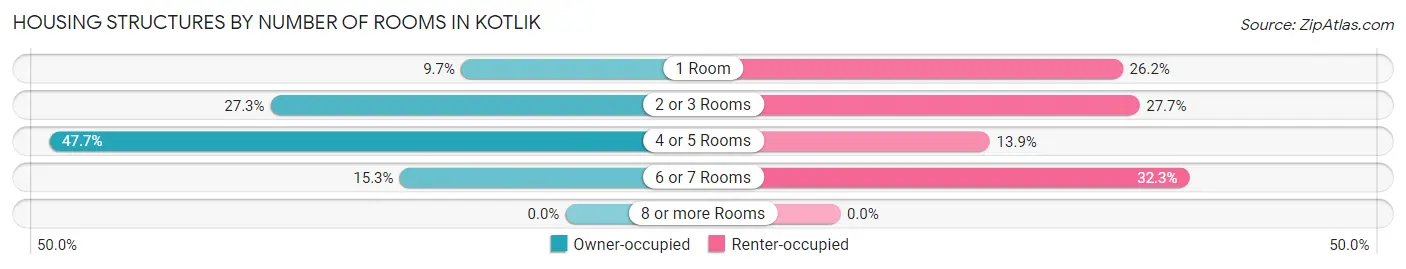
| Number of Rooms | Owner-occupied | Renter-occupied |
| 1 Room | 17 (9.7%) | 17 (26.2%) |
| 2 or 3 Rooms | 48 (27.3%) | 18 (27.7%) |
| 4 or 5 Rooms | 84 (47.7%) | 9 (13.9%) |
| 6 or 7 Rooms | 27 (15.3%) | 21 (32.3%) |
| 8 or more Rooms | 0 (0.0%) | 0 (0.0%) |
| Total | 176 (100.0%) | 65 (100.0%) |
Housing Structure by Heating Type in Kotlik
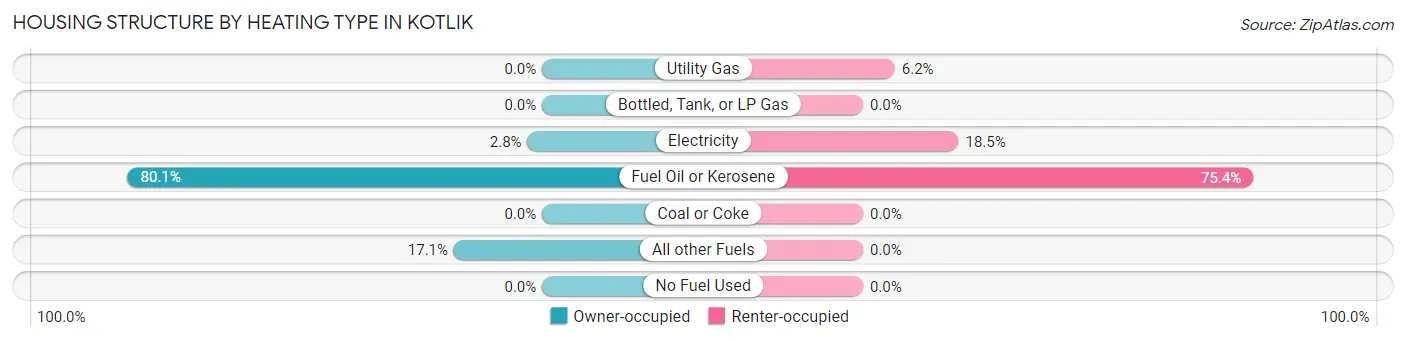
| Heating Type | Owner-occupied | Renter-occupied |
| Utility Gas | 0 (0.0%) | 4 (6.1%) |
| Bottled, Tank, or LP Gas | 0 (0.0%) | 0 (0.0%) |
| Electricity | 5 (2.8%) | 12 (18.5%) |
| Fuel Oil or Kerosene | 141 (80.1%) | 49 (75.4%) |
| Coal or Coke | 0 (0.0%) | 0 (0.0%) |
| All other Fuels | 30 (17.1%) | 0 (0.0%) |
| No Fuel Used | 0 (0.0%) | 0 (0.0%) |
| Total | 176 (100.0%) | 65 (100.0%) |
Household Vehicle Usage in Kotlik
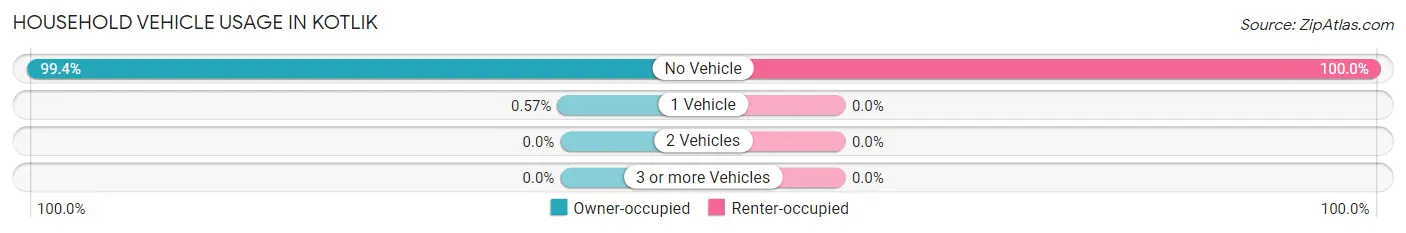
| Vehicles per Household | Owner-occupied | Renter-occupied |
| No Vehicle | 175 (99.4%) | 65 (100.0%) |
| 1 Vehicle | 1 (0.6%) | 0 (0.0%) |
| 2 Vehicles | 0 (0.0%) | 0 (0.0%) |
| 3 or more Vehicles | 0 (0.0%) | 0 (0.0%) |
| Total | 176 (100.0%) | 65 (100.0%) |
Real Estate & Mortgages in Kotlik
Real Estate and Mortgage Overview in Kotlik
| Characteristic | Without Mortgage | With Mortgage |
| Housing Units | 150 | 26 |
| Median Property Value | $42,700 | $0 |
| Median Household Income | $46,667 | $2 |
| Monthly Housing Costs | $504 | $0 |
| Real Estate Taxes | - | - |
Property Value by Mortgage Status in Kotlik
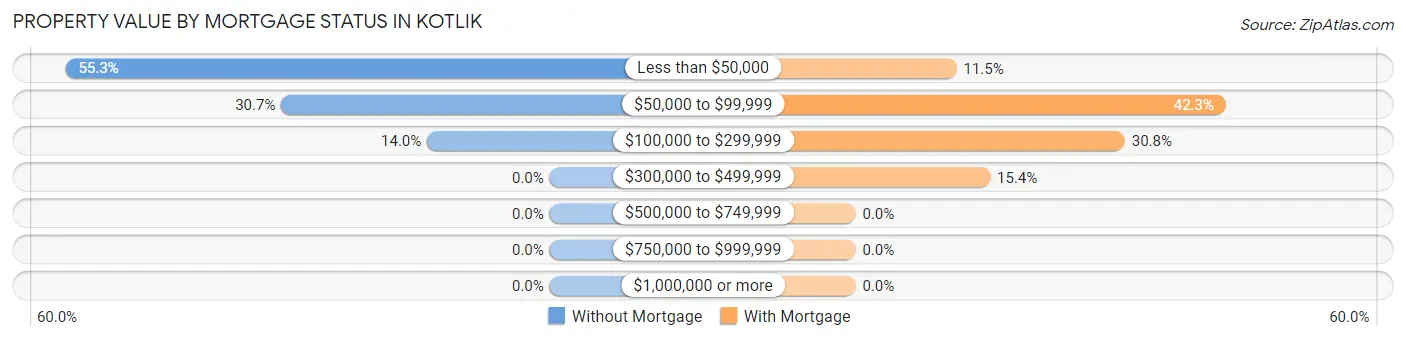
| Property Value | Without Mortgage | With Mortgage |
| Less than $50,000 | 83 (55.3%) | 3 (11.5%) |
| $50,000 to $99,999 | 46 (30.7%) | 11 (42.3%) |
| $100,000 to $299,999 | 21 (14.0%) | 8 (30.8%) |
| $300,000 to $499,999 | 0 (0.0%) | 4 (15.4%) |
| $500,000 to $749,999 | 0 (0.0%) | 0 (0.0%) |
| $750,000 to $999,999 | 0 (0.0%) | 0 (0.0%) |
| $1,000,000 or more | 0 (0.0%) | 0 (0.0%) |
| Total | 150 (100.0%) | 26 (100.0%) |
Household Income by Mortgage Status in Kotlik
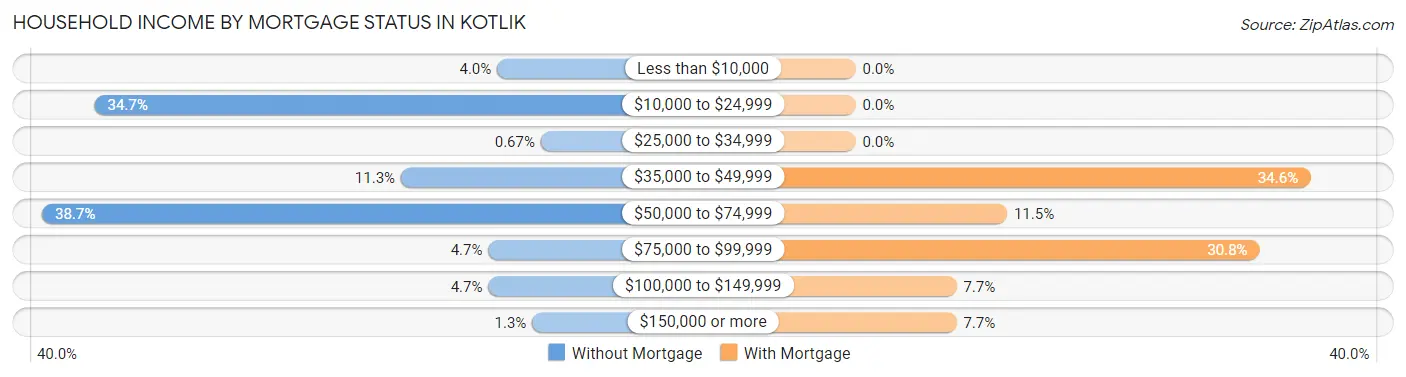
| Household Income | Without Mortgage | With Mortgage |
| Less than $10,000 | 6 (4.0%) | 0 (0.0%) |
| $10,000 to $24,999 | 52 (34.7%) | 0 (0.0%) |
| $25,000 to $34,999 | 1 (0.7%) | 0 (0.0%) |
| $35,000 to $49,999 | 17 (11.3%) | 9 (34.6%) |
| $50,000 to $74,999 | 58 (38.7%) | 3 (11.5%) |
| $75,000 to $99,999 | 7 (4.7%) | 8 (30.8%) |
| $100,000 to $149,999 | 7 (4.7%) | 2 (7.7%) |
| $150,000 or more | 2 (1.3%) | 2 (7.7%) |
| Total | 150 (100.0%) | 26 (100.0%) |
Property Value to Household Income Ratio in Kotlik
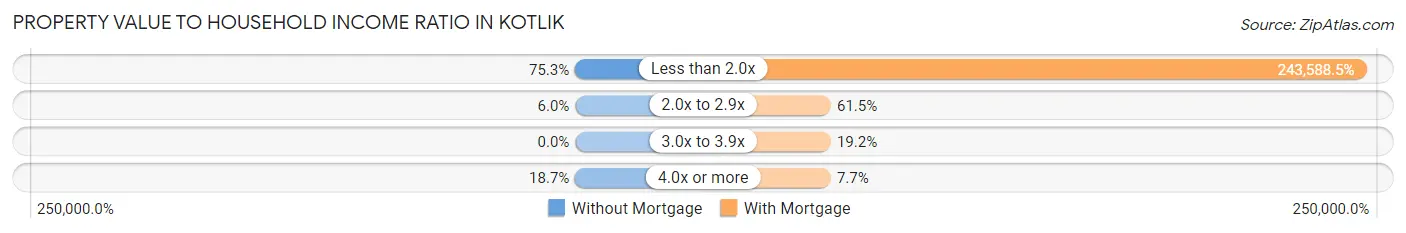
| Value-to-Income Ratio | Without Mortgage | With Mortgage |
| Less than 2.0x | 113 (75.3%) | 63,333 (243,588.5%) |
| 2.0x to 2.9x | 9 (6.0%) | 16 (61.5%) |
| 3.0x to 3.9x | 0 (0.0%) | 5 (19.2%) |
| 4.0x or more | 28 (18.7%) | 2 (7.7%) |
| Total | 150 (100.0%) | 26 (100.0%) |
Real Estate Taxes by Mortgage Status in Kotlik
| Property Taxes | Without Mortgage | With Mortgage |
| Less than $800 | 0 (0.0%) | 0 (0.0%) |
| $800 to $1,499 | 0 (0.0%) | 0 (0.0%) |
| $800 to $1,499 | 0 (0.0%) | 0 (0.0%) |
| Total | 150 (100.0%) | 26 (100.0%) |
Health & Disability in Kotlik
Health Insurance Coverage by Age in Kotlik
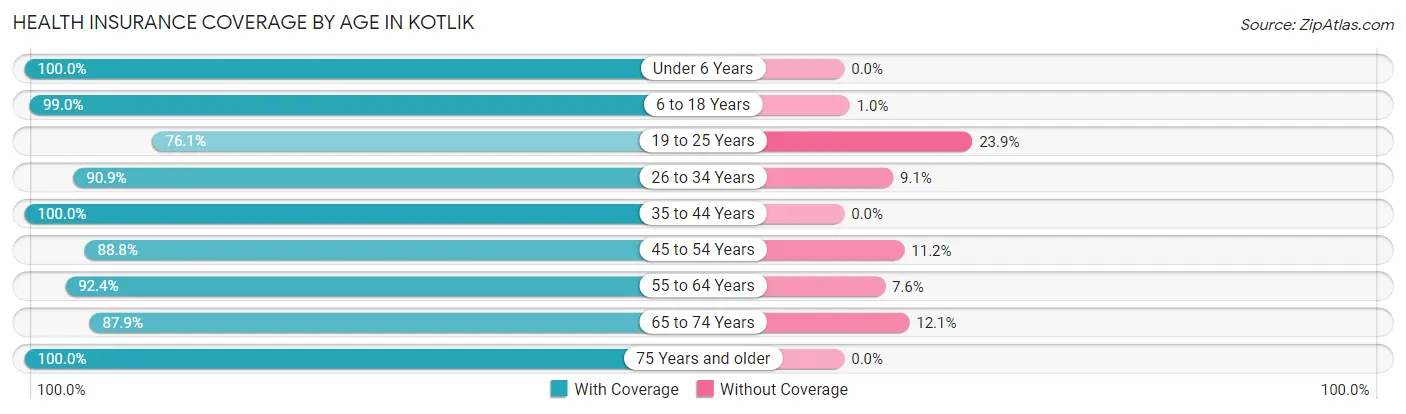
| Age Bracket | With Coverage | Without Coverage |
| Under 6 Years | 251 (100.0%) | 0 (0.0%) |
| 6 to 18 Years | 394 (99.0%) | 4 (1.0%) |
| 19 to 25 Years | 134 (76.1%) | 42 (23.9%) |
| 26 to 34 Years | 110 (90.9%) | 11 (9.1%) |
| 35 to 44 Years | 85 (100.0%) | 0 (0.0%) |
| 45 to 54 Years | 111 (88.8%) | 14 (11.2%) |
| 55 to 64 Years | 61 (92.4%) | 5 (7.6%) |
| 65 to 74 Years | 29 (87.9%) | 4 (12.1%) |
| 75 Years and older | 17 (100.0%) | 0 (0.0%) |
| Total | 1,192 (93.7%) | 80 (6.3%) |
Health Insurance Coverage by Citizenship Status in Kotlik
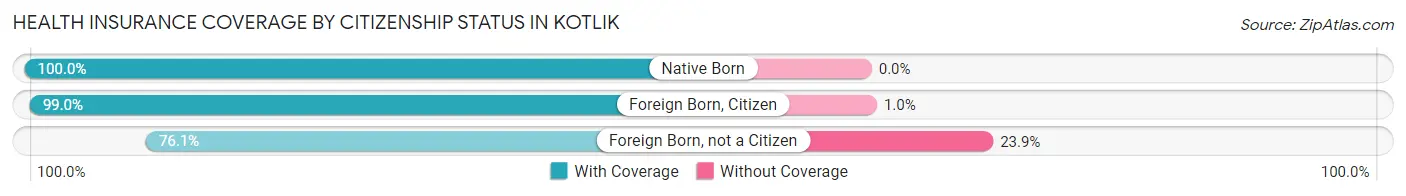
| Citizenship Status | With Coverage | Without Coverage |
| Native Born | 251 (100.0%) | 0 (0.0%) |
| Foreign Born, Citizen | 394 (99.0%) | 4 (1.0%) |
| Foreign Born, not a Citizen | 134 (76.1%) | 42 (23.9%) |
Health Insurance Coverage by Household Income in Kotlik
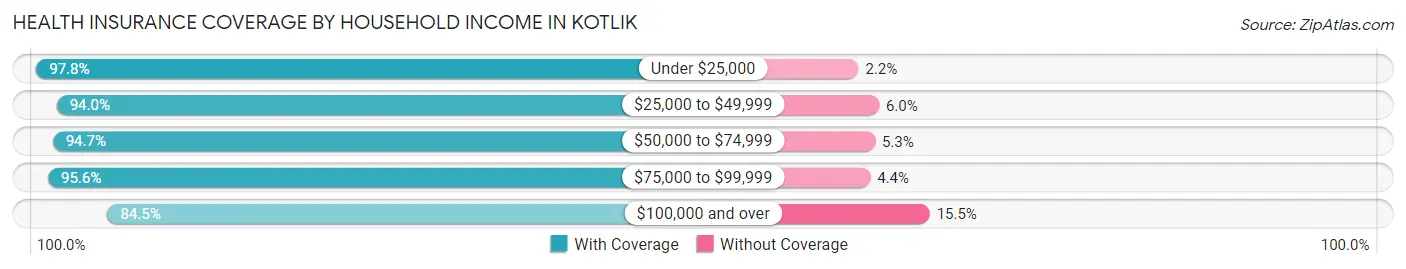
| Household Income | With Coverage | Without Coverage |
| Under $25,000 | 267 (97.8%) | 6 (2.2%) |
| $25,000 to $49,999 | 218 (94.0%) | 14 (6.0%) |
| $50,000 to $74,999 | 359 (94.7%) | 20 (5.3%) |
| $75,000 to $99,999 | 174 (95.6%) | 8 (4.4%) |
| $100,000 and over | 174 (84.5%) | 32 (15.5%) |
Public vs Private Health Insurance Coverage by Age in Kotlik
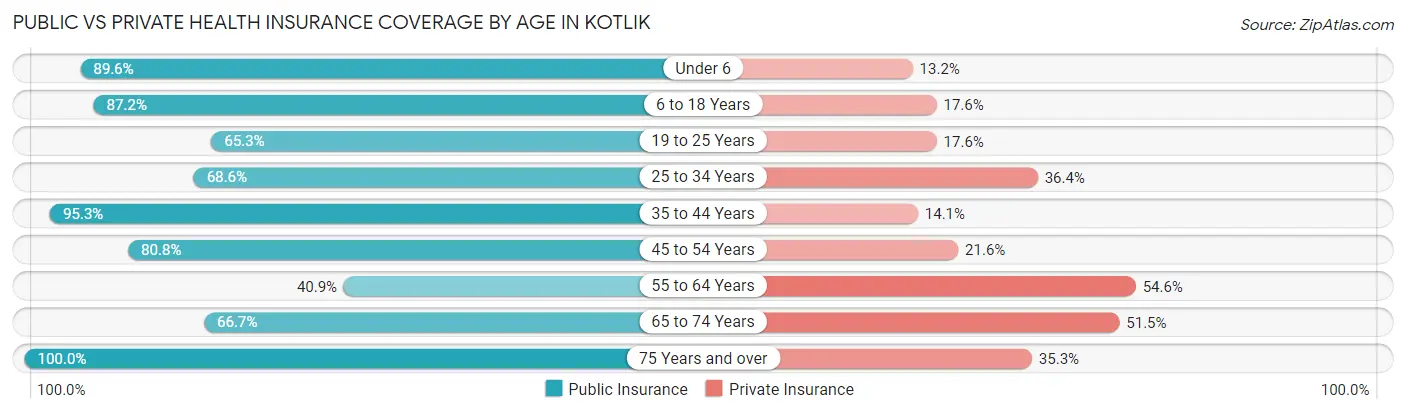
| Age Bracket | Public Insurance | Private Insurance |
| Under 6 | 225 (89.6%) | 33 (13.2%) |
| 6 to 18 Years | 347 (87.2%) | 70 (17.6%) |
| 19 to 25 Years | 115 (65.3%) | 31 (17.6%) |
| 25 to 34 Years | 83 (68.6%) | 44 (36.4%) |
| 35 to 44 Years | 81 (95.3%) | 12 (14.1%) |
| 45 to 54 Years | 101 (80.8%) | 27 (21.6%) |
| 55 to 64 Years | 27 (40.9%) | 36 (54.5%) |
| 65 to 74 Years | 22 (66.7%) | 17 (51.5%) |
| 75 Years and over | 17 (100.0%) | 6 (35.3%) |
| Total | 1,018 (80.0%) | 276 (21.7%) |
Disability Status by Sex by Age in Kotlik
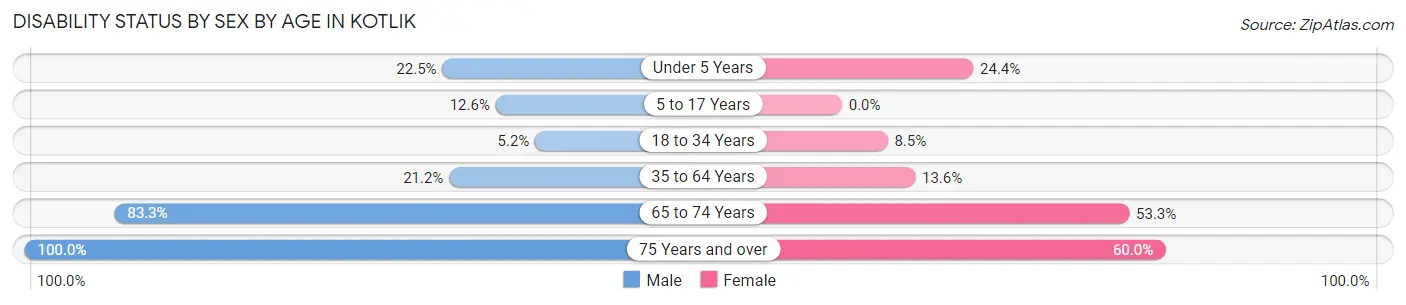
| Age Bracket | Male | Female |
| Under 5 Years | 22 (22.5%) | 29 (24.4%) |
| 5 to 17 Years | 31 (12.6%) | 0 (0.0%) |
| 18 to 34 Years | 8 (5.2%) | 15 (8.5%) |
| 35 to 64 Years | 32 (21.2%) | 17 (13.6%) |
| 65 to 74 Years | 15 (83.3%) | 8 (53.3%) |
| 75 Years and over | 7 (100.0%) | 6 (60.0%) |
Disability Class by Sex by Age in Kotlik
Disability Class: Hearing Difficulty
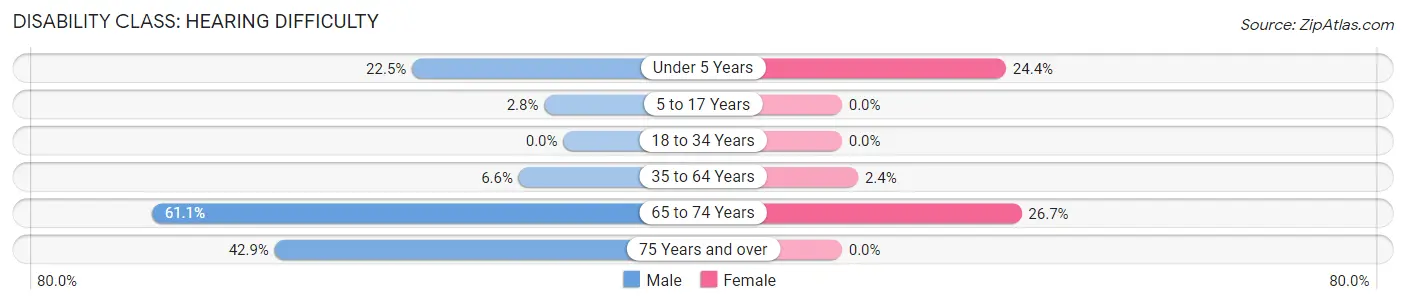
| Age Bracket | Male | Female |
| Under 5 Years | 22 (22.5%) | 29 (24.4%) |
| 5 to 17 Years | 7 (2.8%) | 0 (0.0%) |
| 18 to 34 Years | 0 (0.0%) | 0 (0.0%) |
| 35 to 64 Years | 10 (6.6%) | 3 (2.4%) |
| 65 to 74 Years | 11 (61.1%) | 4 (26.7%) |
| 75 Years and over | 3 (42.9%) | 0 (0.0%) |
Disability Class: Vision Difficulty
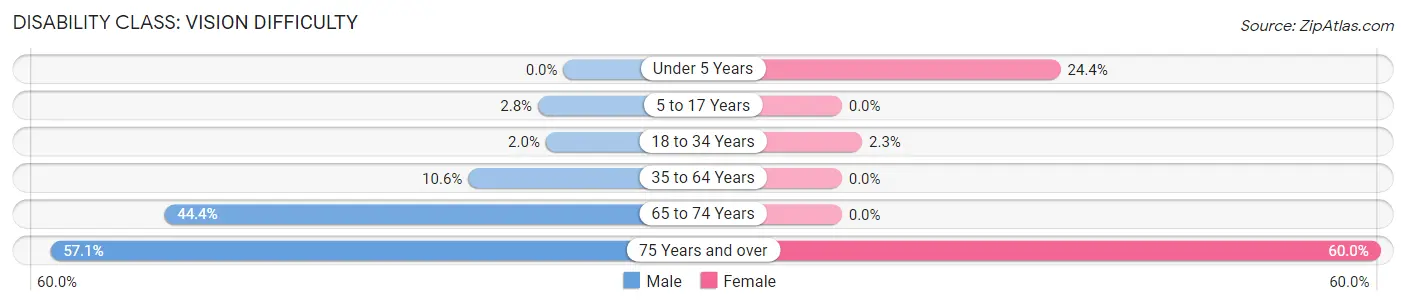
| Age Bracket | Male | Female |
| Under 5 Years | 0 (0.0%) | 29 (24.4%) |
| 5 to 17 Years | 7 (2.8%) | 0 (0.0%) |
| 18 to 34 Years | 3 (2.0%) | 4 (2.3%) |
| 35 to 64 Years | 16 (10.6%) | 0 (0.0%) |
| 65 to 74 Years | 8 (44.4%) | 0 (0.0%) |
| 75 Years and over | 4 (57.1%) | 6 (60.0%) |
Disability Class: Cognitive Difficulty
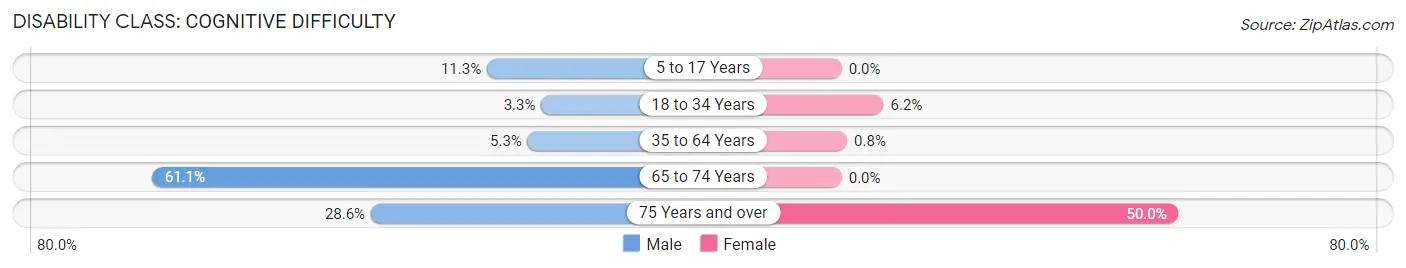
| Age Bracket | Male | Female |
| 5 to 17 Years | 28 (11.3%) | 0 (0.0%) |
| 18 to 34 Years | 5 (3.3%) | 11 (6.2%) |
| 35 to 64 Years | 8 (5.3%) | 1 (0.8%) |
| 65 to 74 Years | 11 (61.1%) | 0 (0.0%) |
| 75 Years and over | 2 (28.6%) | 5 (50.0%) |
Disability Class: Ambulatory Difficulty
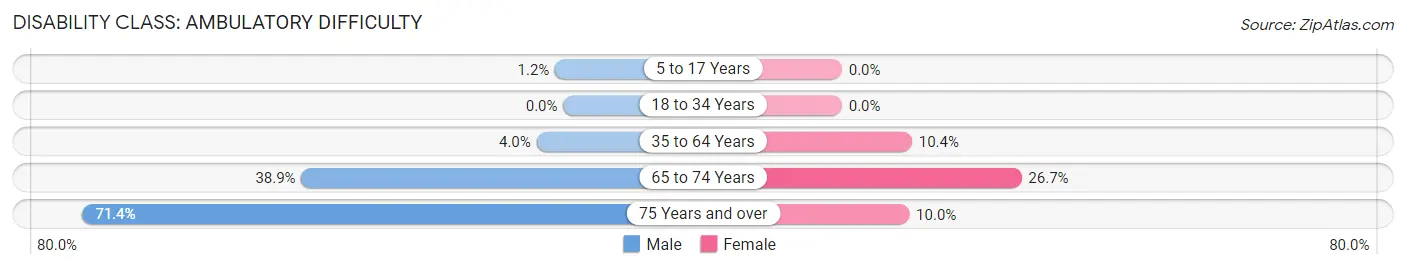
| Age Bracket | Male | Female |
| 5 to 17 Years | 3 (1.2%) | 0 (0.0%) |
| 18 to 34 Years | 0 (0.0%) | 0 (0.0%) |
| 35 to 64 Years | 6 (4.0%) | 13 (10.4%) |
| 65 to 74 Years | 7 (38.9%) | 4 (26.7%) |
| 75 Years and over | 5 (71.4%) | 1 (10.0%) |
Disability Class: Self-Care Difficulty
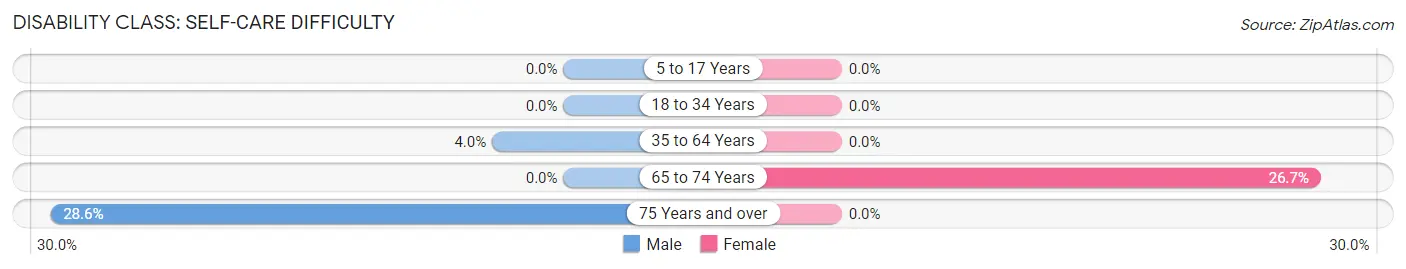
| Age Bracket | Male | Female |
| 5 to 17 Years | 0 (0.0%) | 0 (0.0%) |
| 18 to 34 Years | 0 (0.0%) | 0 (0.0%) |
| 35 to 64 Years | 6 (4.0%) | 0 (0.0%) |
| 65 to 74 Years | 0 (0.0%) | 4 (26.7%) |
| 75 Years and over | 2 (28.6%) | 0 (0.0%) |
Technology Access in Kotlik
Computing Device Access in Kotlik
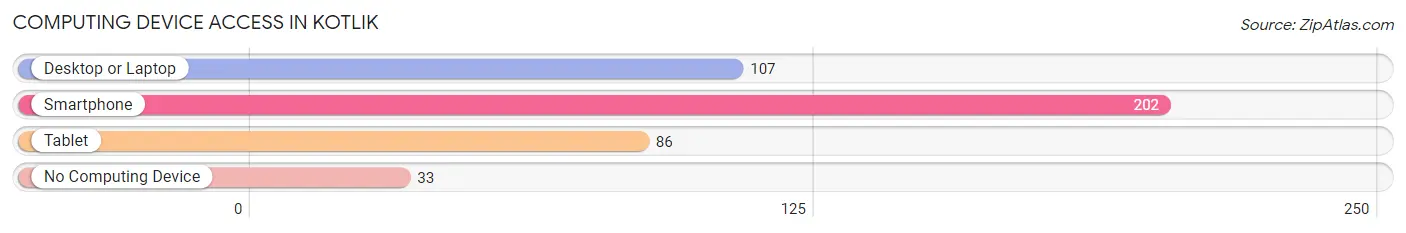
| Device Type | # Households | % Households |
| Desktop or Laptop | 107 | 44.4% |
| Smartphone | 202 | 83.8% |
| Tablet | 86 | 35.7% |
| No Computing Device | 33 | 13.7% |
| Total | 241 | 100.0% |
Internet Access in Kotlik
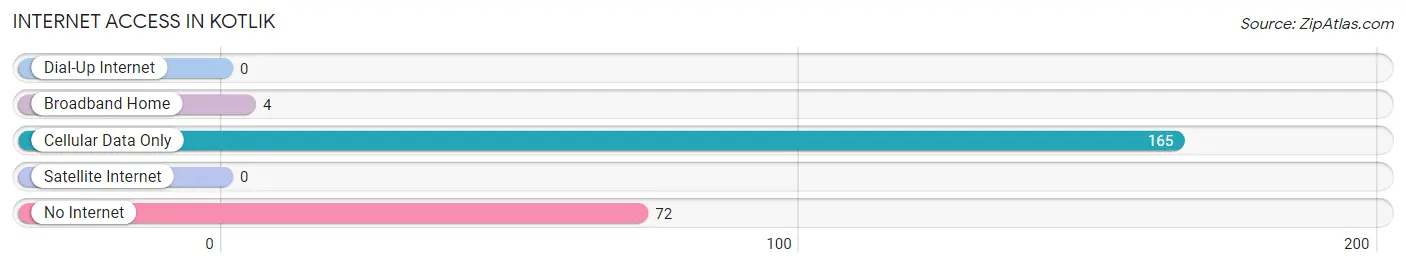
| Internet Type | # Households | % Households |
| Dial-Up Internet | 0 | 0.0% |
| Broadband Home | 4 | 1.7% |
| Cellular Data Only | 165 | 68.5% |
| Satellite Internet | 0 | 0.0% |
| No Internet | 72 | 29.9% |
| Total | 241 | 100.0% |
Kotlik Summary
Kotlik is a small city located in the Northwest Arctic Borough of Alaska. It is situated on the banks of the Kotlik Slough, a tributary of the Yukon River. The city has a population of approximately 600 people, most of whom are of Yup'ik Eskimo descent.
Geography
Kotlik is located in the Northwest Arctic Borough of Alaska, approximately 40 miles east of the city of Nome. It is situated on the banks of the Kotlik Slough, a tributary of the Yukon River. The city is surrounded by the tundra and is located in an area of low hills and flat terrain. The climate in Kotlik is subarctic, with cold winters and mild summers.
History
Kotlik was first settled by Yup'ik Eskimos in the late 1800s. The city was originally known as "Kotlikmiut," which means "people of the slough." In the early 1900s, the city was renamed "Kotlik" after the slough. The city was incorporated in 1959 and has since grown to become the largest city in the Northwest Arctic Borough.
Economy
Kotlik's economy is largely based on subsistence fishing and hunting. The city is home to a fish processing plant, which processes salmon, herring, and other fish caught in the Kotlik Slough. The city also has a small commercial fishing fleet, which supplies fish to local markets.
In addition to fishing, Kotlik's economy is also supported by tourism. The city is home to a number of tourist attractions, including the Kotlik Slough, which is a popular destination for bird watching and fishing. The city also has a number of cultural attractions, including the Kotlik Cultural Center, which houses artifacts and exhibits related to the Yup'ik culture.
Demographics
As of the 2010 census, the population of Kotlik was 590, of which 97.3% were Native American. The majority of the population (94.3%) is of Yup'ik Eskimo descent. The median age of the population is 28.7 years, and the median household income is $30,000.
Kotlik is served by the Kotlik School District, which provides educational services to students in grades K-12. The city is also home to a number of churches, including the Kotlik United Methodist Church and the Kotlik Presbyterian Church.
Conclusion
Kotlik is a small city located in the Northwest Arctic Borough of Alaska. It is situated on the banks of the Kotlik Slough, a tributary of the Yukon River. The city has a population of approximately 600 people, most of whom are of Yup'ik Eskimo descent. The economy of Kotlik is largely based on subsistence fishing and hunting, as well as tourism. The city is served by the Kotlik School District and is home to a number of churches.
Common Questions
What is Per Capita Income in Kotlik?
Per Capita income in Kotlik is $10,256.
What is the Median Family Income in Kotlik?
Median Family Income in Kotlik is $52,974.
What is the Median Household income in Kotlik?
Median Household Income in Kotlik is $42,344.
What is Income or Wage Gap in Kotlik?
Income or Wage Gap in Kotlik is 35.8%.
Women in Kotlik earn 64.2 cents for every dollar earned by a man.
What is Family Income Deficit in Kotlik?
Family Income Deficit in Kotlik is $11,942.
Families that are below poverty line in Kotlik earn $11,942 less on average than the poverty threshold level.
What is Inequality or Gini Index in Kotlik?
Inequality or Gini Index in Kotlik is 0.40.
What is the Total Population of Kotlik?
Total Population of Kotlik is 1,272.
What is the Total Male Population of Kotlik?
Total Male Population of Kotlik is 674.
What is the Total Female Population of Kotlik?
Total Female Population of Kotlik is 598.
What is the Ratio of Males per 100 Females in Kotlik?
There are 112.71 Males per 100 Females in Kotlik.
What is the Ratio of Females per 100 Males in Kotlik?
There are 88.72 Females per 100 Males in Kotlik.
What is the Median Population Age in Kotlik?
Median Population Age in Kotlik is 18.6 Years.
What is the Average Family Size in Kotlik
Average Family Size in Kotlik is 5.7 People.
What is the Average Household Size in Kotlik
Average Household Size in Kotlik is 5.3 People.
How Large is the Labor Force in Kotlik?
There are 415 People in the Labor Forcein in Kotlik.
What is the Percentage of People in the Labor Force in Kotlik?
60.1% of People are in the Labor Force in Kotlik.
What is the Unemployment Rate in Kotlik?
Unemployment Rate in Kotlik is 22.4%.