Kipnuk, AK Map & Demographics
Kipnuk Map
Kipnuk Overview
$11,924
PER CAPITA INCOME
$60,278
AVG FAMILY INCOME
$43,750
AVG HOUSEHOLD INCOME
42.0%
WAGE / INCOME GAP [ % ]
58.0¢/ $1
WAGE / INCOME GAP [ $ ]
0.48
INEQUALITY / GINI INDEX
572
TOTAL POPULATION
284
MALE POPULATION
288
FEMALE POPULATION
98.61
MALES / 100 FEMALES
101.41
FEMALES / 100 MALES
25.9
MEDIAN AGE
4.7
AVG FAMILY SIZE
4.1
AVG HOUSEHOLD SIZE
186
LABOR FORCE [ PEOPLE ]
51.1%
PERCENT IN LABOR FORCE
26.3%
UNEMPLOYMENT RATE
Kipnuk Zip Codes
Kipnuk Area Codes
Income in Kipnuk
Income Overview in Kipnuk
Per Capita Income in Kipnuk is $11,924, while median incomes of families and households are $60,278 and $43,750 respectively.
| Characteristic | Number | Measure |
| Per Capita Income | 572 | $11,924 |
| Median Family Income | 114 | $60,278 |
| Mean Family Income | 114 | $57,280 |
| Median Household Income | 138 | $43,750 |
| Mean Household Income | 138 | $50,184 |
| Income Deficit | 114 | $0 |
| Wage / Income Gap (%) | 572 | 42.01% |
| Wage / Income Gap ($) | 572 | 57.99¢ per $1 |
| Gini / Inequality Index | 572 | 0.48 |
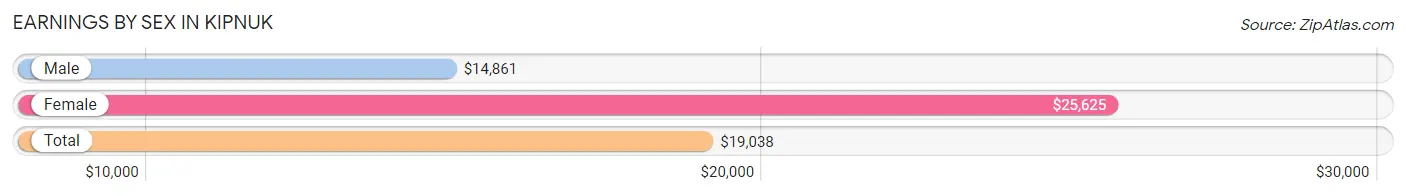
Earnings by Sex in Kipnuk
Average Earnings in Kipnuk are $19,038, $14,861 for men and $25,625 for women, a difference of 42.0%.
| Sex | Number | Average Earnings |
| Male | 119 (56.7%) | $14,861 |
| Female | 91 (43.3%) | $25,625 |
| Total | 210 (100.0%) | $19,038 |
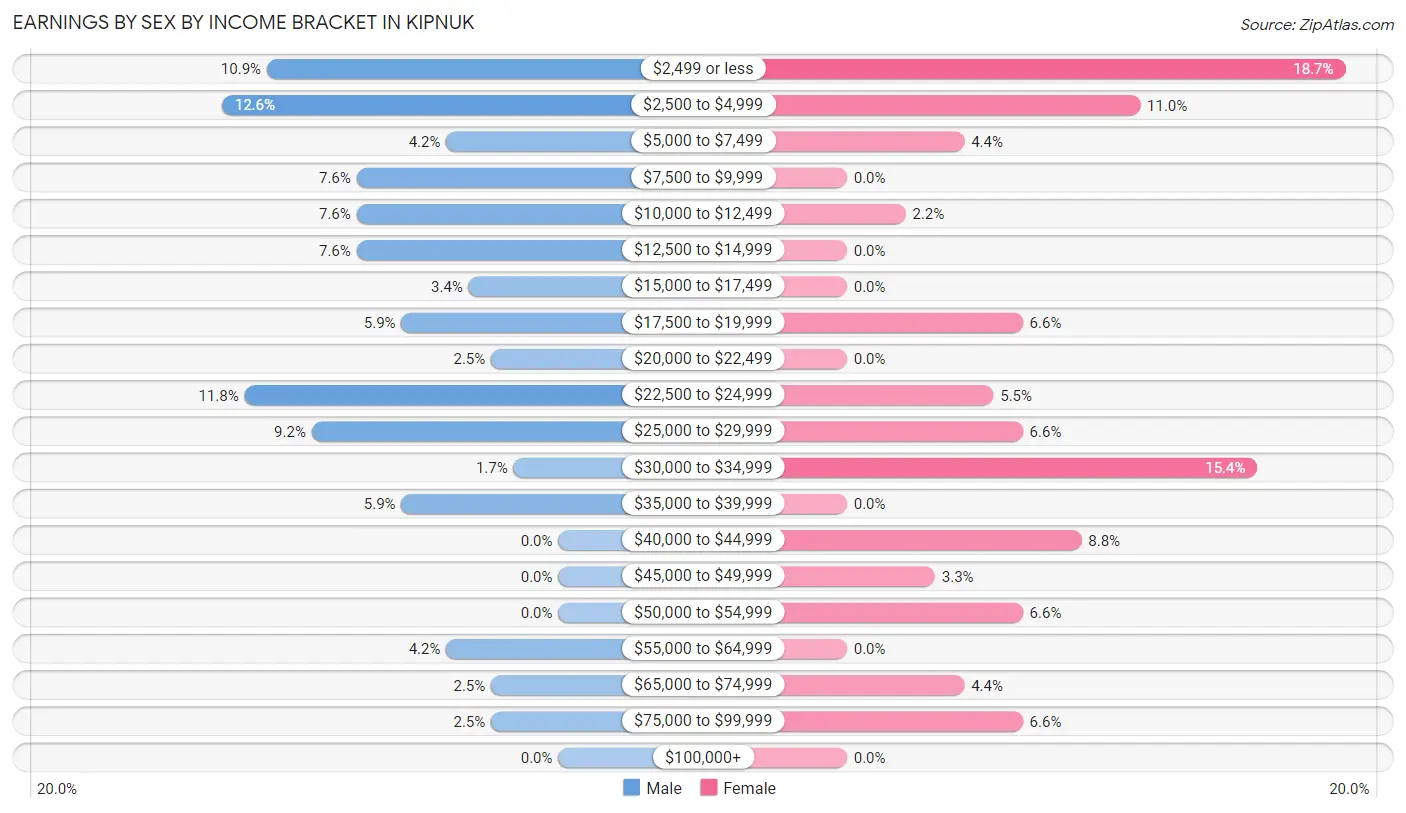
Earnings by Sex by Income Bracket in Kipnuk
The most common earnings brackets in Kipnuk are $2,500 to $4,999 for men (15 | 12.6%) and $2,499 or less for women (17 | 18.7%).
| Income | Male | Female |
| $2,499 or less | 13 (10.9%) | 17 (18.7%) |
| $2,500 to $4,999 | 15 (12.6%) | 10 (11.0%) |
| $5,000 to $7,499 | 5 (4.2%) | 4 (4.4%) |
| $7,500 to $9,999 | 9 (7.6%) | 0 (0.0%) |
| $10,000 to $12,499 | 9 (7.6%) | 2 (2.2%) |
| $12,500 to $14,999 | 9 (7.6%) | 0 (0.0%) |
| $15,000 to $17,499 | 4 (3.4%) | 0 (0.0%) |
| $17,500 to $19,999 | 7 (5.9%) | 6 (6.6%) |
| $20,000 to $22,499 | 3 (2.5%) | 0 (0.0%) |
| $22,500 to $24,999 | 14 (11.8%) | 5 (5.5%) |
| $25,000 to $29,999 | 11 (9.2%) | 6 (6.6%) |
| $30,000 to $34,999 | 2 (1.7%) | 14 (15.4%) |
| $35,000 to $39,999 | 7 (5.9%) | 0 (0.0%) |
| $40,000 to $44,999 | 0 (0.0%) | 8 (8.8%) |
| $45,000 to $49,999 | 0 (0.0%) | 3 (3.3%) |
| $50,000 to $54,999 | 0 (0.0%) | 6 (6.6%) |
| $55,000 to $64,999 | 5 (4.2%) | 0 (0.0%) |
| $65,000 to $74,999 | 3 (2.5%) | 4 (4.4%) |
| $75,000 to $99,999 | 3 (2.5%) | 6 (6.6%) |
| $100,000+ | 0 (0.0%) | 0 (0.0%) |
| Total | 119 (100.0%) | 91 (100.0%) |
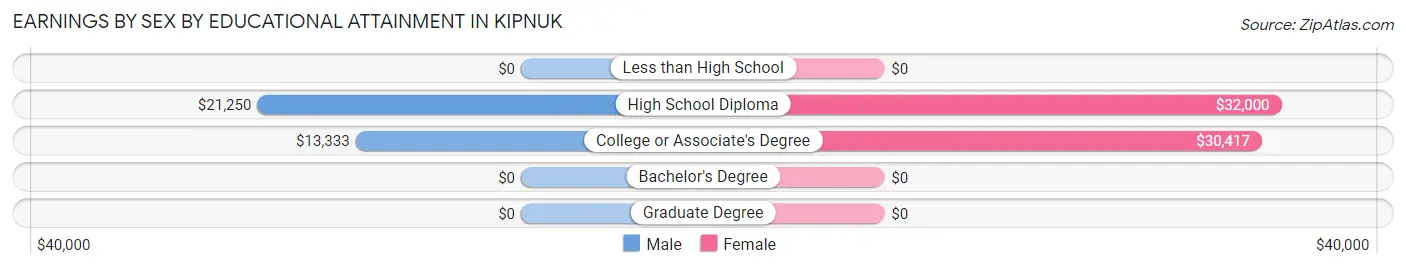
Earnings by Sex by Educational Attainment in Kipnuk
Average earnings in Kipnuk are $19,688 for men and $30,455 for women, a difference of 35.3%. Men with an educational attainment of high school diploma enjoy the highest average annual earnings of $21,250, while those with college or associate's degree education earn the least with $13,333. Women with an educational attainment of high school diploma earn the most with the average annual earnings of $32,000, while those with college or associate's degree education have the smallest earnings of $30,417.
| Educational Attainment | Male Income | Female Income |
| Less than High School | - | - |
| High School Diploma | $21,250 | $32,000 |
| College or Associate's Degree | $13,333 | $30,417 |
| Bachelor's Degree | - | - |
| Graduate Degree | - | - |
| Total | $19,688 | $30,455 |
Family Income in Kipnuk
Family Income Brackets in Kipnuk
According to the Kipnuk family income data, there are 32 families falling into the $50,000 to $74,999 income range, which is the most common income bracket and makes up 28.1% of all families.
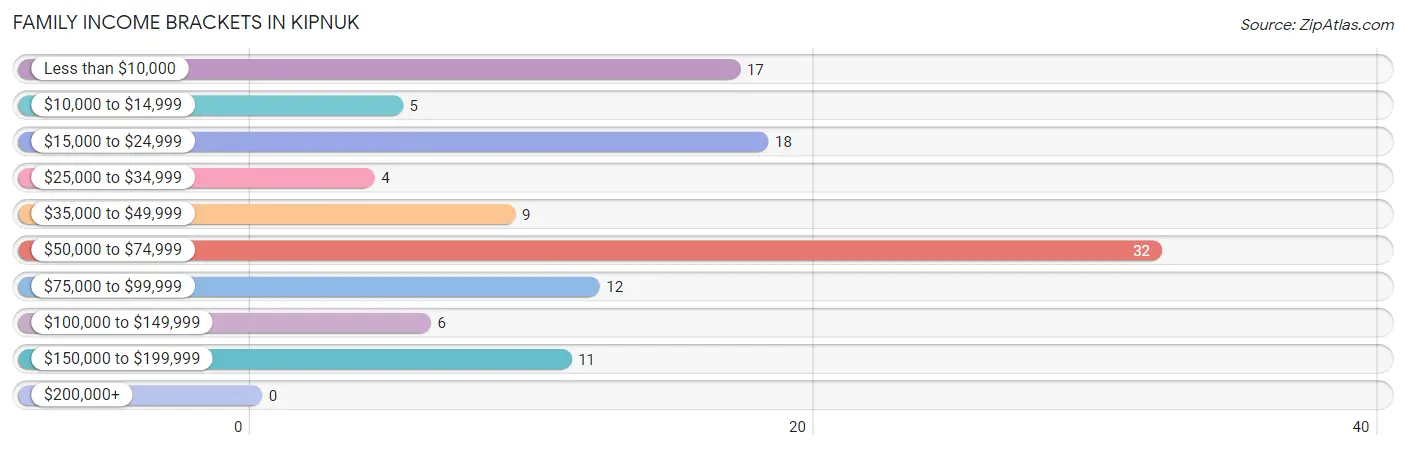
| Income Bracket | # Families | % Families |
| Less than $10,000 | 17 | 14.9% |
| $10,000 to $14,999 | 5 | 4.4% |
| $15,000 to $24,999 | 18 | 15.8% |
| $25,000 to $34,999 | 4 | 3.5% |
| $35,000 to $49,999 | 9 | 7.9% |
| $50,000 to $74,999 | 32 | 28.1% |
| $75,000 to $99,999 | 12 | 10.5% |
| $100,000 to $149,999 | 6 | 5.3% |
| $150,000 to $199,999 | 11 | 9.6% |
| $200,000+ | 0 | 0.0% |
Family Income by Famaliy Size in Kipnuk
6-person families (20 | 17.5%) account for the highest median family income in Kipnuk with $81,667 per family, while 4-person families (15 | 13.2%) have the highest median income of $19,062 per family member.
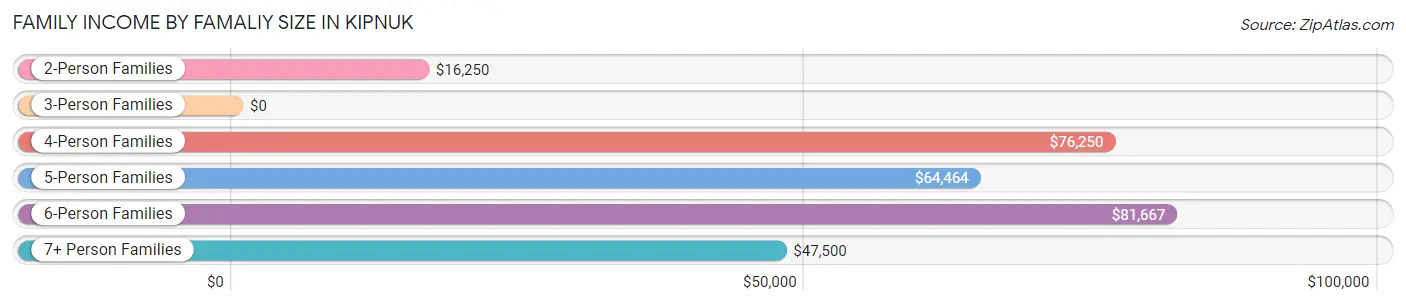
| Income Bracket | # Families | Median Income |
| 2-Person Families | 24 (21.0%) | $16,250 |
| 3-Person Families | 12 (10.5%) | $0 |
| 4-Person Families | 15 (13.2%) | $76,250 |
| 5-Person Families | 25 (21.9%) | $64,464 |
| 6-Person Families | 20 (17.5%) | $81,667 |
| 7+ Person Families | 18 (15.8%) | $47,500 |
| Total | 114 (100.0%) | $60,278 |
Family Income by Number of Earners in Kipnuk
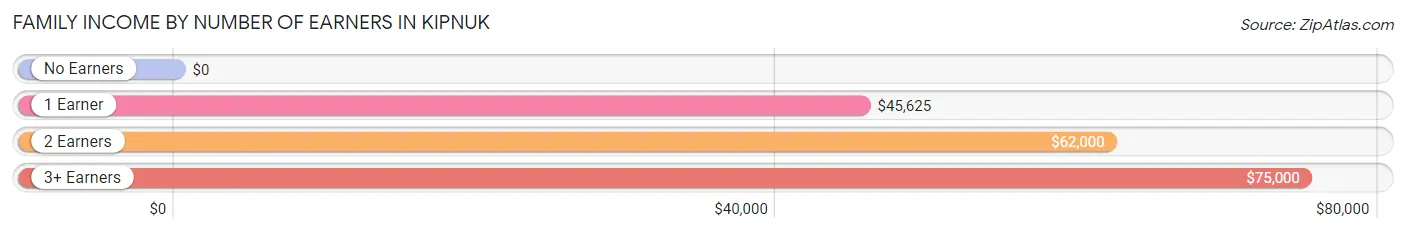
| Number of Earners | # Families | Median Income |
| No Earners | 27 (23.7%) | $0 |
| 1 Earner | 17 (14.9%) | $45,625 |
| 2 Earners | 40 (35.1%) | $62,000 |
| 3+ Earners | 30 (26.3%) | $75,000 |
| Total | 114 (100.0%) | $60,278 |
Household Income in Kipnuk
Household Income Brackets in Kipnuk
With 32 households falling in the category, the $50,000 to $74,999 income range is the most frequent in Kipnuk, accounting for 23.2% of all households.
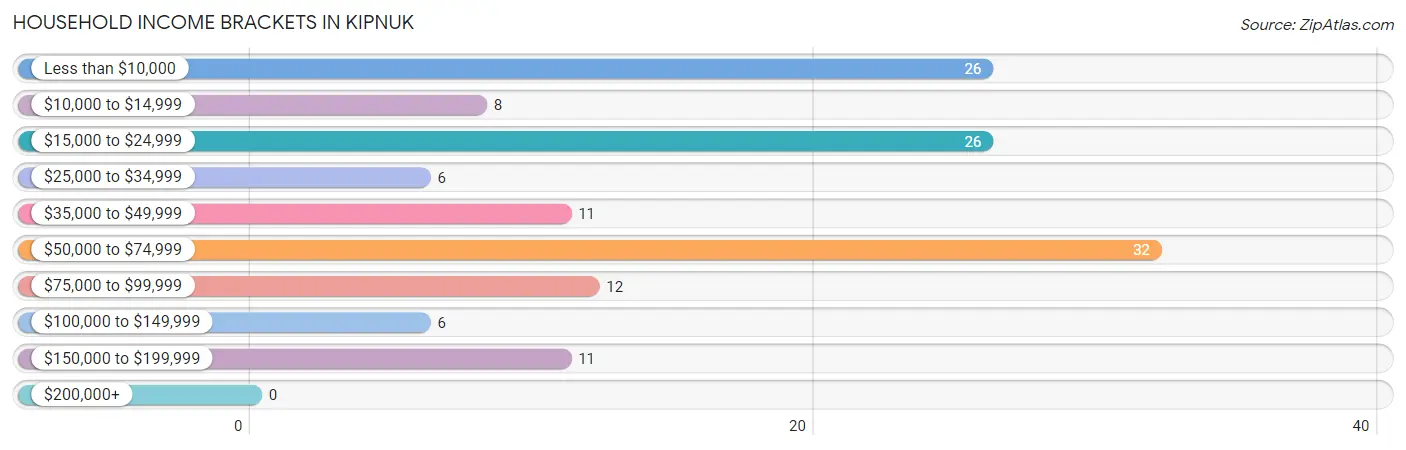
| Income Bracket | # Households | % Households |
| Less than $10,000 | 26 | 18.8% |
| $10,000 to $14,999 | 8 | 5.8% |
| $15,000 to $24,999 | 26 | 18.8% |
| $25,000 to $34,999 | 6 | 4.3% |
| $35,000 to $49,999 | 11 | 8.0% |
| $50,000 to $74,999 | 32 | 23.2% |
| $75,000 to $99,999 | 12 | 8.7% |
| $100,000 to $149,999 | 6 | 4.3% |
| $150,000 to $199,999 | 11 | 8.0% |
| $200,000+ | 0 | 0.0% |
Household Income by Householder Age in Kipnuk
The median household income in Kipnuk is $43,750, with the highest median household income of $53,333 found in the 45 to 64 years age bracket for the primary householder. A total of 70 households (50.7%) fall into this category.
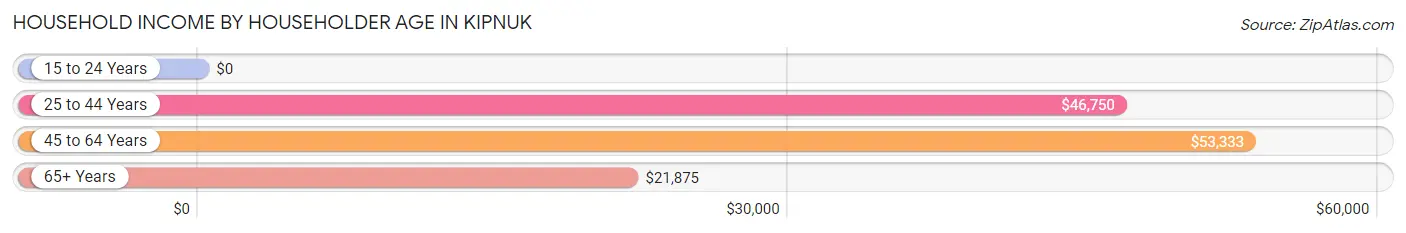
| Income Bracket | # Households | Median Income |
| 15 to 24 Years | 0 (0.0%) | $0 |
| 25 to 44 Years | 37 (26.8%) | $46,750 |
| 45 to 64 Years | 70 (50.7%) | $53,333 |
| 65+ Years | 31 (22.5%) | $21,875 |
| Total | 138 (100.0%) | $43,750 |
Poverty in Kipnuk
Income Below Poverty by Sex and Age in Kipnuk
With 32.4% poverty level for males and 34.0% for females among the residents of Kipnuk, 25 to 34 year old males and under 5 year old females are the most vulnerable to poverty, with 18 males (51.4%) and 22 females (59.5%) in their respective age groups living below the poverty level.
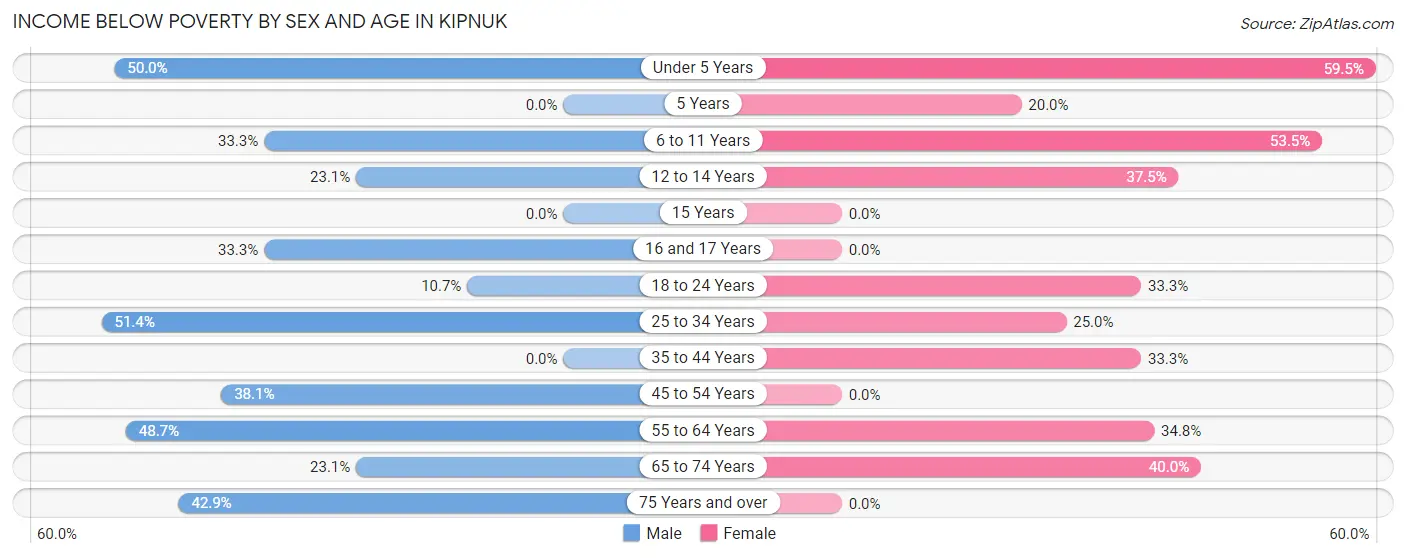
| Age Bracket | Male | Female |
| Under 5 Years | 15 (50.0%) | 22 (59.5%) |
| 5 Years | 0 (0.0%) | 3 (20.0%) |
| 6 to 11 Years | 9 (33.3%) | 23 (53.5%) |
| 12 to 14 Years | 3 (23.1%) | 9 (37.5%) |
| 15 Years | 0 (0.0%) | 0 (0.0%) |
| 16 and 17 Years | 3 (33.3%) | 0 (0.0%) |
| 18 to 24 Years | 3 (10.7%) | 6 (33.3%) |
| 25 to 34 Years | 18 (51.4%) | 11 (25.0%) |
| 35 to 44 Years | 0 (0.0%) | 10 (33.3%) |
| 45 to 54 Years | 16 (38.1%) | 0 (0.0%) |
| 55 to 64 Years | 19 (48.7%) | 8 (34.8%) |
| 65 to 74 Years | 3 (23.1%) | 6 (40.0%) |
| 75 Years and over | 3 (42.9%) | 0 (0.0%) |
| Total | 92 (32.4%) | 98 (34.0%) |
Income Above Poverty by Sex and Age in Kipnuk
According to the poverty statistics in Kipnuk, males aged 5 years and females aged 16 and 17 years are the age groups that are most secure financially, with 100.0% of males and 100.0% of females in these age groups living above the poverty line.
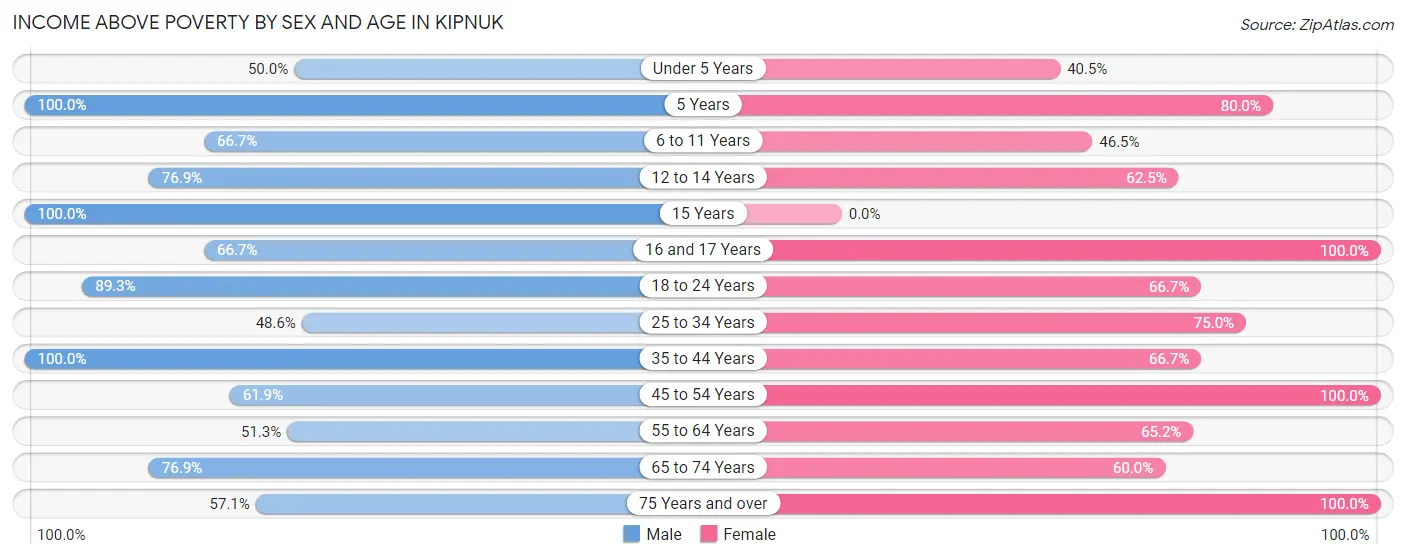
| Age Bracket | Male | Female |
| Under 5 Years | 15 (50.0%) | 15 (40.5%) |
| 5 Years | 10 (100.0%) | 12 (80.0%) |
| 6 to 11 Years | 18 (66.7%) | 20 (46.5%) |
| 12 to 14 Years | 10 (76.9%) | 15 (62.5%) |
| 15 Years | 9 (100.0%) | 0 (0.0%) |
| 16 and 17 Years | 6 (66.7%) | 14 (100.0%) |
| 18 to 24 Years | 25 (89.3%) | 12 (66.7%) |
| 25 to 34 Years | 17 (48.6%) | 33 (75.0%) |
| 35 to 44 Years | 22 (100.0%) | 20 (66.7%) |
| 45 to 54 Years | 26 (61.9%) | 18 (100.0%) |
| 55 to 64 Years | 20 (51.3%) | 15 (65.2%) |
| 65 to 74 Years | 10 (76.9%) | 9 (60.0%) |
| 75 Years and over | 4 (57.1%) | 7 (100.0%) |
| Total | 192 (67.6%) | 190 (66.0%) |
Income Below Poverty Among Married-Couple Families in Kipnuk
The poverty statistics for married-couple families in Kipnuk show that 28.1% or 25 of the total 89 families live below the poverty line. Families with 5 or more children have the highest poverty rate of 33.3%, comprising of 3 families. On the other hand, families with 1 or 2 children have the lowest poverty rate of 25.0%, which includes 8 families.
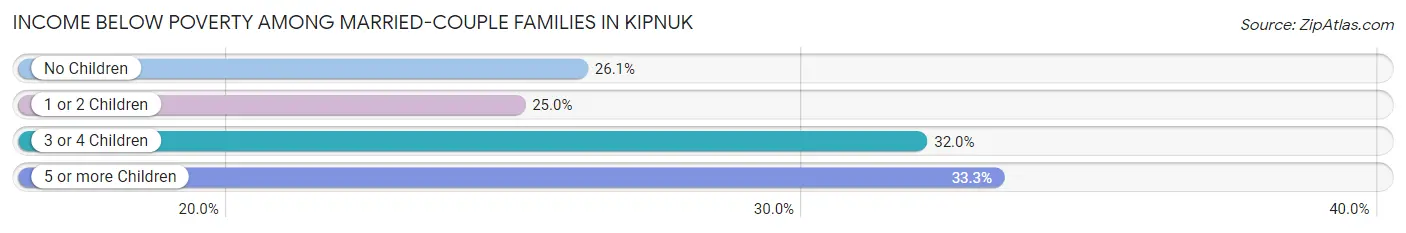
| Children | Above Poverty | Below Poverty |
| No Children | 17 (73.9%) | 6 (26.1%) |
| 1 or 2 Children | 24 (75.0%) | 8 (25.0%) |
| 3 or 4 Children | 17 (68.0%) | 8 (32.0%) |
| 5 or more Children | 6 (66.7%) | 3 (33.3%) |
| Total | 64 (71.9%) | 25 (28.1%) |
Income Below Poverty Among Single-Parent Households in Kipnuk
According to the poverty data in Kipnuk, 72.7% or 8 single-father households and 35.7% or 5 single-mother households are living below the poverty line. Among single-father households, those with no children have the highest poverty rate, with 6 households (100.0%) experiencing poverty. Likewise, among single-mother households, those with 3 or 4 children have the highest poverty rate, with 2 households (100.0%) falling below the poverty line.
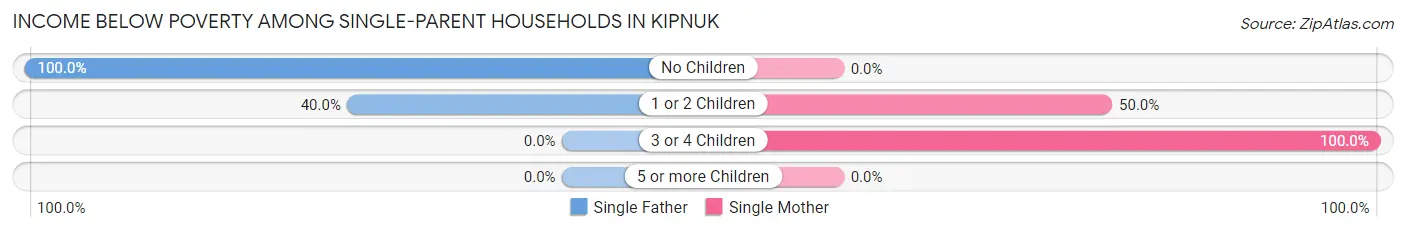
| Children | Single Father | Single Mother |
| No Children | 6 (100.0%) | 0 (0.0%) |
| 1 or 2 Children | 2 (40.0%) | 3 (50.0%) |
| 3 or 4 Children | 0 (0.0%) | 2 (100.0%) |
| 5 or more Children | 0 (0.0%) | 0 (0.0%) |
| Total | 8 (72.7%) | 5 (35.7%) |
Income Below Poverty Among Married-Couple vs Single-Parent Households in Kipnuk
The poverty data for Kipnuk shows that 25 of the married-couple family households (28.1%) and 13 of the single-parent households (52.0%) are living below the poverty level. Within the married-couple family households, those with 5 or more children have the highest poverty rate, with 3 households (33.3%) falling below the poverty line. Among the single-parent households, those with 3 or 4 children have the highest poverty rate, with 2 household (100.0%) living below poverty.
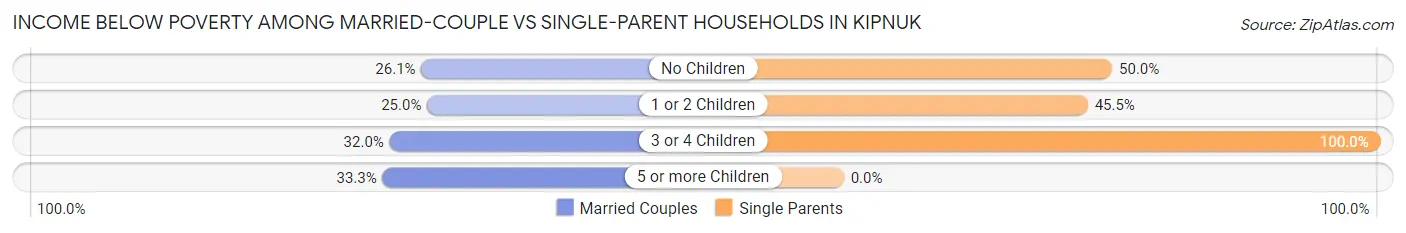
| Children | Married-Couple Families | Single-Parent Households |
| No Children | 6 (26.1%) | 6 (50.0%) |
| 1 or 2 Children | 8 (25.0%) | 5 (45.5%) |
| 3 or 4 Children | 8 (32.0%) | 2 (100.0%) |
| 5 or more Children | 3 (33.3%) | 0 (0.0%) |
| Total | 25 (28.1%) | 13 (52.0%) |
Race in Kipnuk
The most populous races in Kipnuk are Native / Alaskan (553 | 96.7%), Two or more Races (13 | 2.3%), and Black / African American (3 | 0.5%).
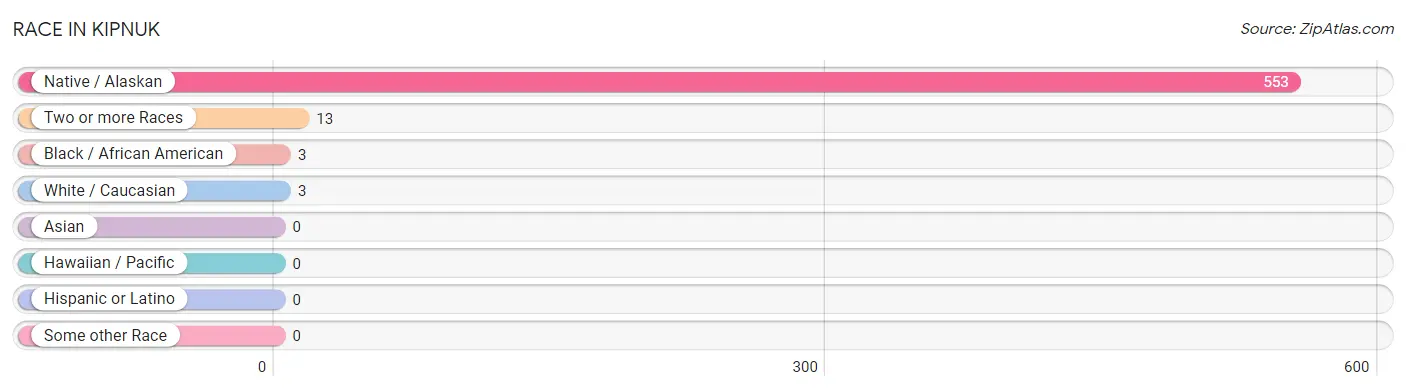
| Race | # Population | % Population |
| Asian | 0 | 0.0% |
| Black / African American | 3 | 0.5% |
| Hawaiian / Pacific | 0 | 0.0% |
| Hispanic or Latino | 0 | 0.0% |
| Native / Alaskan | 553 | 96.7% |
| White / Caucasian | 3 | 0.5% |
| Two or more Races | 13 | 2.3% |
| Some other Race | 0 | 0.0% |
| Total | 572 | 100.0% |
Ancestry in Kipnuk
The most populous ancestries reported in Kipnuk are Yup'ik (550 | 96.2%), Alaska Native (16 | 2.8%), Russian (16 | 2.8%), Portuguese (3 | 0.5%), and Pueblo (3 | 0.5%), together accounting for 102.8% of all Kipnuk residents.
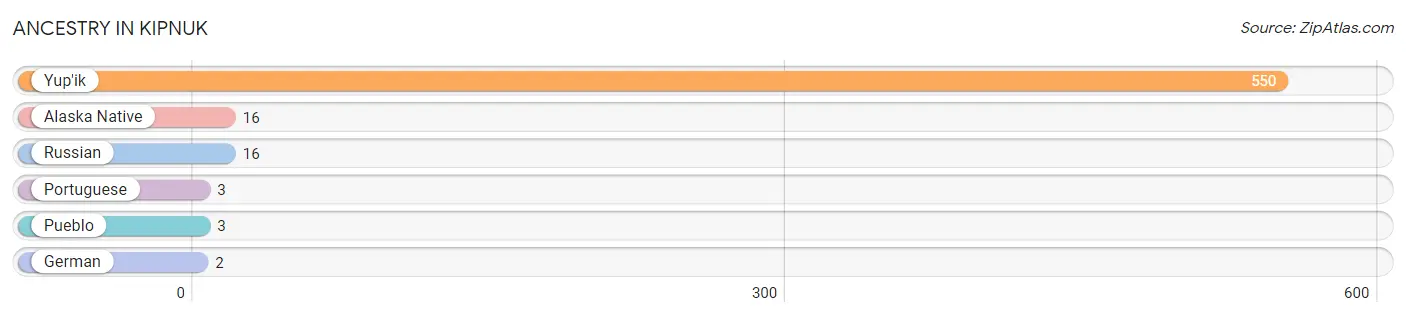
| Ancestry | # Population | % Population |
| Alaska Native | 16 | 2.8% |
| German | 2 | 0.4% |
| Portuguese | 3 | 0.5% |
| Pueblo | 3 | 0.5% |
| Russian | 16 | 2.8% |
| Yup'ik | 550 | 96.2% | View All 6 Rows |
Immigrants in Kipnuk

| Immigration Origin | # Population | % Population | View All 0 Rows |
Sex and Age in Kipnuk
Sex and Age in Kipnuk
The most populous age groups in Kipnuk are Under 5 Years (30 | 10.6%) for men and 5 to 9 Years (43 | 14.9%) for women.
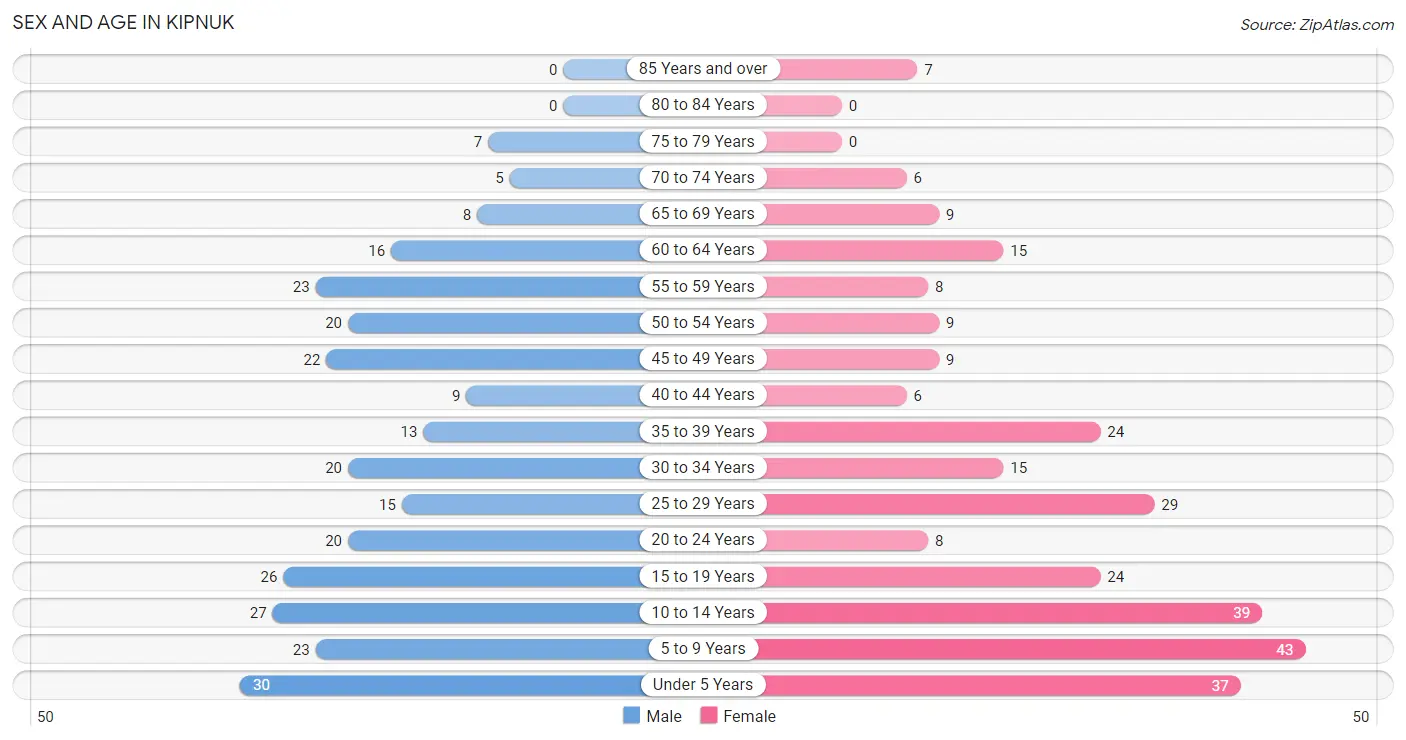
| Age Bracket | Male | Female |
| Under 5 Years | 30 (10.6%) | 37 (12.9%) |
| 5 to 9 Years | 23 (8.1%) | 43 (14.9%) |
| 10 to 14 Years | 27 (9.5%) | 39 (13.5%) |
| 15 to 19 Years | 26 (9.1%) | 24 (8.3%) |
| 20 to 24 Years | 20 (7.0%) | 8 (2.8%) |
| 25 to 29 Years | 15 (5.3%) | 29 (10.1%) |
| 30 to 34 Years | 20 (7.0%) | 15 (5.2%) |
| 35 to 39 Years | 13 (4.6%) | 24 (8.3%) |
| 40 to 44 Years | 9 (3.2%) | 6 (2.1%) |
| 45 to 49 Years | 22 (7.7%) | 9 (3.1%) |
| 50 to 54 Years | 20 (7.0%) | 9 (3.1%) |
| 55 to 59 Years | 23 (8.1%) | 8 (2.8%) |
| 60 to 64 Years | 16 (5.6%) | 15 (5.2%) |
| 65 to 69 Years | 8 (2.8%) | 9 (3.1%) |
| 70 to 74 Years | 5 (1.8%) | 6 (2.1%) |
| 75 to 79 Years | 7 (2.5%) | 0 (0.0%) |
| 80 to 84 Years | 0 (0.0%) | 0 (0.0%) |
| 85 Years and over | 0 (0.0%) | 7 (2.4%) |
| Total | 284 (100.0%) | 288 (100.0%) |
Families and Households in Kipnuk
Median Family Size in Kipnuk
The median family size in Kipnuk is 4.70 persons per family, with married-couple families (89 | 78.1%) accounting for the largest median family size of 5.18 persons per family. On the other hand, single male/father families (11 | 9.7%) represent the smallest median family size with 2.91 persons per family.
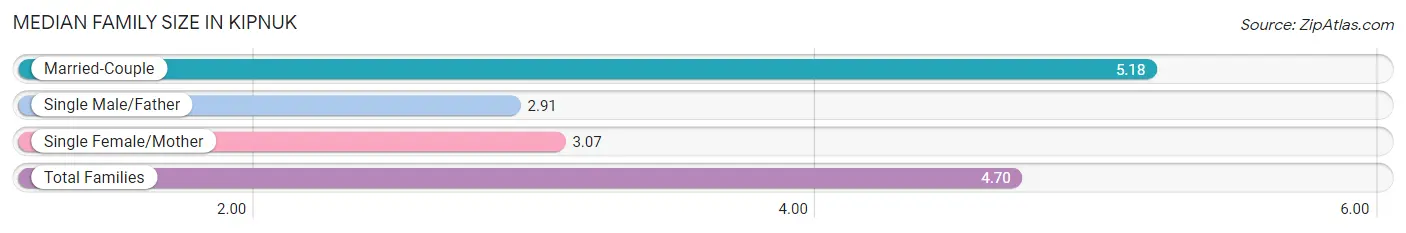
| Family Type | # Families | Family Size |
| Married-Couple | 89 (78.1%) | 5.18 |
| Single Male/Father | 11 (9.7%) | 2.91 |
| Single Female/Mother | 14 (12.3%) | 3.07 |
| Total Families | 114 (100.0%) | 4.70 |
Median Household Size in Kipnuk
The median household size in Kipnuk is 4.14 persons per household, with married-couple households (89 | 64.5%) accounting for the largest median household size of 5.24 persons per household. non-family households (24 | 17.4%) represent the smallest median household size with 1.13 persons per household.
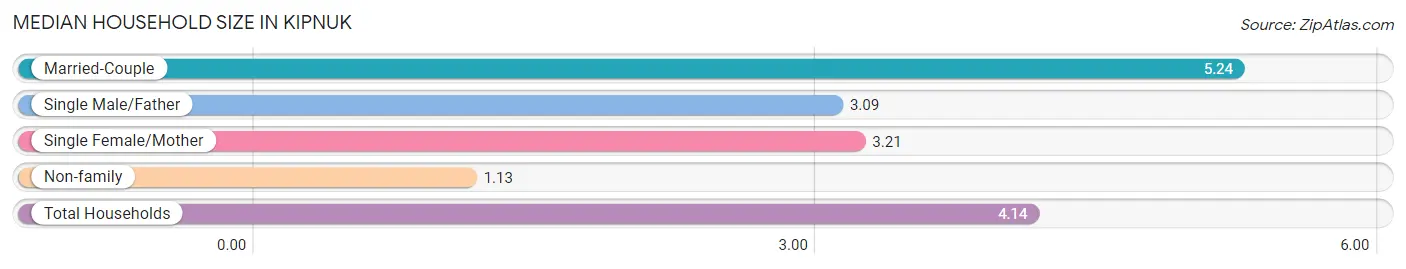
| Household Type | # Households | Household Size |
| Married-Couple | 89 (64.5%) | 5.24 |
| Single Male/Father | 11 (8.0%) | 3.09 |
| Single Female/Mother | 14 (10.1%) | 3.21 |
| Non-family | 24 (17.4%) | 1.13 |
| Total Households | 138 (100.0%) | 4.14 |
Household Size by Marriage Status in Kipnuk
Out of a total of 138 households in Kipnuk, 114 (82.6%) are family households, while 24 (17.4%) are nonfamily households. The most numerous type of family households are 2-person households, comprising 24, and the most common type of nonfamily households are 1-person households, comprising 21.
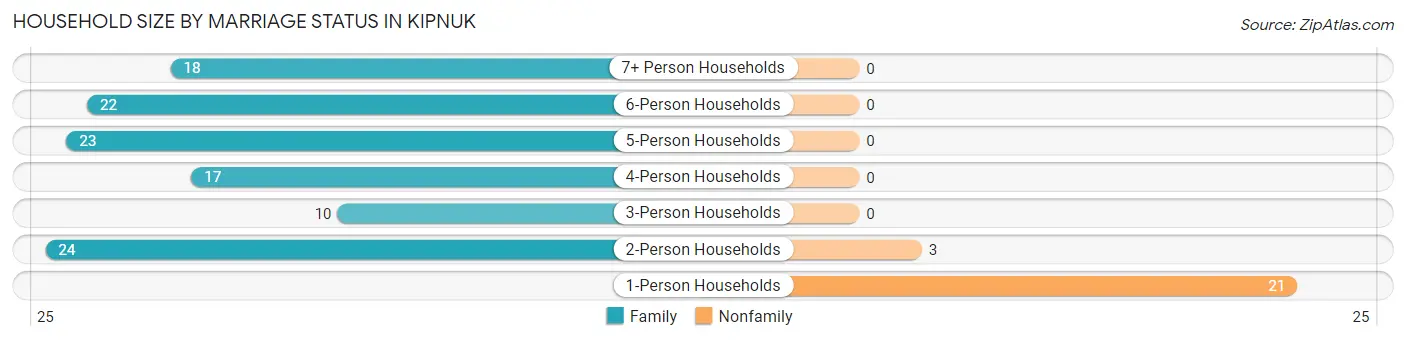
| Household Size | Family Households | Nonfamily Households |
| 1-Person Households | - | 21 (15.2%) |
| 2-Person Households | 24 (17.4%) | 3 (2.2%) |
| 3-Person Households | 10 (7.2%) | 0 (0.0%) |
| 4-Person Households | 17 (12.3%) | 0 (0.0%) |
| 5-Person Households | 23 (16.7%) | 0 (0.0%) |
| 6-Person Households | 22 (15.9%) | 0 (0.0%) |
| 7+ Person Households | 18 (13.0%) | 0 (0.0%) |
| Total | 114 (82.6%) | 24 (17.4%) |
Female Fertility in Kipnuk
Fertility by Age in Kipnuk
Average fertility rate in Kipnuk is 42.0 births per 1,000 women. Women in the age bracket of 15 to 19 years have the highest fertility rate with 125.0 births per 1,000 women. Women in the age bracket of 15 to 19 years acount for 60.0% of all women with births.
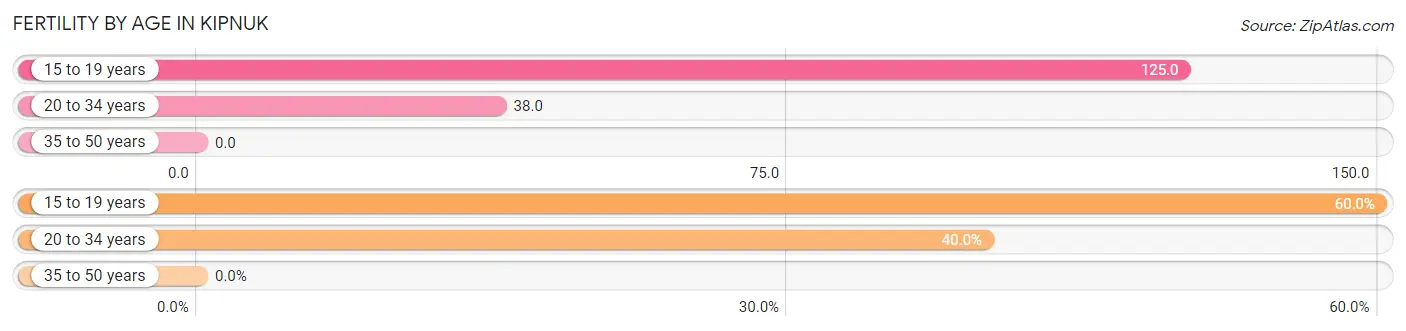
| Age Bracket | Women with Births | Births / 1,000 Women |
| 15 to 19 years | 3 (60.0%) | 125.0 |
| 20 to 34 years | 2 (40.0%) | 38.0 |
| 35 to 50 years | 0 (0.0%) | 0.0 |
| Total | 5 (100.0%) | 42.0 |
Fertility by Age by Marriage Status in Kipnuk
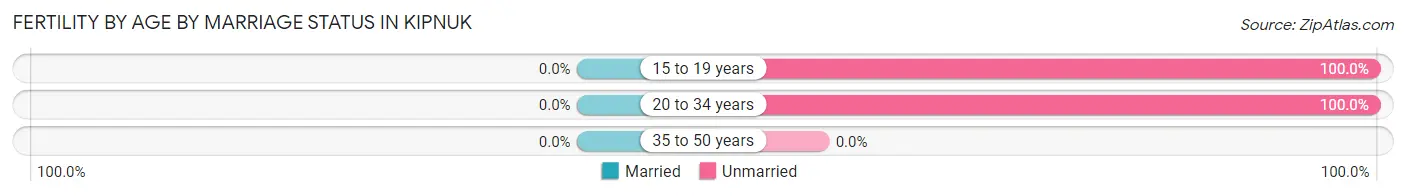
| Age Bracket | Married | Unmarried |
| 15 to 19 years | 0 (0.0%) | 3 (100.0%) |
| 20 to 34 years | 0 (0.0%) | 2 (100.0%) |
| 35 to 50 years | 0 (0.0%) | 0 (0.0%) |
| Total | 0 (0.0%) | 5 (100.0%) |
Fertility by Education in Kipnuk
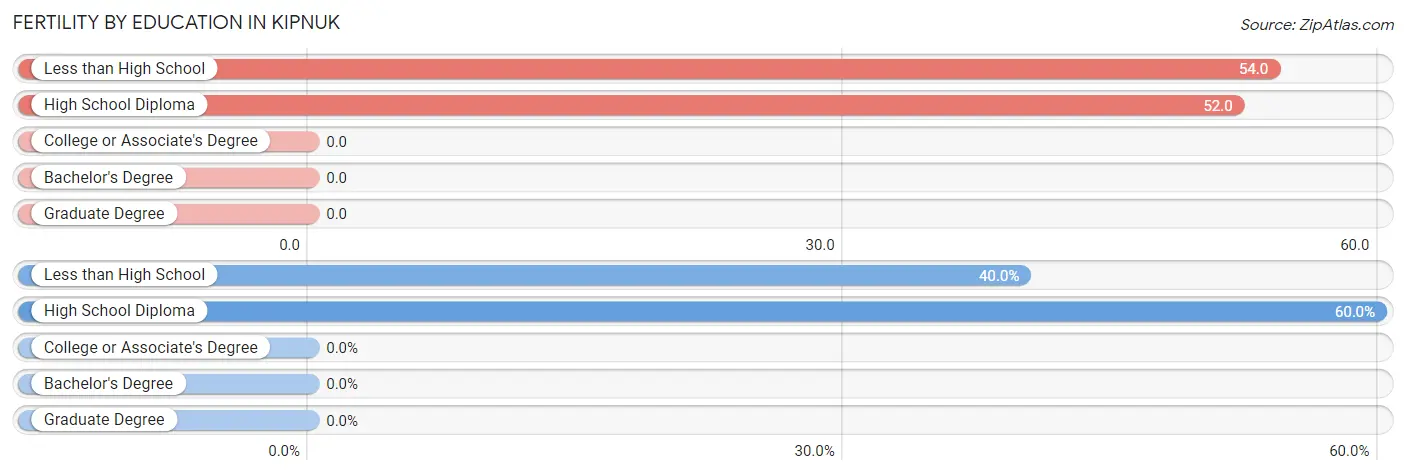
| Educational Attainment | Women with Births | Births / 1,000 Women |
| Less than High School | 2 (40.0%) | 54.0 |
| High School Diploma | 3 (60.0%) | 52.0 |
| College or Associate's Degree | 0 (0.0%) | 0.0 |
| Bachelor's Degree | 0 (0.0%) | 0.0 |
| Graduate Degree | 0 (0.0%) | 0.0 |
| Total | 5 (100.0%) | 42.0 |
Fertility by Education by Marriage Status in Kipnuk
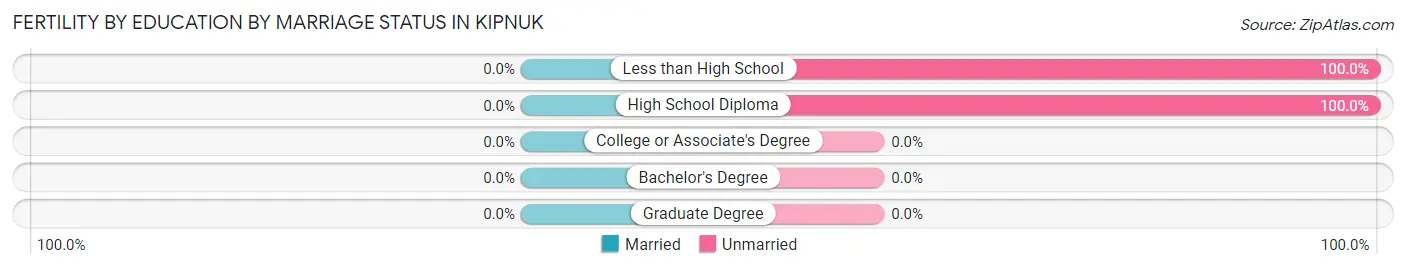
| Educational Attainment | Married | Unmarried |
| Less than High School | 0 (0.0%) | 2 (100.0%) |
| High School Diploma | 0 (0.0%) | 3 (100.0%) |
| College or Associate's Degree | 0 (0.0%) | 0 (0.0%) |
| Bachelor's Degree | 0 (0.0%) | 0 (0.0%) |
| Graduate Degree | 0 (0.0%) | 0 (0.0%) |
| Total | 0 (0.0%) | 5 (100.0%) |
Employment Characteristics in Kipnuk
Employment by Class of Employer in Kipnuk
Among the 134 employed individuals in Kipnuk, local government employees (44 | 32.8%), private company employees (42 | 31.3%), and not-for-profit organizations (26 | 19.4%) make up the most common classes of employment.
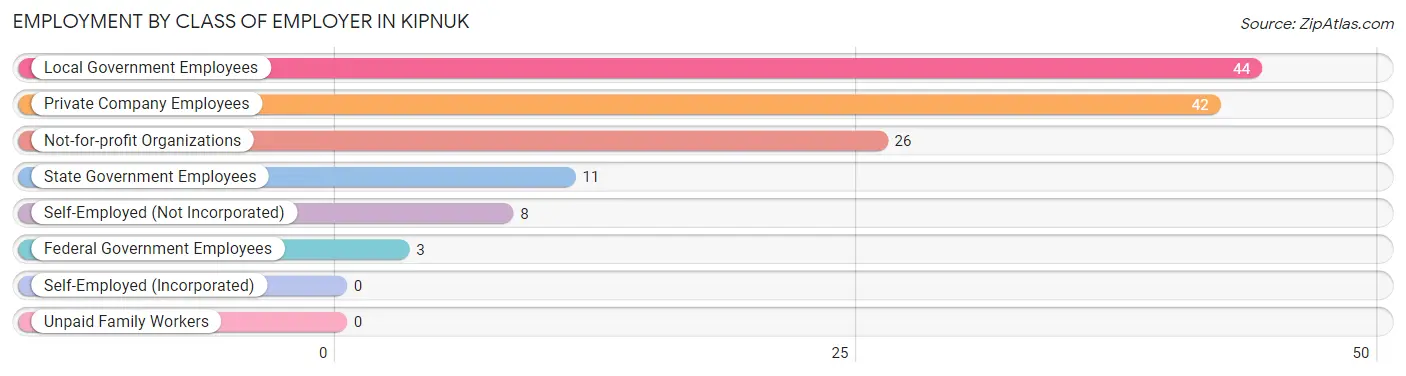
| Employer Class | # Employees | % Employees |
| Private Company Employees | 42 | 31.3% |
| Self-Employed (Incorporated) | 0 | 0.0% |
| Self-Employed (Not Incorporated) | 8 | 6.0% |
| Not-for-profit Organizations | 26 | 19.4% |
| Local Government Employees | 44 | 32.8% |
| State Government Employees | 11 | 8.2% |
| Federal Government Employees | 3 | 2.2% |
| Unpaid Family Workers | 0 | 0.0% |
| Total | 134 | 100.0% |
Employment Status by Age in Kipnuk
According to the labor force statistics for Kipnuk, out of the total population over 16 years of age (364), 51.1% or 186 individuals are in the labor force, with 26.3% or 49 of them unemployed. The age group with the highest labor force participation rate is 45 to 54 years, with 73.3% or 44 individuals in the labor force. Within the labor force, the 30 to 34 years age range has the highest percentage of unemployed individuals, with 45.0% or 9 of them being unemployed.
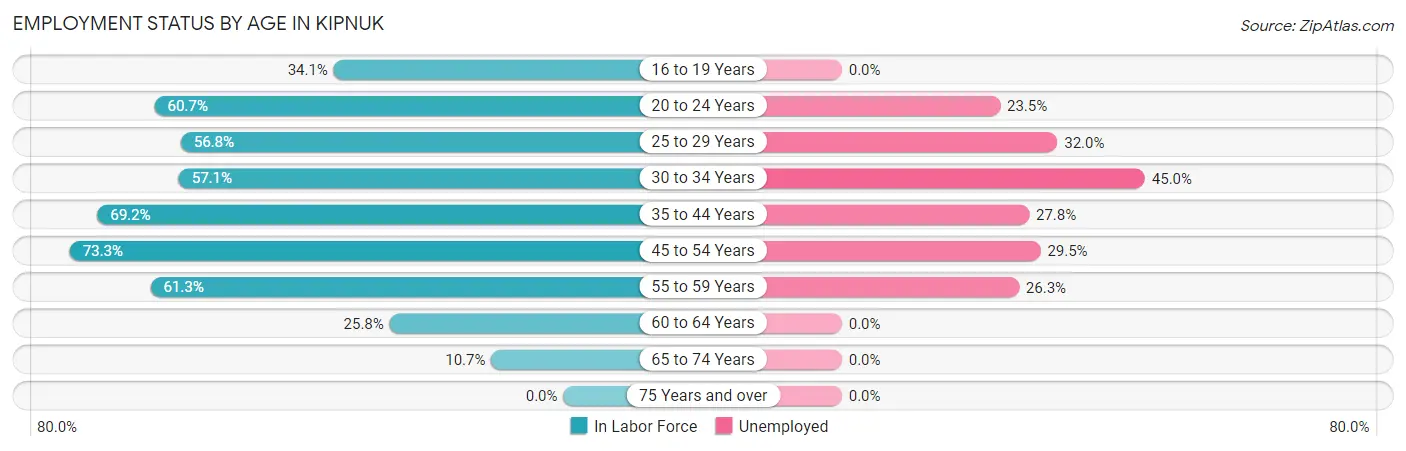
| Age Bracket | In Labor Force | Unemployed |
| 16 to 19 Years | 14 (34.1%) | 0 (0.0%) |
| 20 to 24 Years | 17 (60.7%) | 4 (23.5%) |
| 25 to 29 Years | 25 (56.8%) | 8 (32.0%) |
| 30 to 34 Years | 20 (57.1%) | 9 (45.0%) |
| 35 to 44 Years | 36 (69.2%) | 10 (27.8%) |
| 45 to 54 Years | 44 (73.3%) | 13 (29.5%) |
| 55 to 59 Years | 19 (61.3%) | 5 (26.3%) |
| 60 to 64 Years | 8 (25.8%) | 0 (0.0%) |
| 65 to 74 Years | 3 (10.7%) | 0 (0.0%) |
| 75 Years and over | 0 (0.0%) | 0 (0.0%) |
| Total | 186 (51.1%) | 49 (26.3%) |
Employment Status by Educational Attainment in Kipnuk
According to labor force statistics for Kipnuk, 60.1% of individuals (152) out of the total population between 25 and 64 years of age (253) are in the labor force, with 29.6% or 45 of them being unemployed. The group with the highest labor force participation rate are those with the educational attainment of high school diploma, with 67.2% or 119 individuals in the labor force. Within the labor force, individuals with college / associate degree education have the highest percentage of unemployment, with 48.0% or 12 of them being unemployed.
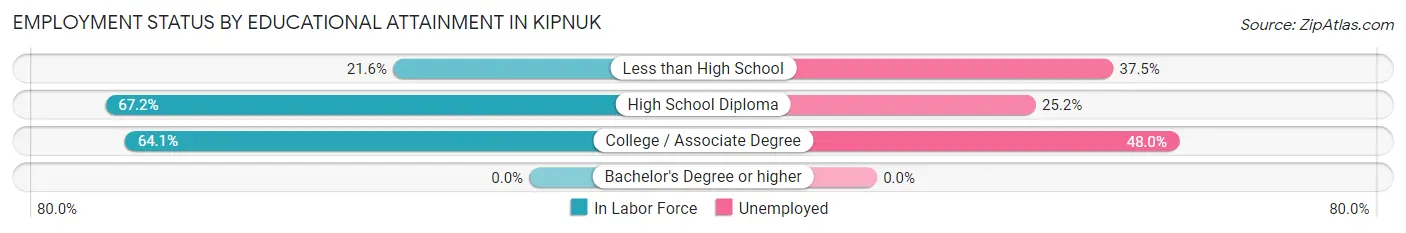
| Educational Attainment | In Labor Force | Unemployed |
| Less than High School | 8 (21.6%) | 14 (37.5%) |
| High School Diploma | 119 (67.2%) | 45 (25.2%) |
| College / Associate Degree | 25 (64.1%) | 19 (48.0%) |
| Bachelor's Degree or higher | 0 (0.0%) | 0 (0.0%) |
| Total | 152 (60.1%) | 75 (29.6%) |
Employment Occupations by Sex in Kipnuk
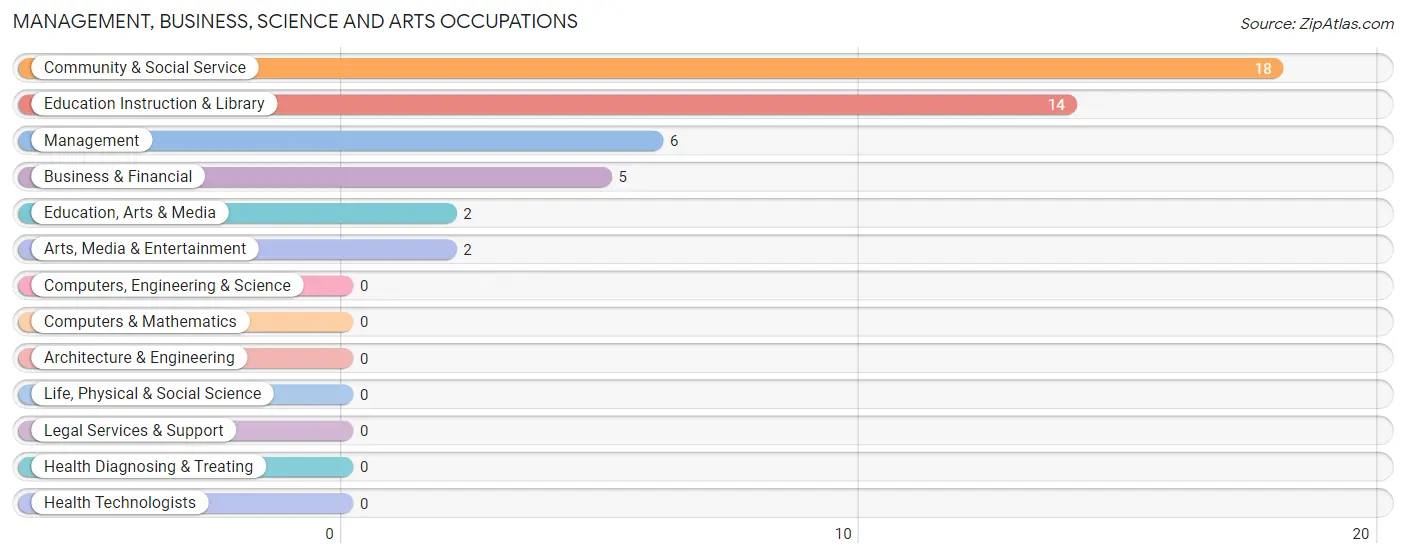
Management, Business, Science and Arts Occupations
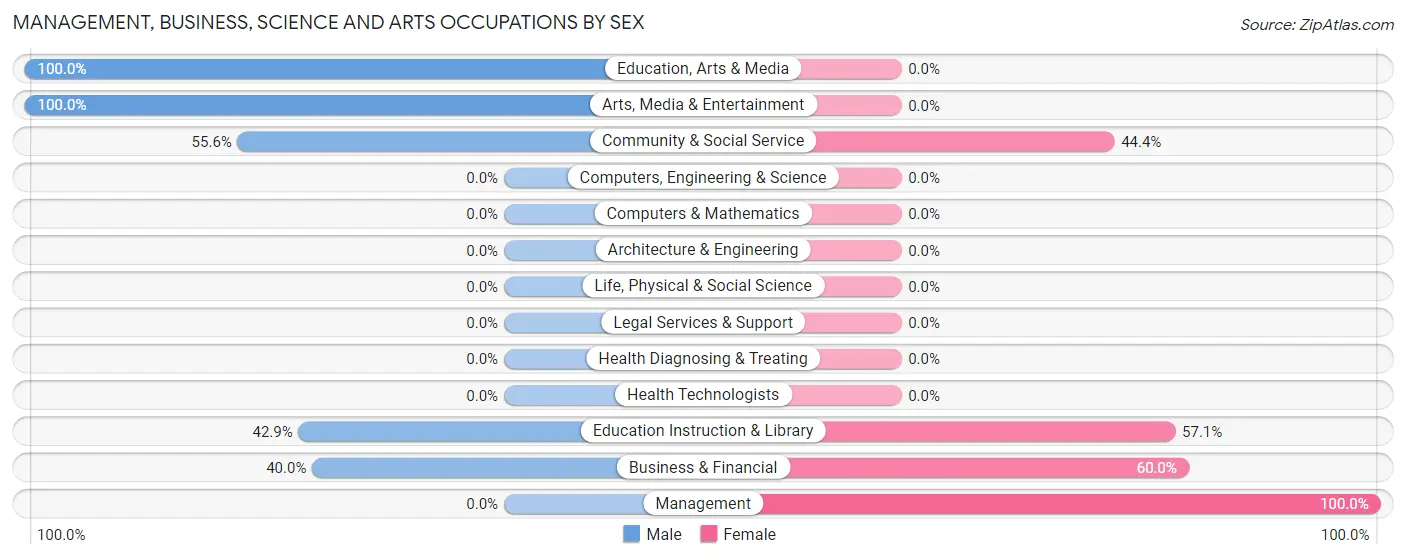
The most common Management, Business, Science and Arts occupations in Kipnuk are Community & Social Service (18 | 13.1%), Education Instruction & Library (14 | 10.2%), Management (6 | 4.4%), Business & Financial (5 | 3.6%), and Education, Arts & Media (2 | 1.5%).
Management, Business, Science and Arts Occupations by Sex
Within the Management, Business, Science and Arts occupations in Kipnuk, the most male-oriented occupations are Education, Arts & Media (100.0%), Arts, Media & Entertainment (100.0%), and Community & Social Service (55.6%), while the most female-oriented occupations are Management (100.0%), Business & Financial (60.0%), and Education Instruction & Library (57.1%).
| Occupation | Male | Female |
| Management | 0 (0.0%) | 6 (100.0%) |
| Business & Financial | 2 (40.0%) | 3 (60.0%) |
| Computers, Engineering & Science | 0 (0.0%) | 0 (0.0%) |
| Computers & Mathematics | 0 (0.0%) | 0 (0.0%) |
| Architecture & Engineering | 0 (0.0%) | 0 (0.0%) |
| Life, Physical & Social Science | 0 (0.0%) | 0 (0.0%) |
| Community & Social Service | 10 (55.6%) | 8 (44.4%) |
| Education, Arts & Media | 2 (100.0%) | 0 (0.0%) |
| Legal Services & Support | 0 (0.0%) | 0 (0.0%) |
| Education Instruction & Library | 6 (42.9%) | 8 (57.1%) |
| Arts, Media & Entertainment | 2 (100.0%) | 0 (0.0%) |
| Health Diagnosing & Treating | 0 (0.0%) | 0 (0.0%) |
| Health Technologists | 0 (0.0%) | 0 (0.0%) |
| Total (Category) | 12 (41.4%) | 17 (58.6%) |
| Total (Overall) | 80 (58.4%) | 57 (41.6%) |
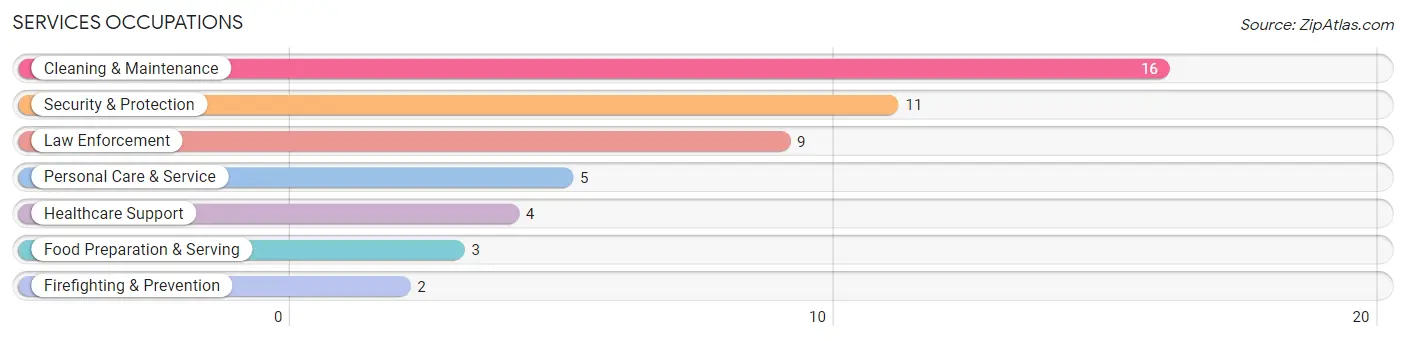
Services Occupations
The most common Services occupations in Kipnuk are Cleaning & Maintenance (16 | 11.7%), Security & Protection (11 | 8.0%), Law Enforcement (9 | 6.6%), Personal Care & Service (5 | 3.6%), and Healthcare Support (4 | 2.9%).
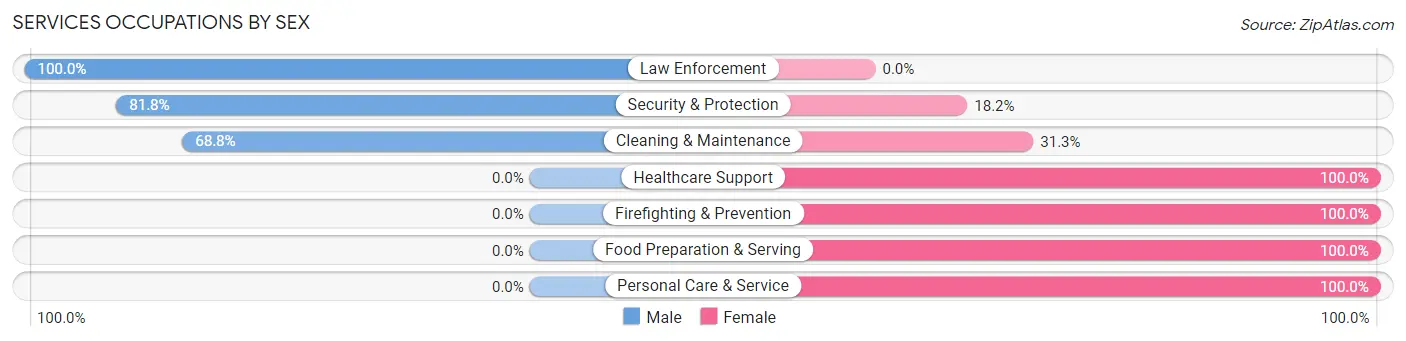
Services Occupations by Sex
Within the Services occupations in Kipnuk, the most male-oriented occupations are Law Enforcement (100.0%), Security & Protection (81.8%), and Cleaning & Maintenance (68.8%), while the most female-oriented occupations are Healthcare Support (100.0%), Firefighting & Prevention (100.0%), and Food Preparation & Serving (100.0%).
| Occupation | Male | Female |
| Healthcare Support | 0 (0.0%) | 4 (100.0%) |
| Security & Protection | 9 (81.8%) | 2 (18.2%) |
| Firefighting & Prevention | 0 (0.0%) | 2 (100.0%) |
| Law Enforcement | 9 (100.0%) | 0 (0.0%) |
| Food Preparation & Serving | 0 (0.0%) | 3 (100.0%) |
| Cleaning & Maintenance | 11 (68.8%) | 5 (31.2%) |
| Personal Care & Service | 0 (0.0%) | 5 (100.0%) |
| Total (Category) | 20 (51.3%) | 19 (48.7%) |
| Total (Overall) | 80 (58.4%) | 57 (41.6%) |
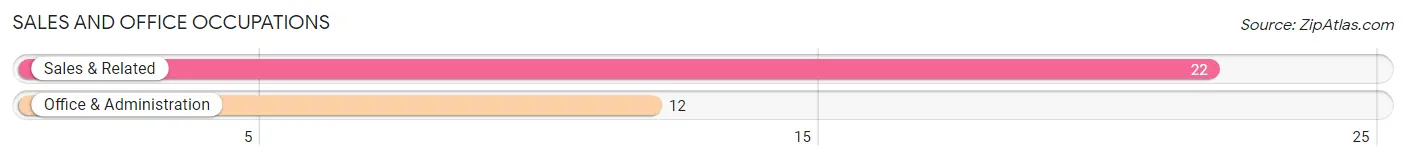
Sales and Office Occupations
The most common Sales and Office occupations in Kipnuk are Sales & Related (22 | 16.1%), and Office & Administration (12 | 8.8%).
Sales and Office Occupations by Sex
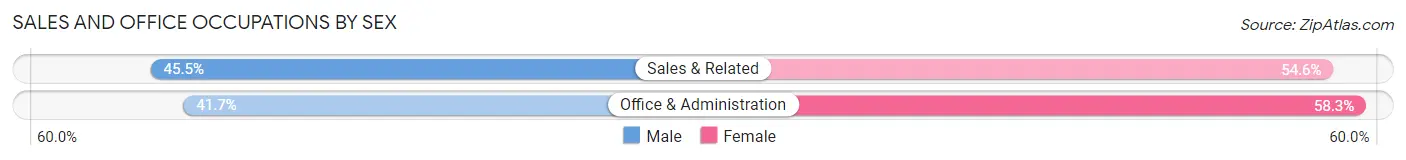
| Occupation | Male | Female |
| Sales & Related | 10 (45.5%) | 12 (54.5%) |
| Office & Administration | 5 (41.7%) | 7 (58.3%) |
| Total (Category) | 15 (44.1%) | 19 (55.9%) |
| Total (Overall) | 80 (58.4%) | 57 (41.6%) |
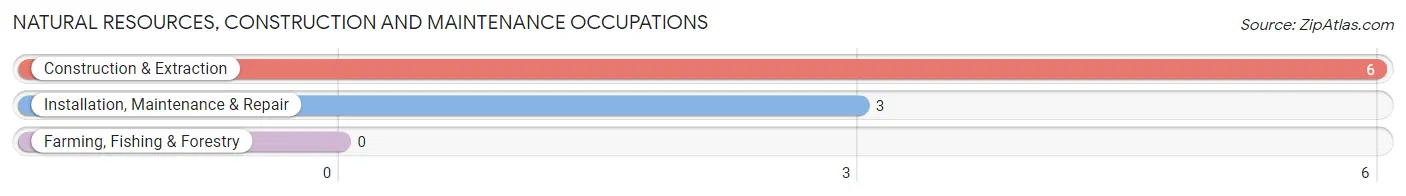
Natural Resources, Construction and Maintenance Occupations
The most common Natural Resources, Construction and Maintenance occupations in Kipnuk are Construction & Extraction (6 | 4.4%), and Installation, Maintenance & Repair (3 | 2.2%).
Natural Resources, Construction and Maintenance Occupations by Sex
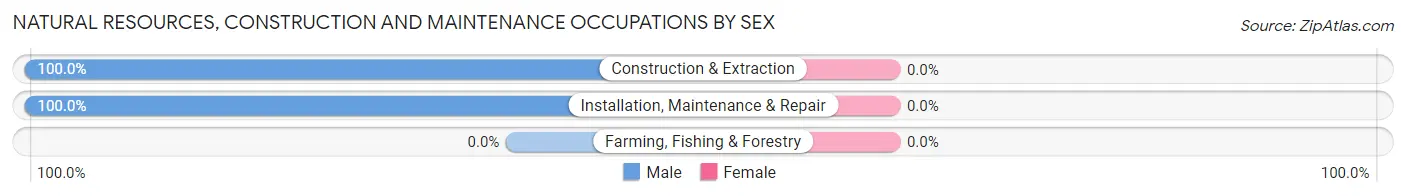
| Occupation | Male | Female |
| Farming, Fishing & Forestry | 0 (0.0%) | 0 (0.0%) |
| Construction & Extraction | 6 (100.0%) | 0 (0.0%) |
| Installation, Maintenance & Repair | 3 (100.0%) | 0 (0.0%) |
| Total (Category) | 9 (100.0%) | 0 (0.0%) |
| Total (Overall) | 80 (58.4%) | 57 (41.6%) |
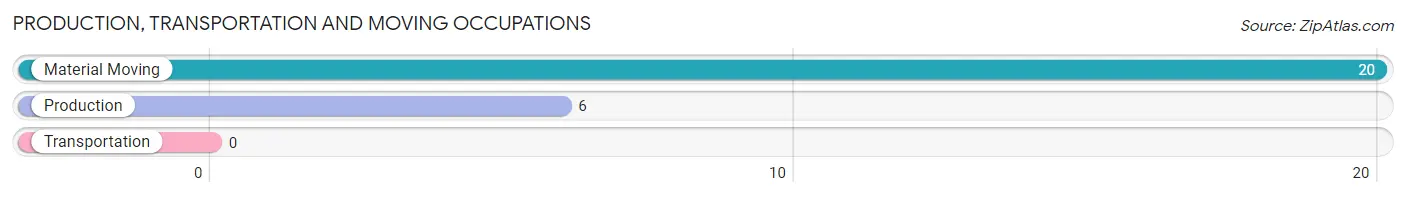
Production, Transportation and Moving Occupations
The most common Production, Transportation and Moving occupations in Kipnuk are Material Moving (20 | 14.6%), and Production (6 | 4.4%).
Production, Transportation and Moving Occupations by Sex
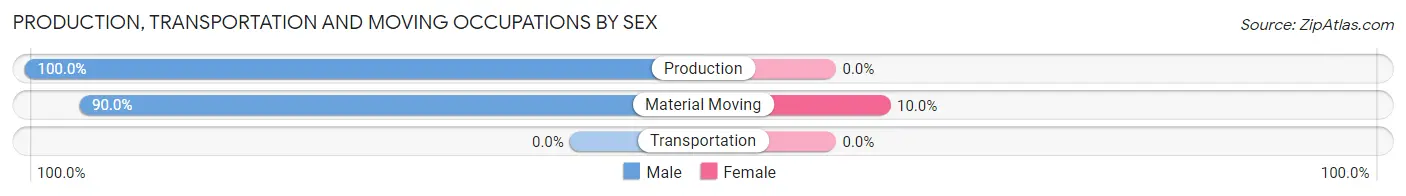
| Occupation | Male | Female |
| Production | 6 (100.0%) | 0 (0.0%) |
| Transportation | 0 (0.0%) | 0 (0.0%) |
| Material Moving | 18 (90.0%) | 2 (10.0%) |
| Total (Category) | 24 (92.3%) | 2 (7.7%) |
| Total (Overall) | 80 (58.4%) | 57 (41.6%) |
Employment Industries by Sex in Kipnuk
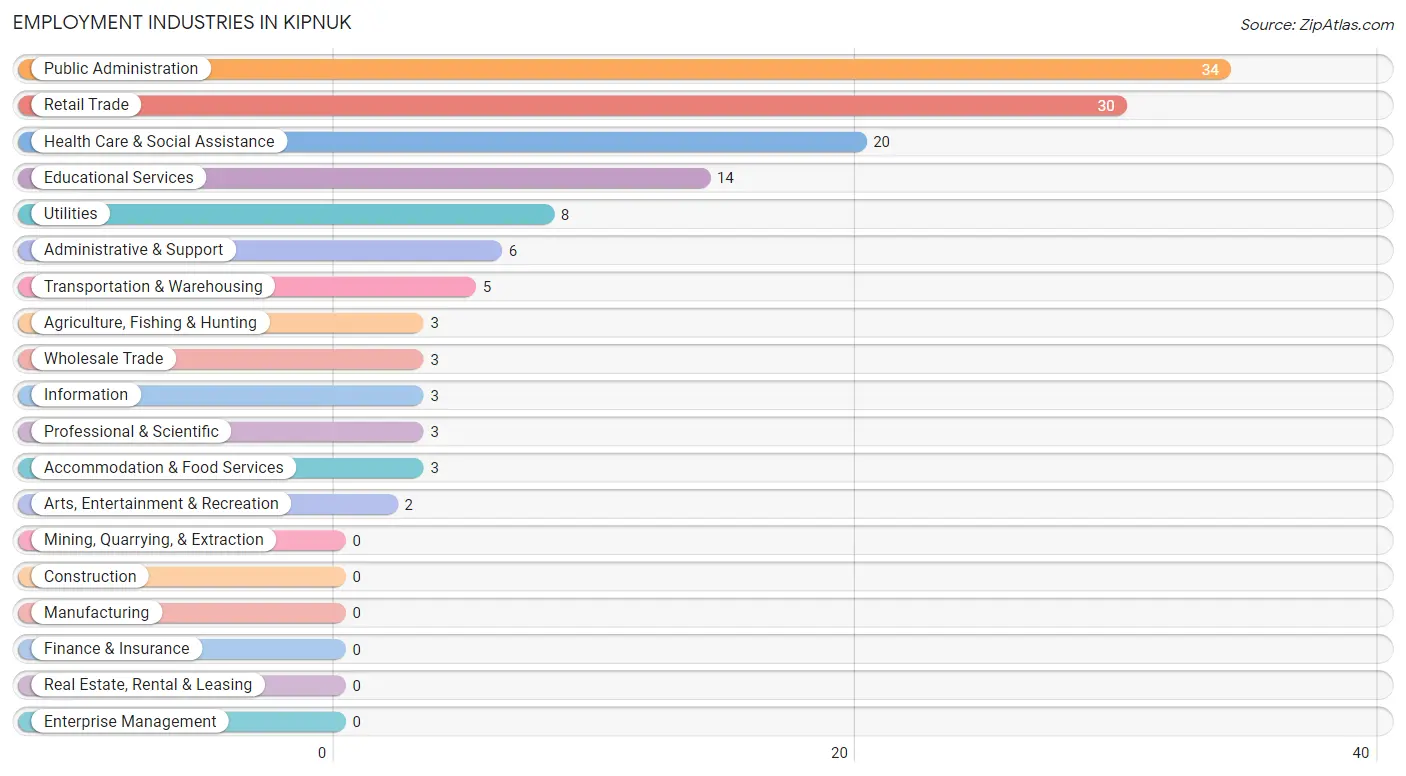
Employment Industries in Kipnuk
The major employment industries in Kipnuk include Public Administration (34 | 24.8%), Retail Trade (30 | 21.9%), Health Care & Social Assistance (20 | 14.6%), Educational Services (14 | 10.2%), and Utilities (8 | 5.8%).
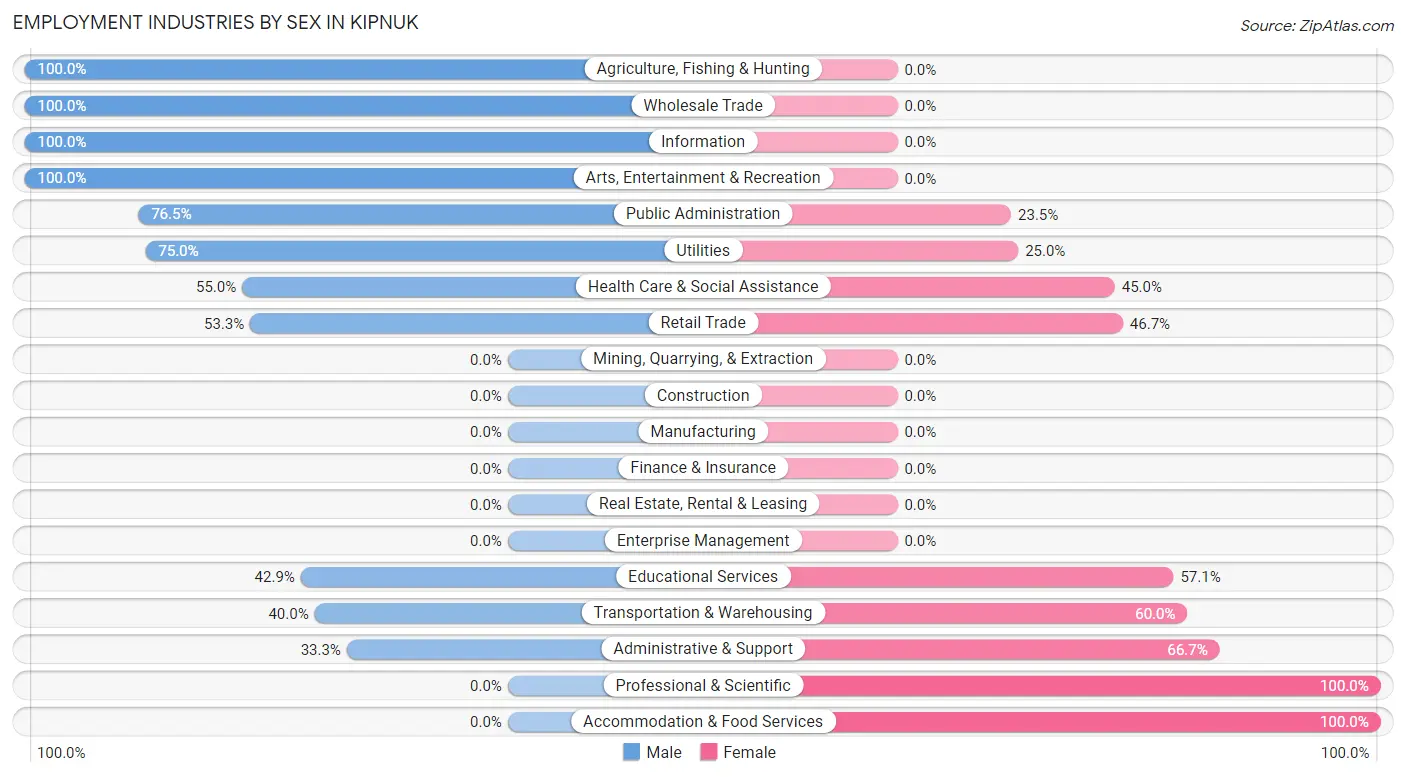
Employment Industries by Sex in Kipnuk
The Kipnuk industries that see more men than women are Agriculture, Fishing & Hunting (100.0%), Wholesale Trade (100.0%), and Information (100.0%), whereas the industries that tend to have a higher number of women are Professional & Scientific (100.0%), Accommodation & Food Services (100.0%), and Administrative & Support (66.7%).
| Industry | Male | Female |
| Agriculture, Fishing & Hunting | 3 (100.0%) | 0 (0.0%) |
| Mining, Quarrying, & Extraction | 0 (0.0%) | 0 (0.0%) |
| Construction | 0 (0.0%) | 0 (0.0%) |
| Manufacturing | 0 (0.0%) | 0 (0.0%) |
| Wholesale Trade | 3 (100.0%) | 0 (0.0%) |
| Retail Trade | 16 (53.3%) | 14 (46.7%) |
| Transportation & Warehousing | 2 (40.0%) | 3 (60.0%) |
| Utilities | 6 (75.0%) | 2 (25.0%) |
| Information | 3 (100.0%) | 0 (0.0%) |
| Finance & Insurance | 0 (0.0%) | 0 (0.0%) |
| Real Estate, Rental & Leasing | 0 (0.0%) | 0 (0.0%) |
| Professional & Scientific | 0 (0.0%) | 3 (100.0%) |
| Enterprise Management | 0 (0.0%) | 0 (0.0%) |
| Administrative & Support | 2 (33.3%) | 4 (66.7%) |
| Educational Services | 6 (42.9%) | 8 (57.1%) |
| Health Care & Social Assistance | 11 (55.0%) | 9 (45.0%) |
| Arts, Entertainment & Recreation | 2 (100.0%) | 0 (0.0%) |
| Accommodation & Food Services | 0 (0.0%) | 3 (100.0%) |
| Public Administration | 26 (76.5%) | 8 (23.5%) |
| Total | 80 (58.4%) | 57 (41.6%) |
Education in Kipnuk
School Enrollment in Kipnuk
The most common levels of schooling among the 160 students in Kipnuk are middle school (56 | 35.0%), high school (44 | 27.5%), and elementary school (32 | 20.0%).
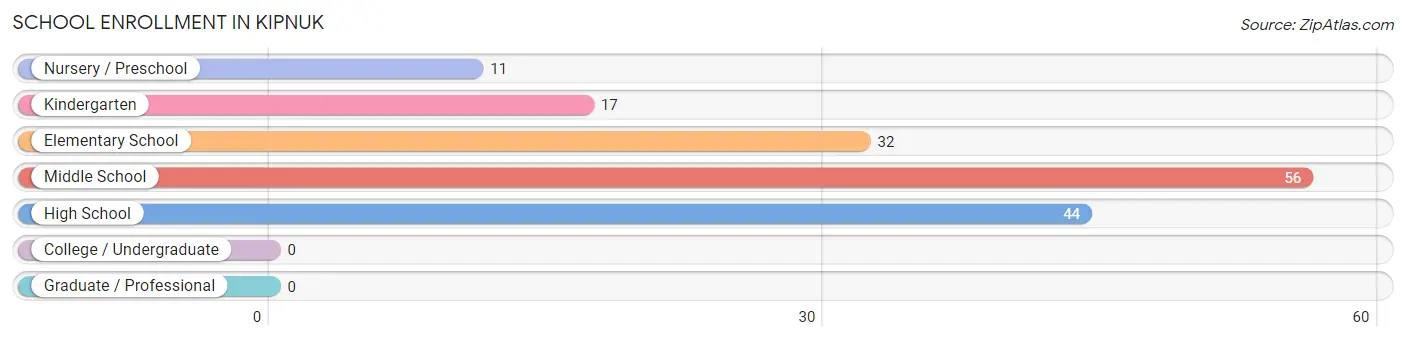
| School Level | # Students | % Students |
| Nursery / Preschool | 11 | 6.9% |
| Kindergarten | 17 | 10.6% |
| Elementary School | 32 | 20.0% |
| Middle School | 56 | 35.0% |
| High School | 44 | 27.5% |
| College / Undergraduate | 0 | 0.0% |
| Graduate / Professional | 0 | 0.0% |
| Total | 160 | 100.0% |
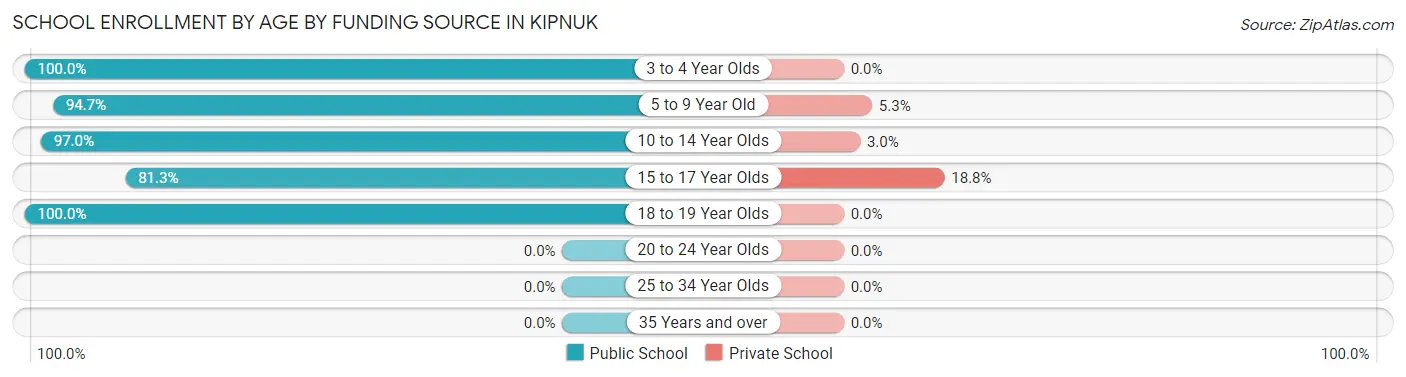
School Enrollment by Age by Funding Source in Kipnuk
Out of a total of 160 students who are enrolled in schools in Kipnuk, 11 (6.9%) attend a private institution, while the remaining 149 (93.1%) are enrolled in public schools. The age group of 15 to 17 year olds has the highest likelihood of being enrolled in private schools, with 6 (18.8% in the age bracket) enrolled. Conversely, the age group of 3 to 4 year olds has the lowest likelihood of being enrolled in a private school, with 3 (100.0% in the age bracket) attending a public institution.
| Age Bracket | Public School | Private School |
| 3 to 4 Year Olds | 3 (100.0%) | 0 (0.0%) |
| 5 to 9 Year Old | 54 (94.7%) | 3 (5.3%) |
| 10 to 14 Year Olds | 64 (97.0%) | 2 (3.0%) |
| 15 to 17 Year Olds | 26 (81.2%) | 6 (18.8%) |
| 18 to 19 Year Olds | 2 (100.0%) | 0 (0.0%) |
| 20 to 24 Year Olds | 0 (0.0%) | 0 (0.0%) |
| 25 to 34 Year Olds | 0 (0.0%) | 0 (0.0%) |
| 35 Years and over | 0 (0.0%) | 0 (0.0%) |
| Total | 149 (93.1%) | 11 (6.9%) |
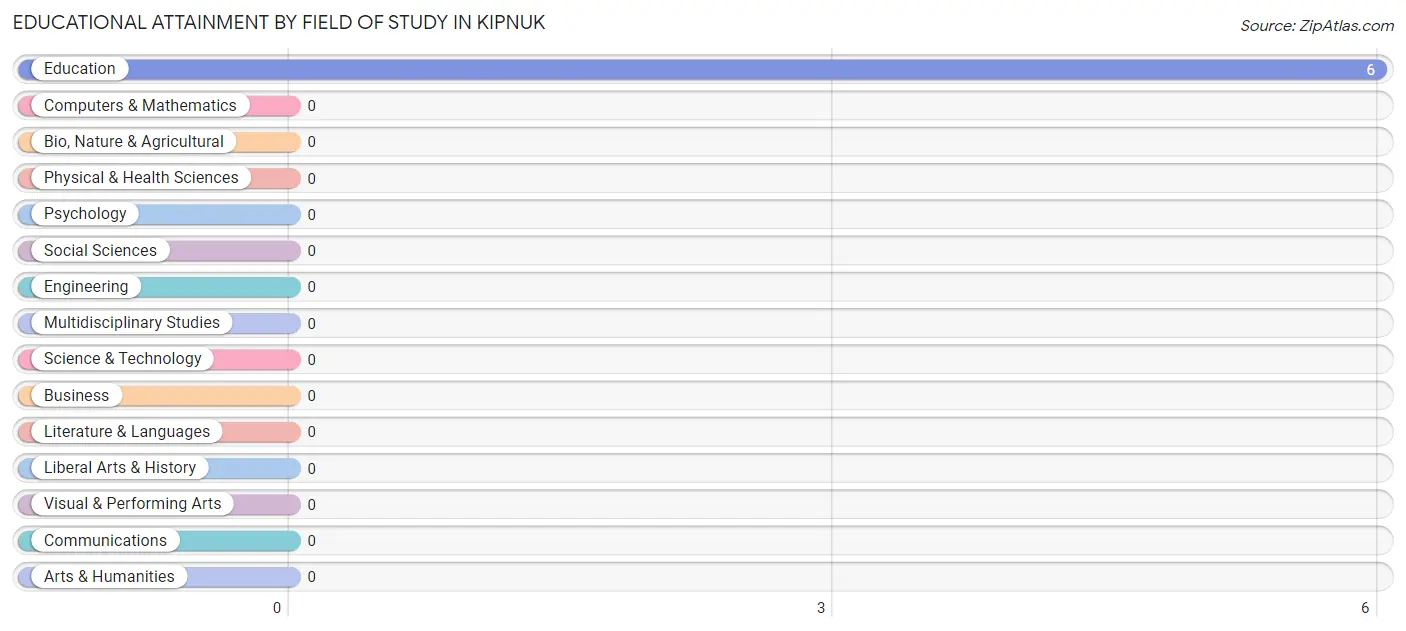
Educational Attainment by Field of Study in Kipnuk
, and education (6 | 100.0%) are the most common fields of study among 6 individuals in Kipnuk who have obtained a bachelor's degree or higher.
| Field of Study | # Graduates | % Graduates |
| Computers & Mathematics | 0 | 0.0% |
| Bio, Nature & Agricultural | 0 | 0.0% |
| Physical & Health Sciences | 0 | 0.0% |
| Psychology | 0 | 0.0% |
| Social Sciences | 0 | 0.0% |
| Engineering | 0 | 0.0% |
| Multidisciplinary Studies | 0 | 0.0% |
| Science & Technology | 0 | 0.0% |
| Business | 0 | 0.0% |
| Education | 6 | 100.0% |
| Literature & Languages | 0 | 0.0% |
| Liberal Arts & History | 0 | 0.0% |
| Visual & Performing Arts | 0 | 0.0% |
| Communications | 0 | 0.0% |
| Arts & Humanities | 0 | 0.0% |
| Total | 6 | 100.0% |
Transportation & Commute in Kipnuk
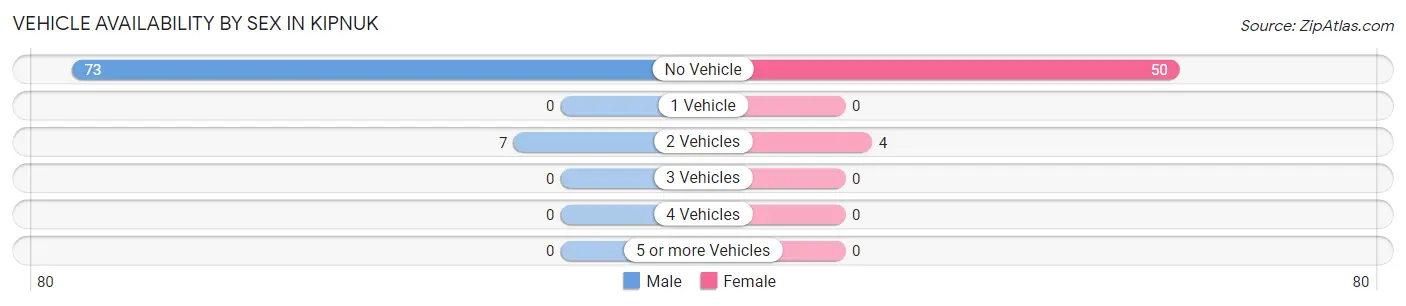
Vehicle Availability by Sex in Kipnuk
The most prevalent vehicle ownership categories in Kipnuk are males with no vehicle (73, accounting for 91.2%) and females with no vehicle (50, making up 135.2%).
| Vehicles Available | Male | Female |
| No Vehicle | 73 (91.2%) | 50 (92.6%) |
| 1 Vehicle | 0 (0.0%) | 0 (0.0%) |
| 2 Vehicles | 7 (8.7%) | 4 (7.4%) |
| 3 Vehicles | 0 (0.0%) | 0 (0.0%) |
| 4 Vehicles | 0 (0.0%) | 0 (0.0%) |
| 5 or more Vehicles | 0 (0.0%) | 0 (0.0%) |
| Total | 80 (100.0%) | 54 (100.0%) |
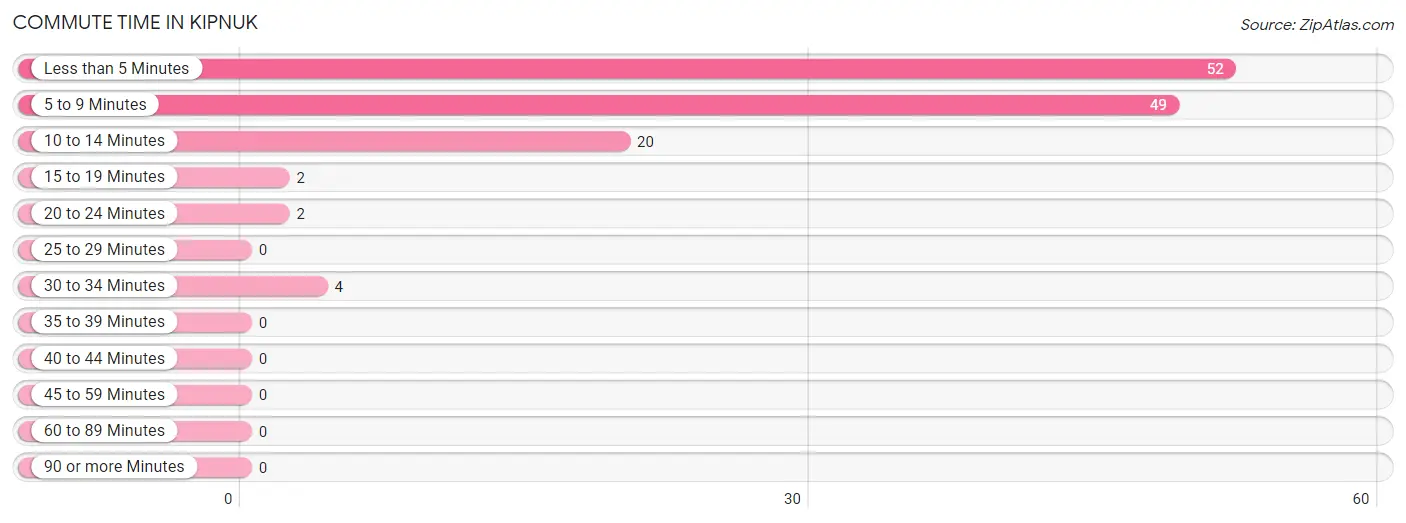
Commute Time in Kipnuk
The most frequently occuring commute durations in Kipnuk are less than 5 minutes (52 commuters, 40.3%), 5 to 9 minutes (49 commuters, 38.0%), and 10 to 14 minutes (20 commuters, 15.5%).
| Commute Time | # Commuters | % Commuters |
| Less than 5 Minutes | 52 | 40.3% |
| 5 to 9 Minutes | 49 | 38.0% |
| 10 to 14 Minutes | 20 | 15.5% |
| 15 to 19 Minutes | 2 | 1.5% |
| 20 to 24 Minutes | 2 | 1.5% |
| 25 to 29 Minutes | 0 | 0.0% |
| 30 to 34 Minutes | 4 | 3.1% |
| 35 to 39 Minutes | 0 | 0.0% |
| 40 to 44 Minutes | 0 | 0.0% |
| 45 to 59 Minutes | 0 | 0.0% |
| 60 to 89 Minutes | 0 | 0.0% |
| 90 or more Minutes | 0 | 0.0% |
Commute Time by Sex in Kipnuk
The most common commute times in Kipnuk are less than 5 minutes (37 commuters, 47.4%) for males and 5 to 9 minutes (23 commuters, 45.1%) for females.
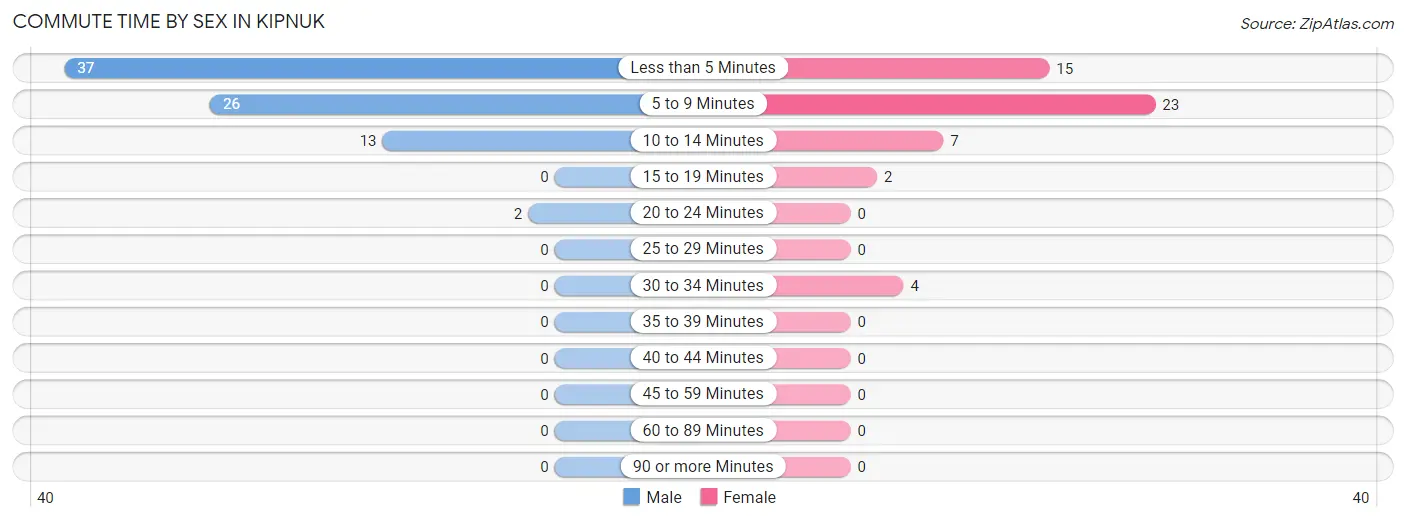
| Commute Time | Male | Female |
| Less than 5 Minutes | 37 (47.4%) | 15 (29.4%) |
| 5 to 9 Minutes | 26 (33.3%) | 23 (45.1%) |
| 10 to 14 Minutes | 13 (16.7%) | 7 (13.7%) |
| 15 to 19 Minutes | 0 (0.0%) | 2 (3.9%) |
| 20 to 24 Minutes | 2 (2.6%) | 0 (0.0%) |
| 25 to 29 Minutes | 0 (0.0%) | 0 (0.0%) |
| 30 to 34 Minutes | 0 (0.0%) | 4 (7.8%) |
| 35 to 39 Minutes | 0 (0.0%) | 0 (0.0%) |
| 40 to 44 Minutes | 0 (0.0%) | 0 (0.0%) |
| 45 to 59 Minutes | 0 (0.0%) | 0 (0.0%) |
| 60 to 89 Minutes | 0 (0.0%) | 0 (0.0%) |
| 90 or more Minutes | 0 (0.0%) | 0 (0.0%) |
Time of Departure to Work by Sex in Kipnuk
The most frequent times of departure to work in Kipnuk are 8:30 AM to 8:59 AM (24, 30.8%) for males and 8:00 AM to 8:29 AM (12, 23.5%) for females.
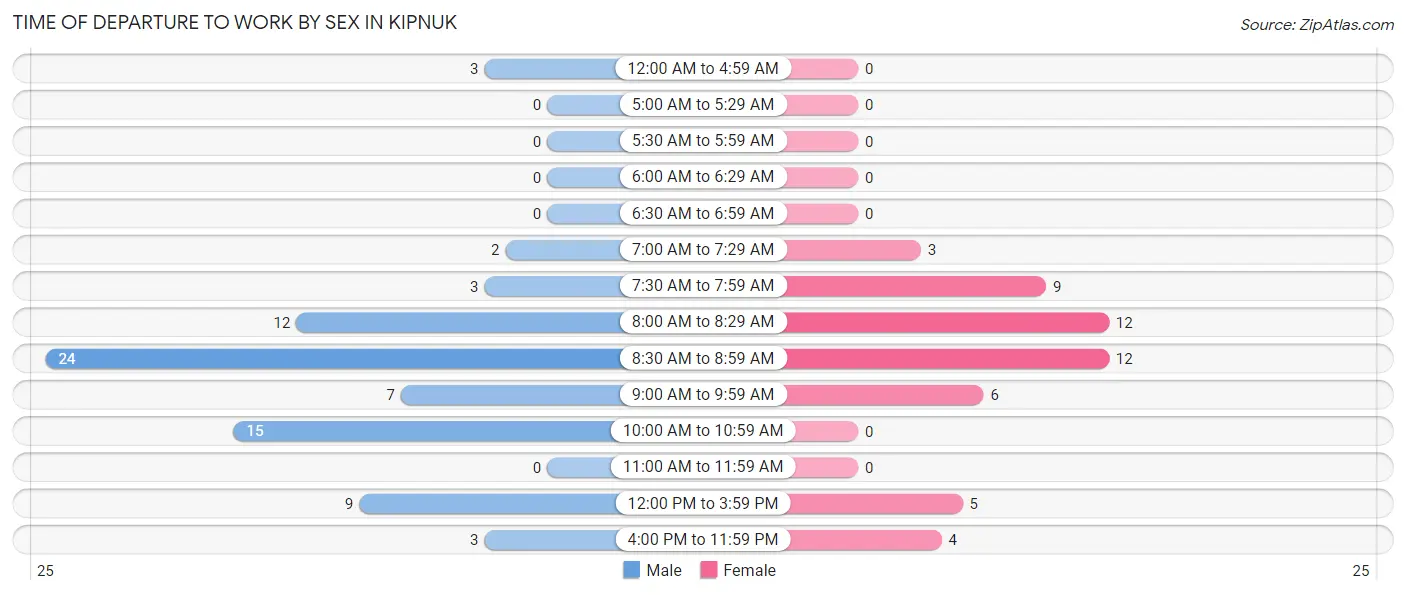
| Time of Departure | Male | Female |
| 12:00 AM to 4:59 AM | 3 (3.8%) | 0 (0.0%) |
| 5:00 AM to 5:29 AM | 0 (0.0%) | 0 (0.0%) |
| 5:30 AM to 5:59 AM | 0 (0.0%) | 0 (0.0%) |
| 6:00 AM to 6:29 AM | 0 (0.0%) | 0 (0.0%) |
| 6:30 AM to 6:59 AM | 0 (0.0%) | 0 (0.0%) |
| 7:00 AM to 7:29 AM | 2 (2.6%) | 3 (5.9%) |
| 7:30 AM to 7:59 AM | 3 (3.8%) | 9 (17.6%) |
| 8:00 AM to 8:29 AM | 12 (15.4%) | 12 (23.5%) |
| 8:30 AM to 8:59 AM | 24 (30.8%) | 12 (23.5%) |
| 9:00 AM to 9:59 AM | 7 (9.0%) | 6 (11.8%) |
| 10:00 AM to 10:59 AM | 15 (19.2%) | 0 (0.0%) |
| 11:00 AM to 11:59 AM | 0 (0.0%) | 0 (0.0%) |
| 12:00 PM to 3:59 PM | 9 (11.5%) | 5 (9.8%) |
| 4:00 PM to 11:59 PM | 3 (3.8%) | 4 (7.8%) |
| Total | 78 (100.0%) | 51 (100.0%) |
Housing Occupancy in Kipnuk
Occupancy by Ownership in Kipnuk
Of the total 138 dwellings in Kipnuk, owner-occupied units account for 98 (71.0%), while renter-occupied units make up 40 (29.0%).
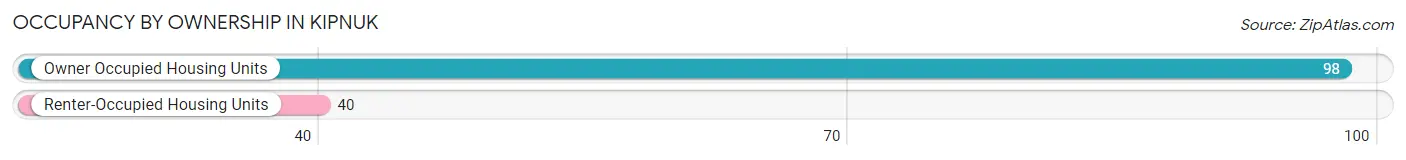
| Occupancy | # Housing Units | % Housing Units |
| Owner Occupied Housing Units | 98 | 71.0% |
| Renter-Occupied Housing Units | 40 | 29.0% |
| Total Occupied Housing Units | 138 | 100.0% |
Occupancy by Household Size in Kipnuk
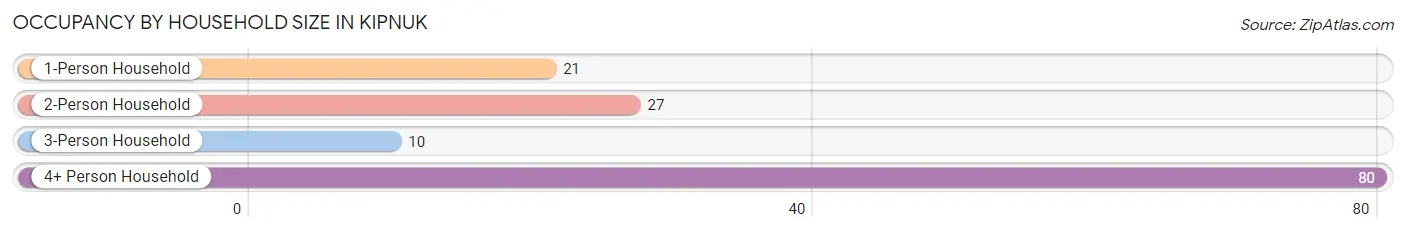
| Household Size | # Housing Units | % Housing Units |
| 1-Person Household | 21 | 15.2% |
| 2-Person Household | 27 | 19.6% |
| 3-Person Household | 10 | 7.2% |
| 4+ Person Household | 80 | 58.0% |
| Total Housing Units | 138 | 100.0% |
Occupancy by Ownership by Household Size in Kipnuk
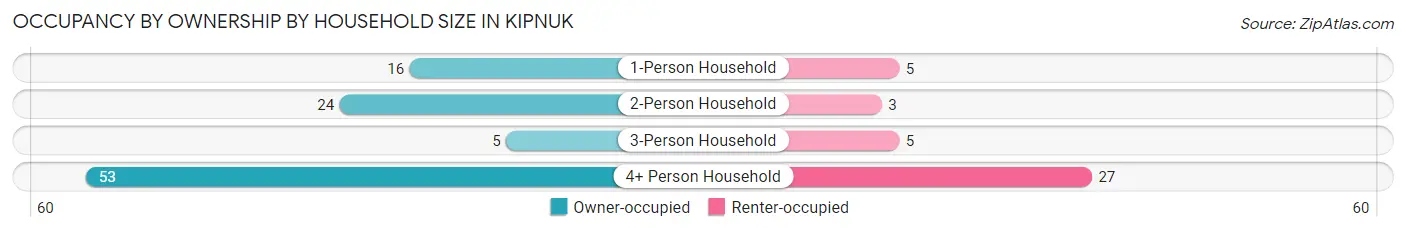
| Household Size | Owner-occupied | Renter-occupied |
| 1-Person Household | 16 (76.2%) | 5 (23.8%) |
| 2-Person Household | 24 (88.9%) | 3 (11.1%) |
| 3-Person Household | 5 (50.0%) | 5 (50.0%) |
| 4+ Person Household | 53 (66.2%) | 27 (33.8%) |
| Total Housing Units | 98 (71.0%) | 40 (29.0%) |
Occupancy by Educational Attainment in Kipnuk
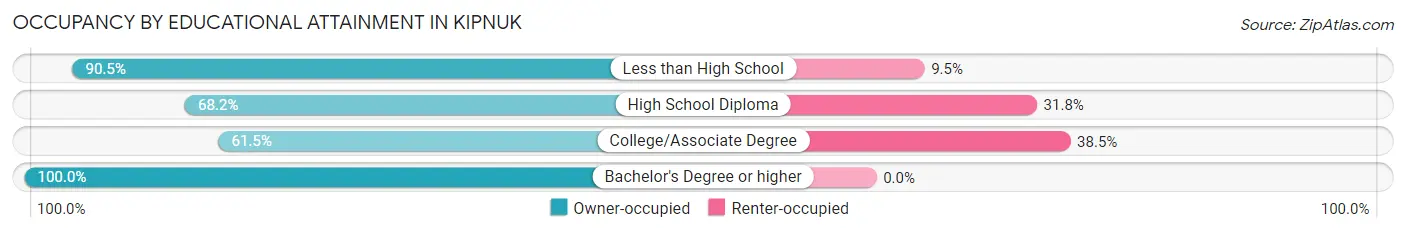
| Household Size | Owner-occupied | Renter-occupied |
| Less than High School | 19 (90.5%) | 2 (9.5%) |
| High School Diploma | 60 (68.2%) | 28 (31.8%) |
| College/Associate Degree | 16 (61.5%) | 10 (38.5%) |
| Bachelor's Degree or higher | 3 (100.0%) | 0 (0.0%) |
Occupancy by Age of Householder in Kipnuk
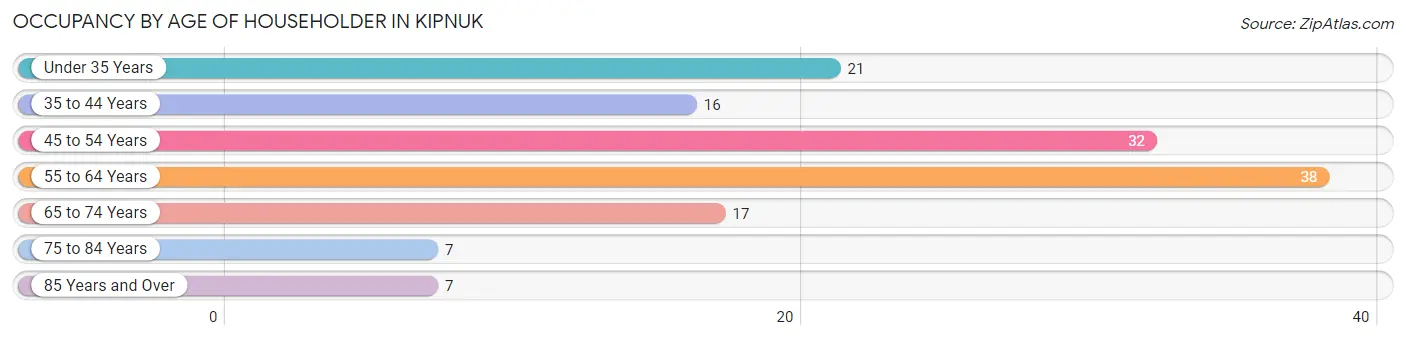
| Age Bracket | # Households | % Households |
| Under 35 Years | 21 | 15.2% |
| 35 to 44 Years | 16 | 11.6% |
| 45 to 54 Years | 32 | 23.2% |
| 55 to 64 Years | 38 | 27.5% |
| 65 to 74 Years | 17 | 12.3% |
| 75 to 84 Years | 7 | 5.1% |
| 85 Years and Over | 7 | 5.1% |
| Total | 138 | 100.0% |
Housing Finances in Kipnuk
Median Income by Occupancy in Kipnuk
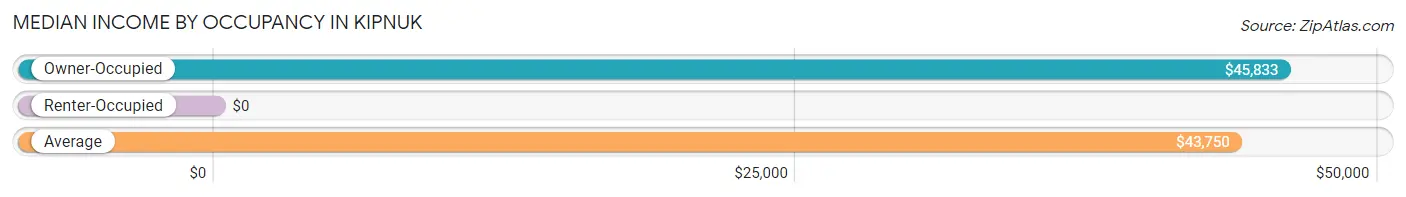
| Occupancy Type | # Households | Median Income |
| Owner-Occupied | 98 (71.0%) | $45,833 |
| Renter-Occupied | 40 (29.0%) | $0 |
| Average | 138 (100.0%) | $43,750 |
Occupancy by Householder Income Bracket in Kipnuk
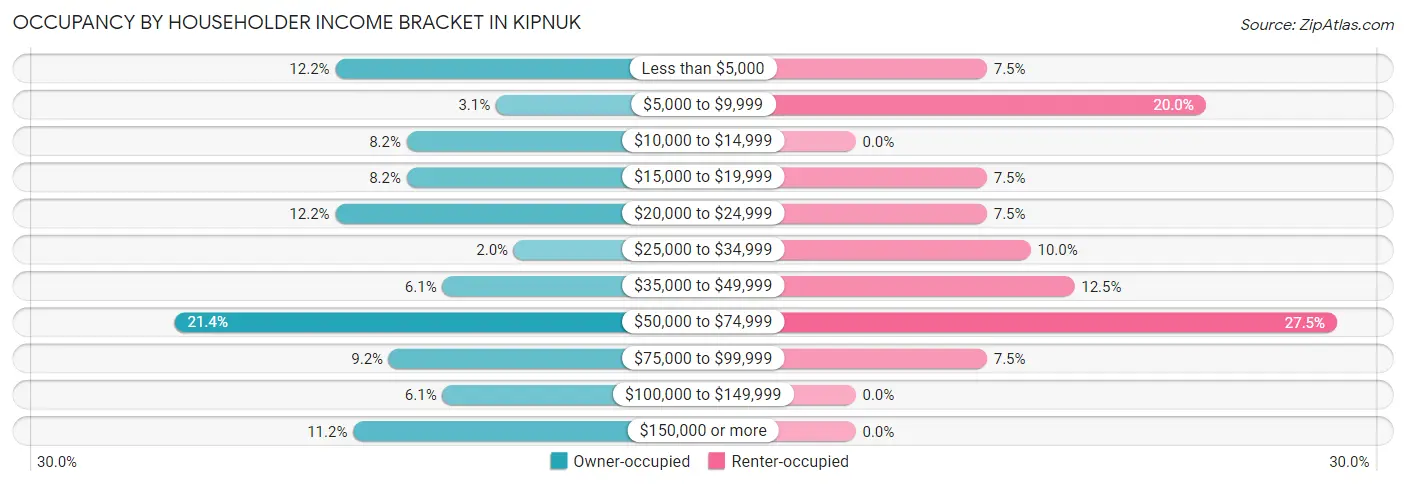
| Income Bracket | Owner-occupied | Renter-occupied |
| Less than $5,000 | 12 (12.2%) | 3 (7.5%) |
| $5,000 to $9,999 | 3 (3.1%) | 8 (20.0%) |
| $10,000 to $14,999 | 8 (8.2%) | 0 (0.0%) |
| $15,000 to $19,999 | 8 (8.2%) | 3 (7.5%) |
| $20,000 to $24,999 | 12 (12.2%) | 3 (7.5%) |
| $25,000 to $34,999 | 2 (2.0%) | 4 (10.0%) |
| $35,000 to $49,999 | 6 (6.1%) | 5 (12.5%) |
| $50,000 to $74,999 | 21 (21.4%) | 11 (27.5%) |
| $75,000 to $99,999 | 9 (9.2%) | 3 (7.5%) |
| $100,000 to $149,999 | 6 (6.1%) | 0 (0.0%) |
| $150,000 or more | 11 (11.2%) | 0 (0.0%) |
| Total | 98 (100.0%) | 40 (100.0%) |
Monthly Housing Cost Tiers in Kipnuk
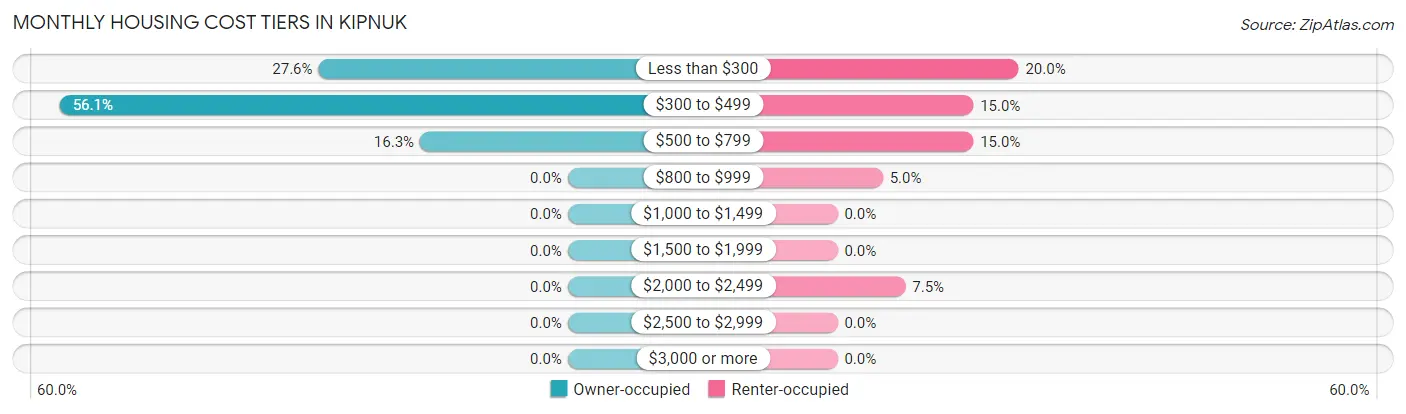
| Monthly Cost | Owner-occupied | Renter-occupied |
| Less than $300 | 27 (27.6%) | 8 (20.0%) |
| $300 to $499 | 55 (56.1%) | 6 (15.0%) |
| $500 to $799 | 16 (16.3%) | 6 (15.0%) |
| $800 to $999 | 0 (0.0%) | 2 (5.0%) |
| $1,000 to $1,499 | 0 (0.0%) | 0 (0.0%) |
| $1,500 to $1,999 | 0 (0.0%) | 0 (0.0%) |
| $2,000 to $2,499 | 0 (0.0%) | 3 (7.5%) |
| $2,500 to $2,999 | 0 (0.0%) | 0 (0.0%) |
| $3,000 or more | 0 (0.0%) | 0 (0.0%) |
| Total | 98 (100.0%) | 40 (100.0%) |
Physical Housing Characteristics in Kipnuk
Housing Structures in Kipnuk
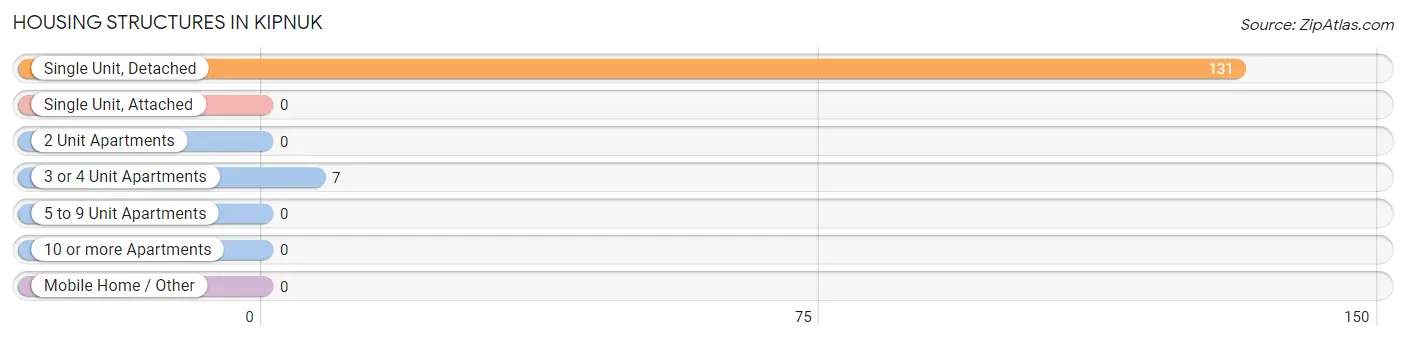
| Structure Type | # Housing Units | % Housing Units |
| Single Unit, Detached | 131 | 94.9% |
| Single Unit, Attached | 0 | 0.0% |
| 2 Unit Apartments | 0 | 0.0% |
| 3 or 4 Unit Apartments | 7 | 5.1% |
| 5 to 9 Unit Apartments | 0 | 0.0% |
| 10 or more Apartments | 0 | 0.0% |
| Mobile Home / Other | 0 | 0.0% |
| Total | 138 | 100.0% |
Housing Structures by Occupancy in Kipnuk
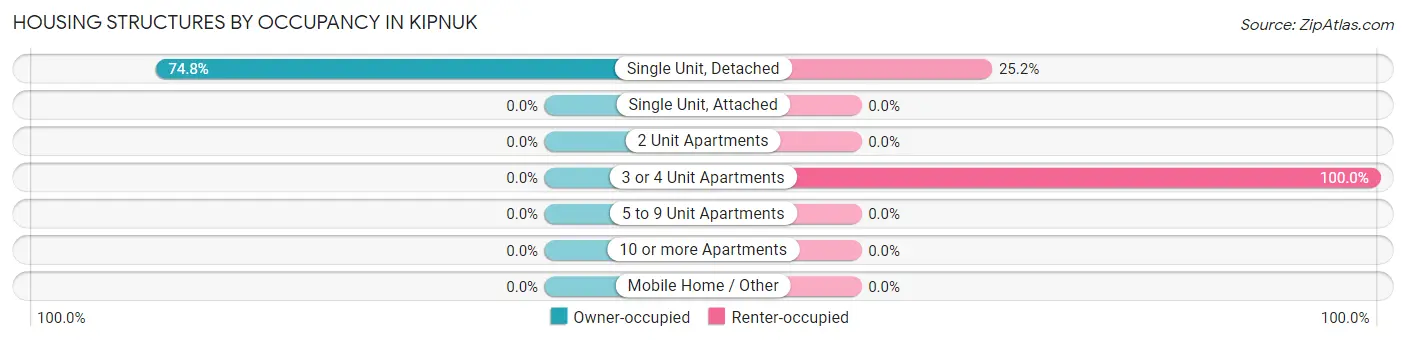
| Structure Type | Owner-occupied | Renter-occupied |
| Single Unit, Detached | 98 (74.8%) | 33 (25.2%) |
| Single Unit, Attached | 0 (0.0%) | 0 (0.0%) |
| 2 Unit Apartments | 0 (0.0%) | 0 (0.0%) |
| 3 or 4 Unit Apartments | 0 (0.0%) | 7 (100.0%) |
| 5 to 9 Unit Apartments | 0 (0.0%) | 0 (0.0%) |
| 10 or more Apartments | 0 (0.0%) | 0 (0.0%) |
| Mobile Home / Other | 0 (0.0%) | 0 (0.0%) |
| Total | 98 (71.0%) | 40 (29.0%) |
Housing Structures by Number of Rooms in Kipnuk
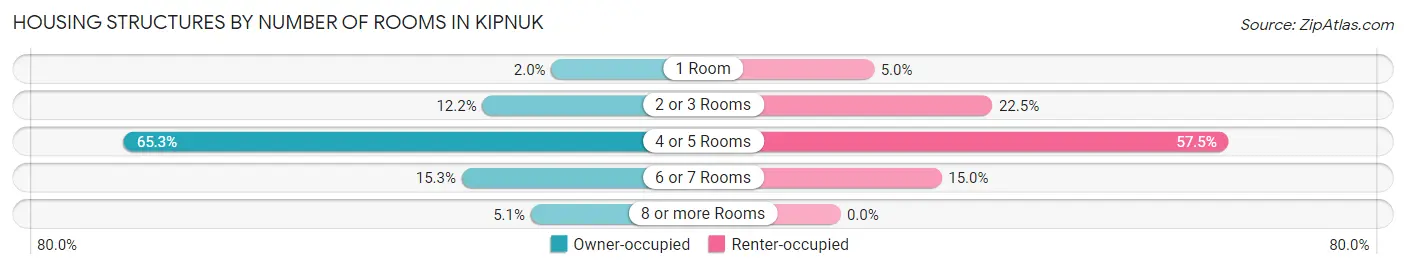
| Number of Rooms | Owner-occupied | Renter-occupied |
| 1 Room | 2 (2.0%) | 2 (5.0%) |
| 2 or 3 Rooms | 12 (12.2%) | 9 (22.5%) |
| 4 or 5 Rooms | 64 (65.3%) | 23 (57.5%) |
| 6 or 7 Rooms | 15 (15.3%) | 6 (15.0%) |
| 8 or more Rooms | 5 (5.1%) | 0 (0.0%) |
| Total | 98 (100.0%) | 40 (100.0%) |
Housing Structure by Heating Type in Kipnuk
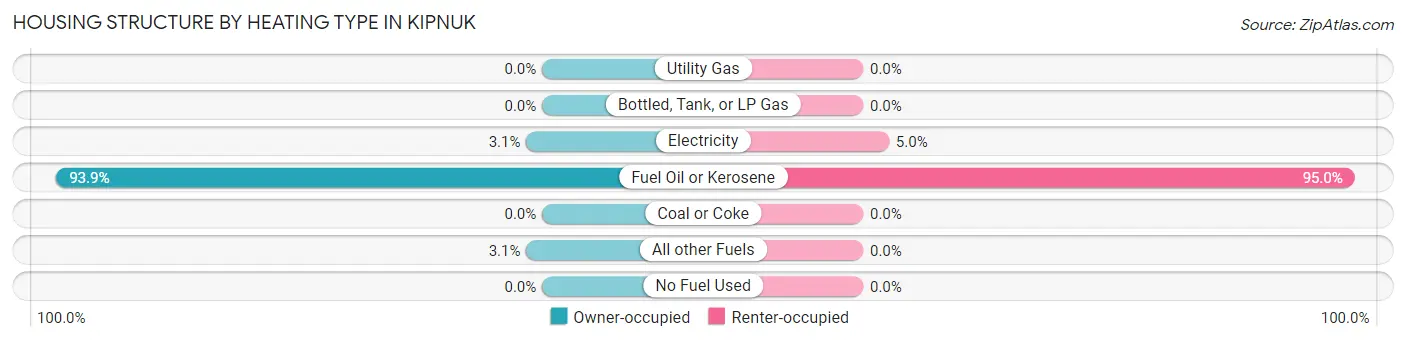
| Heating Type | Owner-occupied | Renter-occupied |
| Utility Gas | 0 (0.0%) | 0 (0.0%) |
| Bottled, Tank, or LP Gas | 0 (0.0%) | 0 (0.0%) |
| Electricity | 3 (3.1%) | 2 (5.0%) |
| Fuel Oil or Kerosene | 92 (93.9%) | 38 (95.0%) |
| Coal or Coke | 0 (0.0%) | 0 (0.0%) |
| All other Fuels | 3 (3.1%) | 0 (0.0%) |
| No Fuel Used | 0 (0.0%) | 0 (0.0%) |
| Total | 98 (100.0%) | 40 (100.0%) |
Household Vehicle Usage in Kipnuk
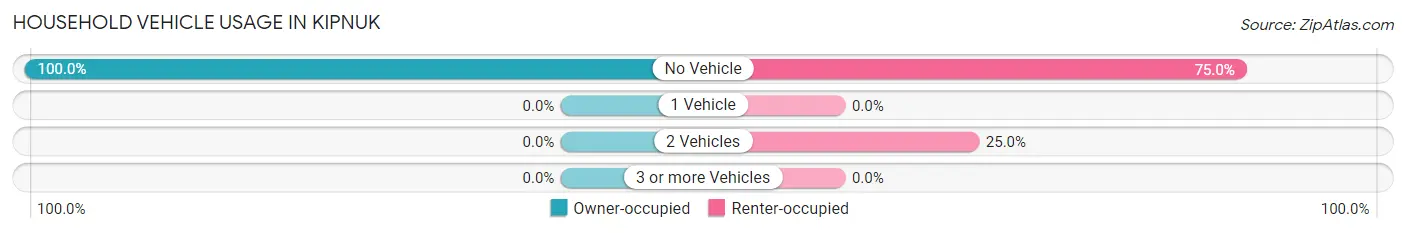
| Vehicles per Household | Owner-occupied | Renter-occupied |
| No Vehicle | 98 (100.0%) | 30 (75.0%) |
| 1 Vehicle | 0 (0.0%) | 0 (0.0%) |
| 2 Vehicles | 0 (0.0%) | 10 (25.0%) |
| 3 or more Vehicles | 0 (0.0%) | 0 (0.0%) |
| Total | 98 (100.0%) | 40 (100.0%) |
Real Estate & Mortgages in Kipnuk
Real Estate and Mortgage Overview in Kipnuk
| Characteristic | Without Mortgage | With Mortgage |
| Housing Units | 74 | 24 |
| Median Property Value | $30,600 | $175,000 |
| Median Household Income | - | - |
| Monthly Housing Costs | $342 | $0 |
| Real Estate Taxes | $199 | $24 |
Property Value by Mortgage Status in Kipnuk
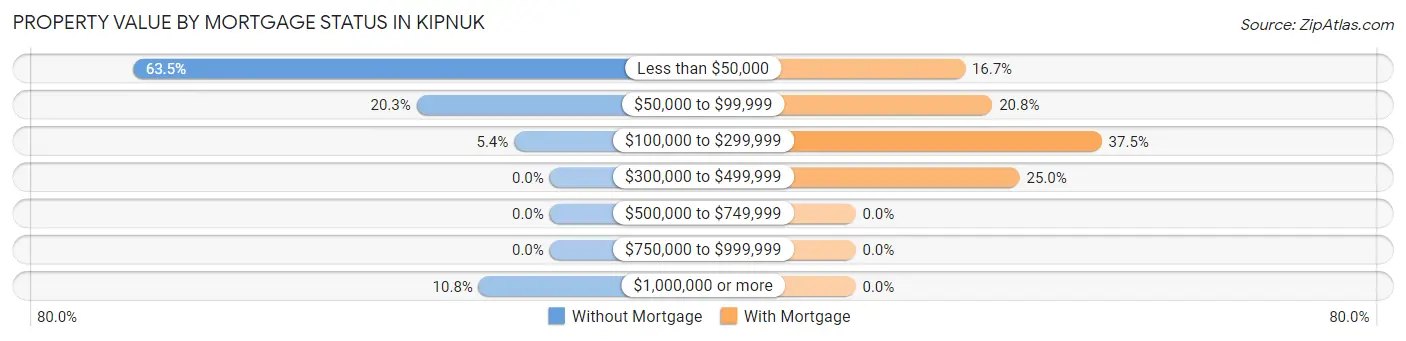
| Property Value | Without Mortgage | With Mortgage |
| Less than $50,000 | 47 (63.5%) | 4 (16.7%) |
| $50,000 to $99,999 | 15 (20.3%) | 5 (20.8%) |
| $100,000 to $299,999 | 4 (5.4%) | 9 (37.5%) |
| $300,000 to $499,999 | 0 (0.0%) | 6 (25.0%) |
| $500,000 to $749,999 | 0 (0.0%) | 0 (0.0%) |
| $750,000 to $999,999 | 0 (0.0%) | 0 (0.0%) |
| $1,000,000 or more | 8 (10.8%) | 0 (0.0%) |
| Total | 74 (100.0%) | 24 (100.0%) |
Household Income by Mortgage Status in Kipnuk
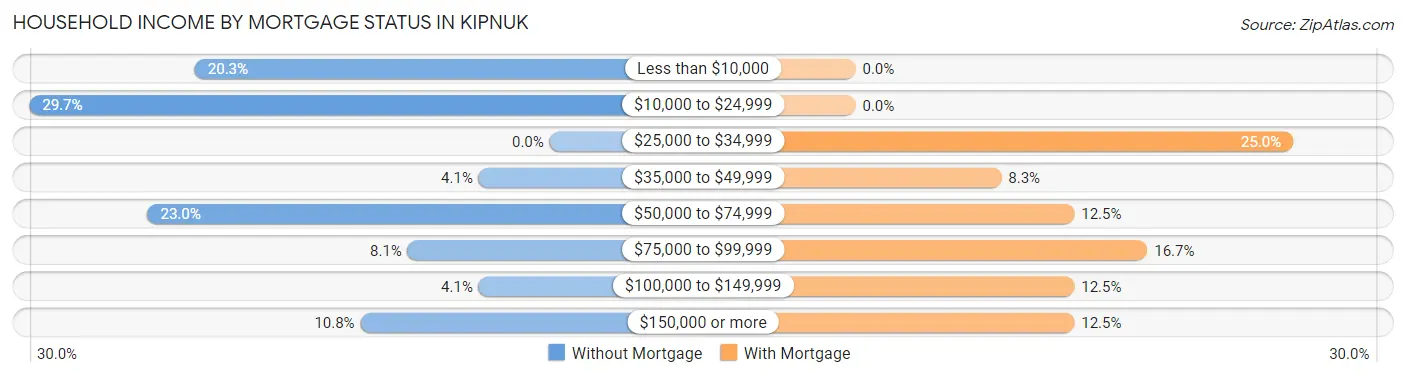
| Household Income | Without Mortgage | With Mortgage |
| Less than $10,000 | 15 (20.3%) | 0 (0.0%) |
| $10,000 to $24,999 | 22 (29.7%) | 0 (0.0%) |
| $25,000 to $34,999 | 0 (0.0%) | 6 (25.0%) |
| $35,000 to $49,999 | 3 (4.1%) | 2 (8.3%) |
| $50,000 to $74,999 | 17 (23.0%) | 3 (12.5%) |
| $75,000 to $99,999 | 6 (8.1%) | 4 (16.7%) |
| $100,000 to $149,999 | 3 (4.1%) | 3 (12.5%) |
| $150,000 or more | 8 (10.8%) | 3 (12.5%) |
| Total | 74 (100.0%) | 24 (100.0%) |
Property Value to Household Income Ratio in Kipnuk
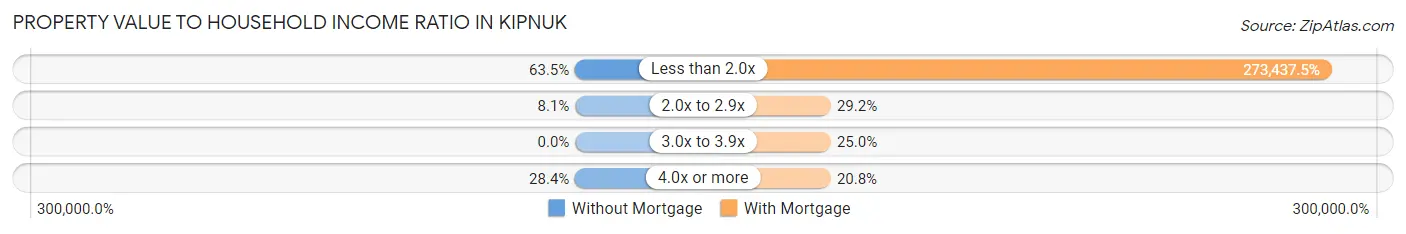
| Value-to-Income Ratio | Without Mortgage | With Mortgage |
| Less than 2.0x | 47 (63.5%) | 65,625 (273,437.5%) |
| 2.0x to 2.9x | 6 (8.1%) | 7 (29.2%) |
| 3.0x to 3.9x | 0 (0.0%) | 6 (25.0%) |
| 4.0x or more | 21 (28.4%) | 5 (20.8%) |
| Total | 74 (100.0%) | 24 (100.0%) |
Real Estate Taxes by Mortgage Status in Kipnuk
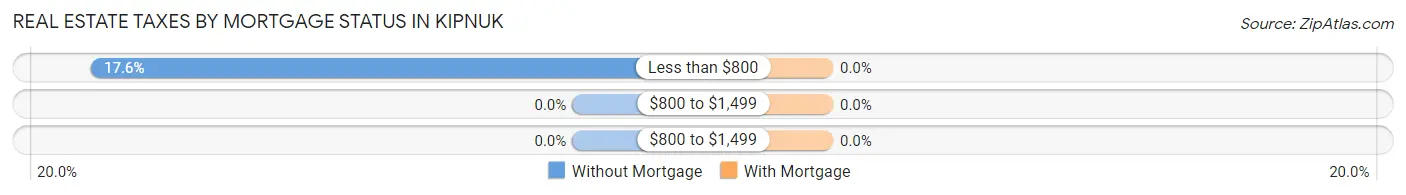
| Property Taxes | Without Mortgage | With Mortgage |
| Less than $800 | 13 (17.6%) | 0 (0.0%) |
| $800 to $1,499 | 0 (0.0%) | 0 (0.0%) |
| $800 to $1,499 | 0 (0.0%) | 0 (0.0%) |
| Total | 74 (100.0%) | 24 (100.0%) |
Health & Disability in Kipnuk
Health Insurance Coverage by Age in Kipnuk
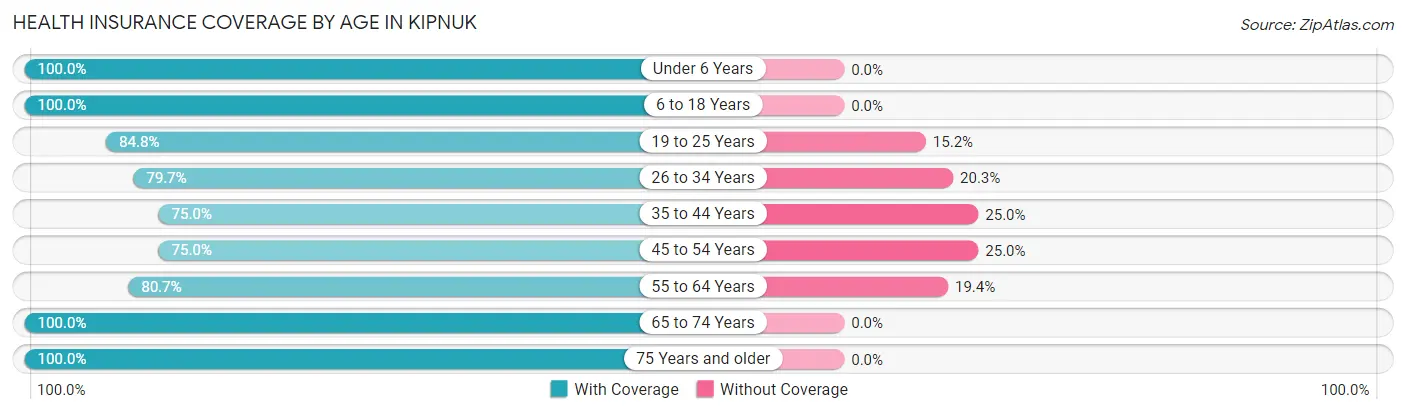
| Age Bracket | With Coverage | Without Coverage |
| Under 6 Years | 92 (100.0%) | 0 (0.0%) |
| 6 to 18 Years | 149 (100.0%) | 0 (0.0%) |
| 19 to 25 Years | 39 (84.8%) | 7 (15.2%) |
| 26 to 34 Years | 55 (79.7%) | 14 (20.3%) |
| 35 to 44 Years | 39 (75.0%) | 13 (25.0%) |
| 45 to 54 Years | 45 (75.0%) | 15 (25.0%) |
| 55 to 64 Years | 50 (80.6%) | 12 (19.4%) |
| 65 to 74 Years | 28 (100.0%) | 0 (0.0%) |
| 75 Years and older | 14 (100.0%) | 0 (0.0%) |
| Total | 511 (89.3%) | 61 (10.7%) |
Health Insurance Coverage by Citizenship Status in Kipnuk
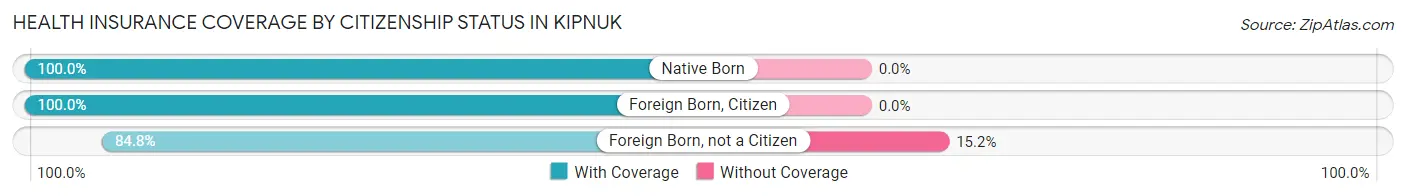
| Citizenship Status | With Coverage | Without Coverage |
| Native Born | 92 (100.0%) | 0 (0.0%) |
| Foreign Born, Citizen | 149 (100.0%) | 0 (0.0%) |
| Foreign Born, not a Citizen | 39 (84.8%) | 7 (15.2%) |
Health Insurance Coverage by Household Income in Kipnuk
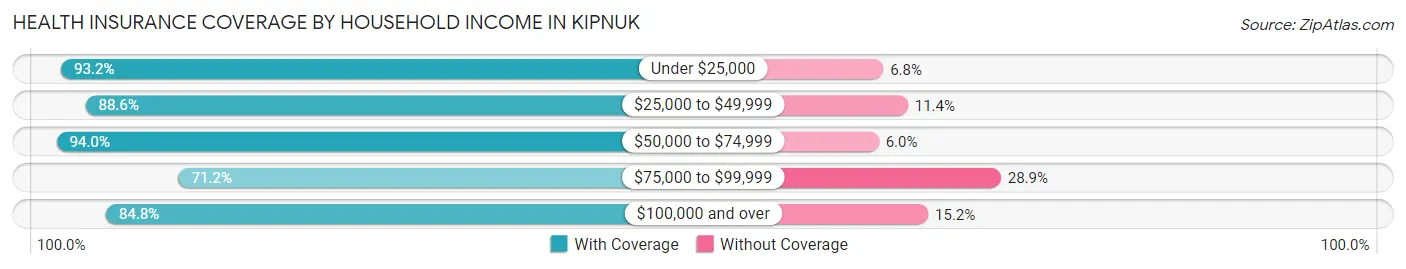
| Household Income | With Coverage | Without Coverage |
| Under $25,000 | 150 (93.2%) | 11 (6.8%) |
| $25,000 to $49,999 | 62 (88.6%) | 8 (11.4%) |
| $50,000 to $74,999 | 173 (94.0%) | 11 (6.0%) |
| $75,000 to $99,999 | 37 (71.2%) | 15 (28.8%) |
| $100,000 and over | 89 (84.8%) | 16 (15.2%) |
Public vs Private Health Insurance Coverage by Age in Kipnuk
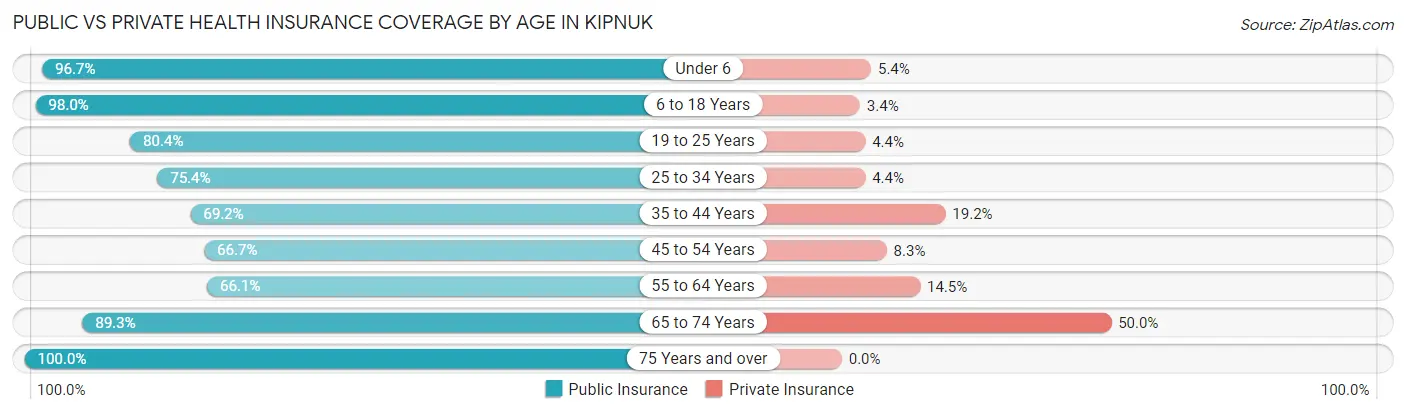
| Age Bracket | Public Insurance | Private Insurance |
| Under 6 | 89 (96.7%) | 5 (5.4%) |
| 6 to 18 Years | 146 (98.0%) | 5 (3.4%) |
| 19 to 25 Years | 37 (80.4%) | 2 (4.3%) |
| 25 to 34 Years | 52 (75.4%) | 3 (4.3%) |
| 35 to 44 Years | 36 (69.2%) | 10 (19.2%) |
| 45 to 54 Years | 40 (66.7%) | 5 (8.3%) |
| 55 to 64 Years | 41 (66.1%) | 9 (14.5%) |
| 65 to 74 Years | 25 (89.3%) | 14 (50.0%) |
| 75 Years and over | 14 (100.0%) | 0 (0.0%) |
| Total | 480 (83.9%) | 53 (9.3%) |
Disability Status by Sex by Age in Kipnuk
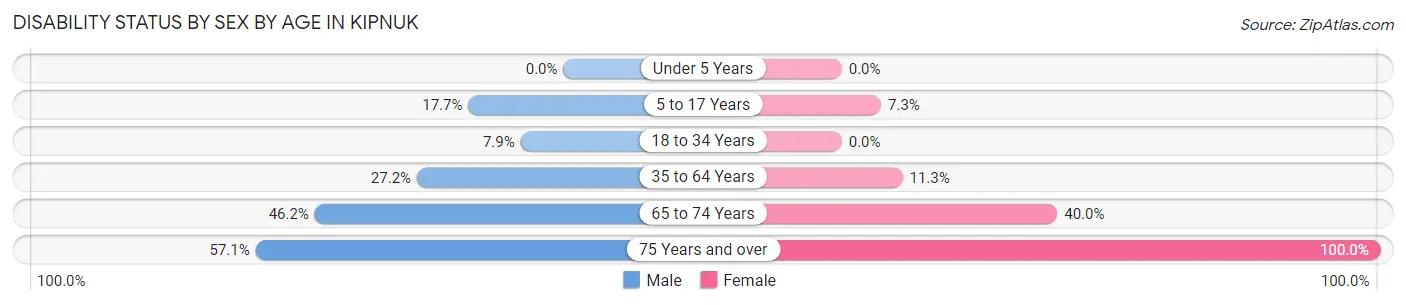
| Age Bracket | Male | Female |
| Under 5 Years | 0 (0.0%) | 0 (0.0%) |
| 5 to 17 Years | 12 (17.6%) | 7 (7.3%) |
| 18 to 34 Years | 5 (7.9%) | 0 (0.0%) |
| 35 to 64 Years | 28 (27.2%) | 8 (11.3%) |
| 65 to 74 Years | 6 (46.2%) | 6 (40.0%) |
| 75 Years and over | 4 (57.1%) | 7 (100.0%) |
Disability Class by Sex by Age in Kipnuk
Disability Class: Hearing Difficulty
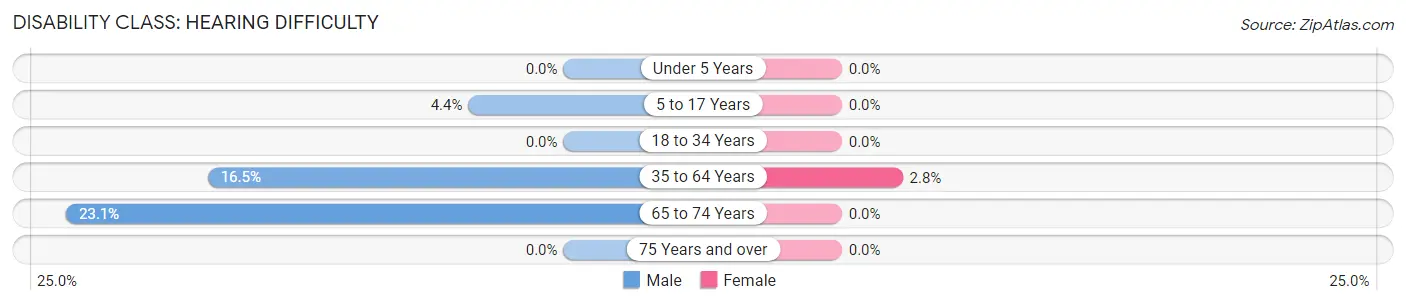
| Age Bracket | Male | Female |
| Under 5 Years | 0 (0.0%) | 0 (0.0%) |
| 5 to 17 Years | 3 (4.4%) | 0 (0.0%) |
| 18 to 34 Years | 0 (0.0%) | 0 (0.0%) |
| 35 to 64 Years | 17 (16.5%) | 2 (2.8%) |
| 65 to 74 Years | 3 (23.1%) | 0 (0.0%) |
| 75 Years and over | 0 (0.0%) | 0 (0.0%) |
Disability Class: Vision Difficulty
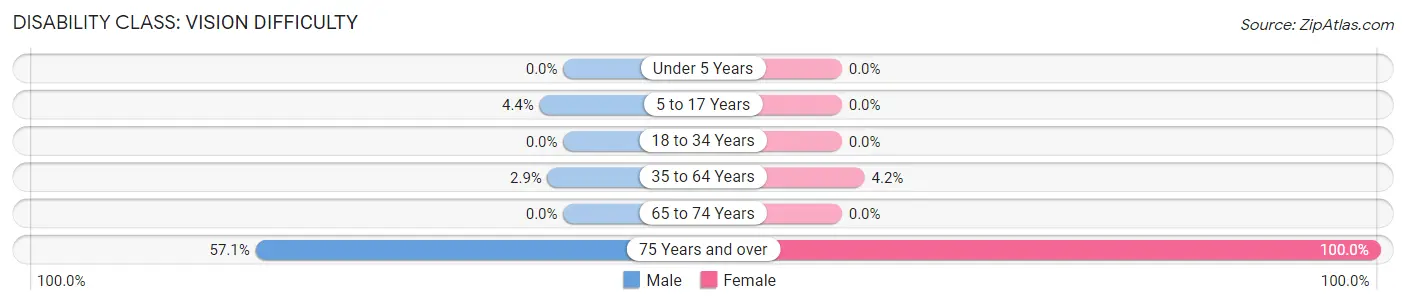
| Age Bracket | Male | Female |
| Under 5 Years | 0 (0.0%) | 0 (0.0%) |
| 5 to 17 Years | 3 (4.4%) | 0 (0.0%) |
| 18 to 34 Years | 0 (0.0%) | 0 (0.0%) |
| 35 to 64 Years | 3 (2.9%) | 3 (4.2%) |
| 65 to 74 Years | 0 (0.0%) | 0 (0.0%) |
| 75 Years and over | 4 (57.1%) | 7 (100.0%) |
Disability Class: Cognitive Difficulty
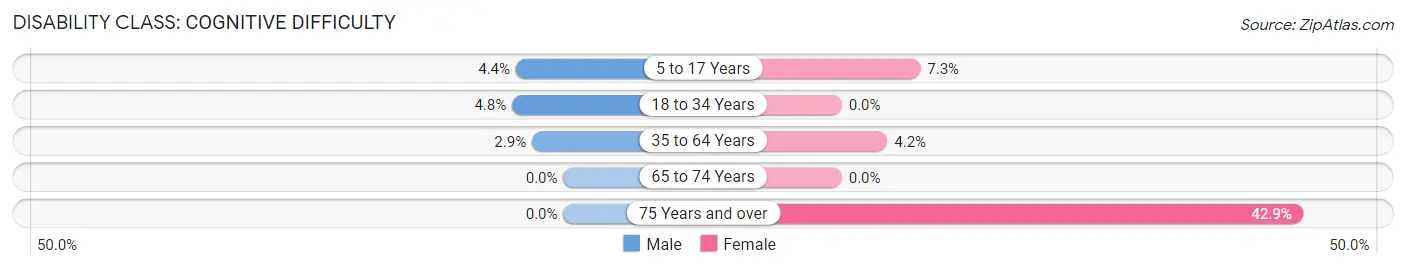
| Age Bracket | Male | Female |
| 5 to 17 Years | 3 (4.4%) | 7 (7.3%) |
| 18 to 34 Years | 3 (4.8%) | 0 (0.0%) |
| 35 to 64 Years | 3 (2.9%) | 3 (4.2%) |
| 65 to 74 Years | 0 (0.0%) | 0 (0.0%) |
| 75 Years and over | 0 (0.0%) | 3 (42.9%) |
Disability Class: Ambulatory Difficulty
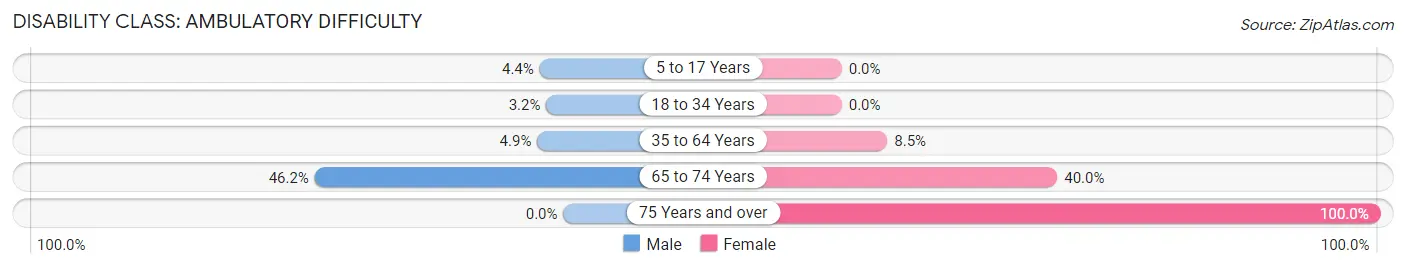
| Age Bracket | Male | Female |
| 5 to 17 Years | 3 (4.4%) | 0 (0.0%) |
| 18 to 34 Years | 2 (3.2%) | 0 (0.0%) |
| 35 to 64 Years | 5 (4.9%) | 6 (8.5%) |
| 65 to 74 Years | 6 (46.2%) | 6 (40.0%) |
| 75 Years and over | 0 (0.0%) | 7 (100.0%) |
Disability Class: Self-Care Difficulty
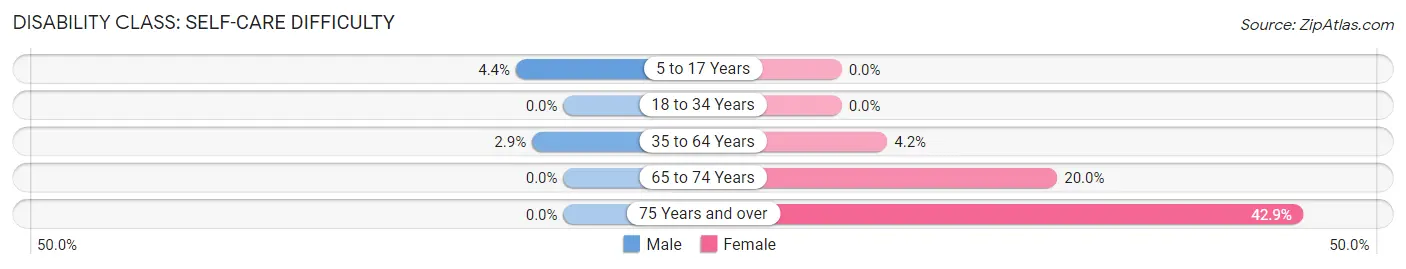
| Age Bracket | Male | Female |
| 5 to 17 Years | 3 (4.4%) | 0 (0.0%) |
| 18 to 34 Years | 0 (0.0%) | 0 (0.0%) |
| 35 to 64 Years | 3 (2.9%) | 3 (4.2%) |
| 65 to 74 Years | 0 (0.0%) | 3 (20.0%) |
| 75 Years and over | 0 (0.0%) | 3 (42.9%) |
Technology Access in Kipnuk
Computing Device Access in Kipnuk
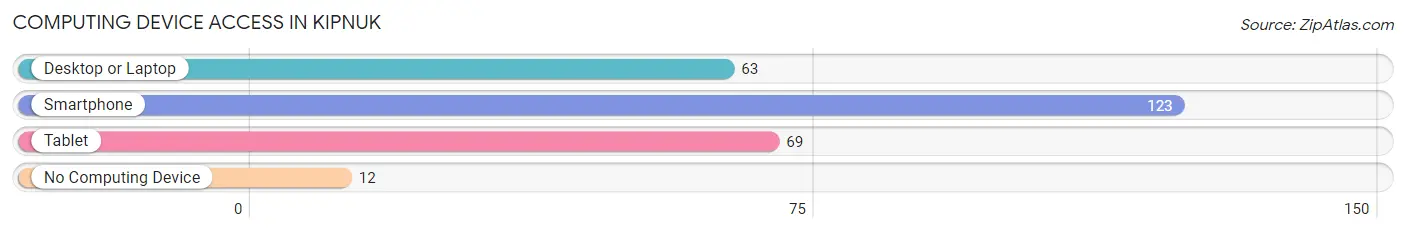
| Device Type | # Households | % Households |
| Desktop or Laptop | 63 | 45.7% |
| Smartphone | 123 | 89.1% |
| Tablet | 69 | 50.0% |
| No Computing Device | 12 | 8.7% |
| Total | 138 | 100.0% |
Internet Access in Kipnuk
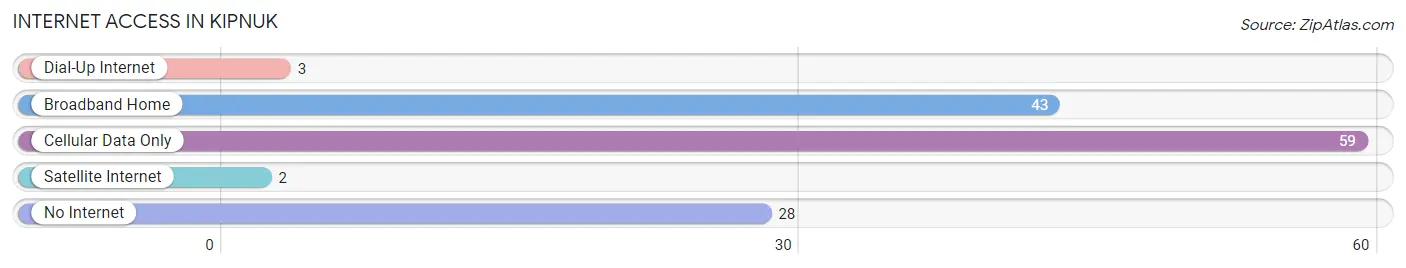
| Internet Type | # Households | % Households |
| Dial-Up Internet | 3 | 2.2% |
| Broadband Home | 43 | 31.2% |
| Cellular Data Only | 59 | 42.7% |
| Satellite Internet | 2 | 1.5% |
| No Internet | 28 | 20.3% |
| Total | 138 | 100.0% |
Kipnuk Summary
Kipnuk is a small city located in the Bethel Census Area of Alaska. It is situated on the south bank of the Kuskokwim River, approximately 40 miles east of Bethel. The city has a population of approximately 690 people, according to the 2010 census.
History
Kipnuk was originally inhabited by the Yup'ik people, who have lived in the area for thousands of years. The first recorded contact with Europeans was in 1838, when the Russian explorer Vasilii Zagoskin visited the area. The first permanent settlement was established in 1884, when a trading post was built by the Alaska Commercial Company. The settlement was named Kipnuk, after the Yup'ik word for "big river".
In the early 1900s, Kipnuk became a center for fur trading and commercial fishing. The city was incorporated in 1959, and in the following decades, it became a hub for subsistence hunting and fishing.
Geography
Kipnuk is located in the Bethel Census Area of Alaska, on the south bank of the Kuskokwim River. The city is situated at an elevation of approximately 20 feet above sea level. The climate is subarctic, with cold winters and mild summers. The average annual temperature is 33°F, and the average annual precipitation is 11 inches.
The city is surrounded by tundra and wetlands, and is home to a variety of wildlife, including moose, caribou, and migratory birds. The Kuskokwim River is a major source of fish, and is also used for transportation.
Economy
Kipnuk's economy is largely based on subsistence hunting and fishing. The city is also home to a number of small businesses, including a grocery store, a hardware store, and a gas station. The city is served by a small airport, and is connected to the rest of Alaska by the Kuskokwim River.
Demographics
According to the 2010 census, Kipnuk has a population of 690 people. The population is predominantly Alaska Native, with the majority of residents identifying as Yup'ik. The median household income is $25,000, and the median age is 28.
Kipnuk is served by the Kipnuk School District, which includes a K-12 school. The city is also home to a health clinic, a post office, and a library.
Conclusion
Kipnuk is a small city located in the Bethel Census Area of Alaska. It is situated on the south bank of the Kuskokwim River, and has a population of approximately 690 people. The city's economy is largely based on subsistence hunting and fishing, and the majority of residents identify as Alaska Native. Kipnuk is served by a K-12 school, a health clinic, a post office, and a library.
Common Questions
What is Per Capita Income in Kipnuk?
Per Capita income in Kipnuk is $11,924.
What is the Median Family Income in Kipnuk?
Median Family Income in Kipnuk is $60,278.
What is the Median Household income in Kipnuk?
Median Household Income in Kipnuk is $43,750.
What is Income or Wage Gap in Kipnuk?
Income or Wage Gap in Kipnuk is 42.0%.
Women in Kipnuk earn 58.0 cents for every dollar earned by a man.
What is Inequality or Gini Index in Kipnuk?
Inequality or Gini Index in Kipnuk is 0.48.
What is the Total Population of Kipnuk?
Total Population of Kipnuk is 572.
What is the Total Male Population of Kipnuk?
Total Male Population of Kipnuk is 284.
What is the Total Female Population of Kipnuk?
Total Female Population of Kipnuk is 288.
What is the Ratio of Males per 100 Females in Kipnuk?
There are 98.61 Males per 100 Females in Kipnuk.
What is the Ratio of Females per 100 Males in Kipnuk?
There are 101.41 Females per 100 Males in Kipnuk.
What is the Median Population Age in Kipnuk?
Median Population Age in Kipnuk is 25.9 Years.
What is the Average Family Size in Kipnuk
Average Family Size in Kipnuk is 4.7 People.
What is the Average Household Size in Kipnuk
Average Household Size in Kipnuk is 4.1 People.
How Large is the Labor Force in Kipnuk?
There are 186 People in the Labor Forcein in Kipnuk.
What is the Percentage of People in the Labor Force in Kipnuk?
51.1% of People are in the Labor Force in Kipnuk.
What is the Unemployment Rate in Kipnuk?
Unemployment Rate in Kipnuk is 26.3%.