Noorvik, AK Map & Demographics
Noorvik Map
Noorvik Overview
$16,793
PER CAPITA INCOME
$57,188
AVG FAMILY INCOME
$56,563
AVG HOUSEHOLD INCOME
3.4%
WAGE / INCOME GAP [ % ]
96.6¢/ $1
WAGE / INCOME GAP [ $ ]
$8,196
FAMILY INCOME DEFICIT
0.43
INEQUALITY / GINI INDEX
654
TOTAL POPULATION
361
MALE POPULATION
293
FEMALE POPULATION
123.21
MALES / 100 FEMALES
81.16
FEMALES / 100 MALES
26.7
MEDIAN AGE
5.7
AVG FAMILY SIZE
5.2
AVG HOUSEHOLD SIZE
190
LABOR FORCE [ PEOPLE ]
45.3%
PERCENT IN LABOR FORCE
33.7%
UNEMPLOYMENT RATE
Noorvik Zip Codes
Noorvik Area Codes
Income in Noorvik
Income Overview in Noorvik
Per Capita Income in Noorvik is $16,793, while median incomes of families and households are $57,188 and $56,563 respectively.
| Characteristic | Number | Measure |
| Per Capita Income | 654 | $16,793 |
| Median Family Income | 100 | $57,188 |
| Mean Family Income | 100 | $80,278 |
| Median Household Income | 120 | $56,563 |
| Mean Household Income | 120 | $76,548 |
| Income Deficit | 100 | $8,196 |
| Wage / Income Gap (%) | 654 | 3.35% |
| Wage / Income Gap ($) | 654 | 96.65¢ per $1 |
| Gini / Inequality Index | 654 | 0.43 |
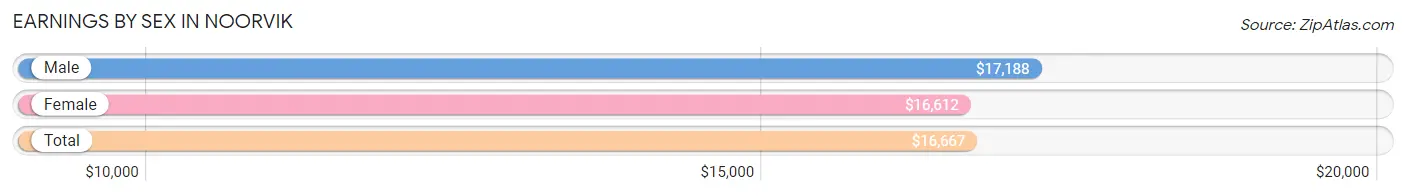
Earnings by Sex in Noorvik
Average Earnings in Noorvik are $16,667, $17,188 for men and $16,612 for women, a difference of 3.4%.
| Sex | Number | Average Earnings |
| Male | 137 (53.1%) | $17,188 |
| Female | 121 (46.9%) | $16,612 |
| Total | 258 (100.0%) | $16,667 |
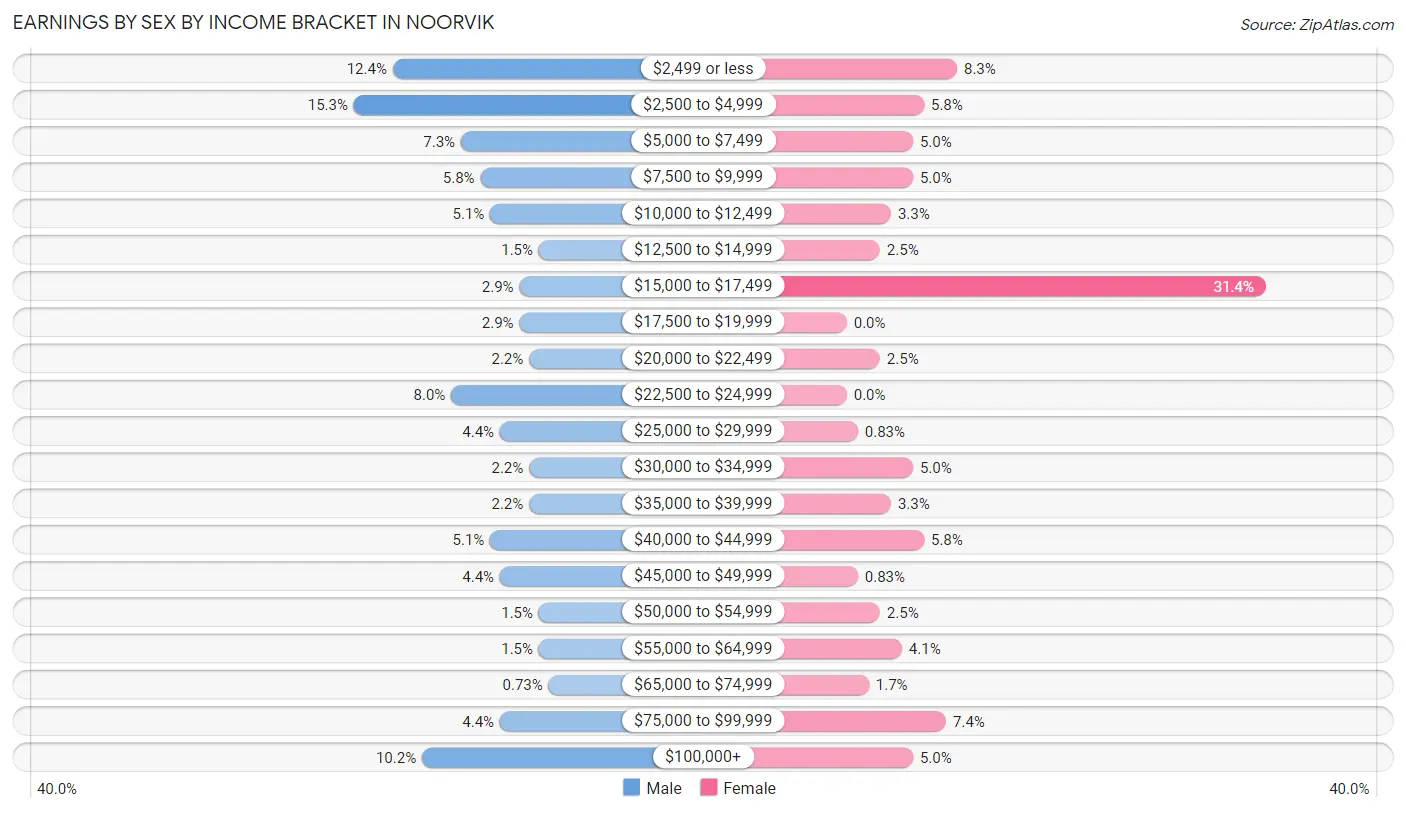
Earnings by Sex by Income Bracket in Noorvik
The most common earnings brackets in Noorvik are $2,500 to $4,999 for men (21 | 15.3%) and $15,000 to $17,499 for women (38 | 31.4%).
| Income | Male | Female |
| $2,499 or less | 17 (12.4%) | 10 (8.3%) |
| $2,500 to $4,999 | 21 (15.3%) | 7 (5.8%) |
| $5,000 to $7,499 | 10 (7.3%) | 6 (5.0%) |
| $7,500 to $9,999 | 8 (5.8%) | 6 (5.0%) |
| $10,000 to $12,499 | 7 (5.1%) | 4 (3.3%) |
| $12,500 to $14,999 | 2 (1.5%) | 3 (2.5%) |
| $15,000 to $17,499 | 4 (2.9%) | 38 (31.4%) |
| $17,500 to $19,999 | 4 (2.9%) | 0 (0.0%) |
| $20,000 to $22,499 | 3 (2.2%) | 3 (2.5%) |
| $22,500 to $24,999 | 11 (8.0%) | 0 (0.0%) |
| $25,000 to $29,999 | 6 (4.4%) | 1 (0.8%) |
| $30,000 to $34,999 | 3 (2.2%) | 6 (5.0%) |
| $35,000 to $39,999 | 3 (2.2%) | 4 (3.3%) |
| $40,000 to $44,999 | 7 (5.1%) | 7 (5.8%) |
| $45,000 to $49,999 | 6 (4.4%) | 1 (0.8%) |
| $50,000 to $54,999 | 2 (1.5%) | 3 (2.5%) |
| $55,000 to $64,999 | 2 (1.5%) | 5 (4.1%) |
| $65,000 to $74,999 | 1 (0.7%) | 2 (1.7%) |
| $75,000 to $99,999 | 6 (4.4%) | 9 (7.4%) |
| $100,000+ | 14 (10.2%) | 6 (5.0%) |
| Total | 137 (100.0%) | 121 (100.0%) |
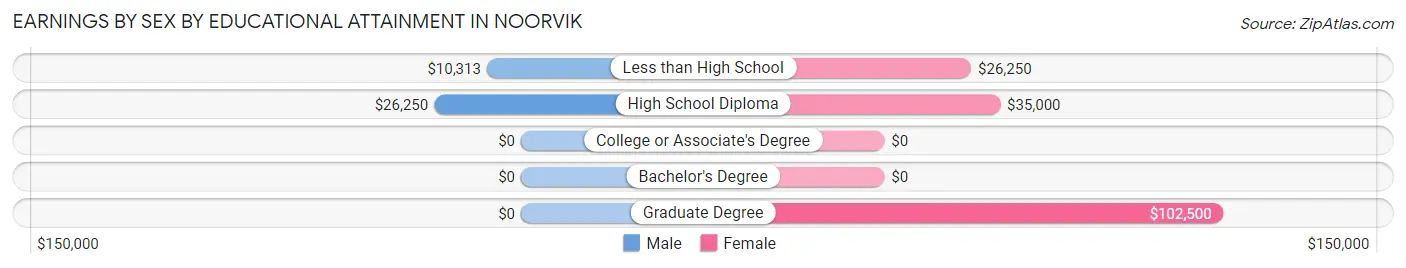
Earnings by Sex by Educational Attainment in Noorvik
| Educational Attainment | Male Income | Female Income |
| Less than High School | $10,313 | $26,250 |
| High School Diploma | $26,250 | $35,000 |
| College or Associate's Degree | - | - |
| Bachelor's Degree | - | - |
| Graduate Degree | - | - |
| Total | $23,182 | $0 |
Family Income in Noorvik
Family Income Brackets in Noorvik
According to the Noorvik family income data, there are 21 families falling into the $50,000 to $74,999 income range, which is the most common income bracket and makes up 21.0% of all families. Conversely, the $200,000+ income bracket is the least frequent group with only 1 families (1.0%) belonging to this category.
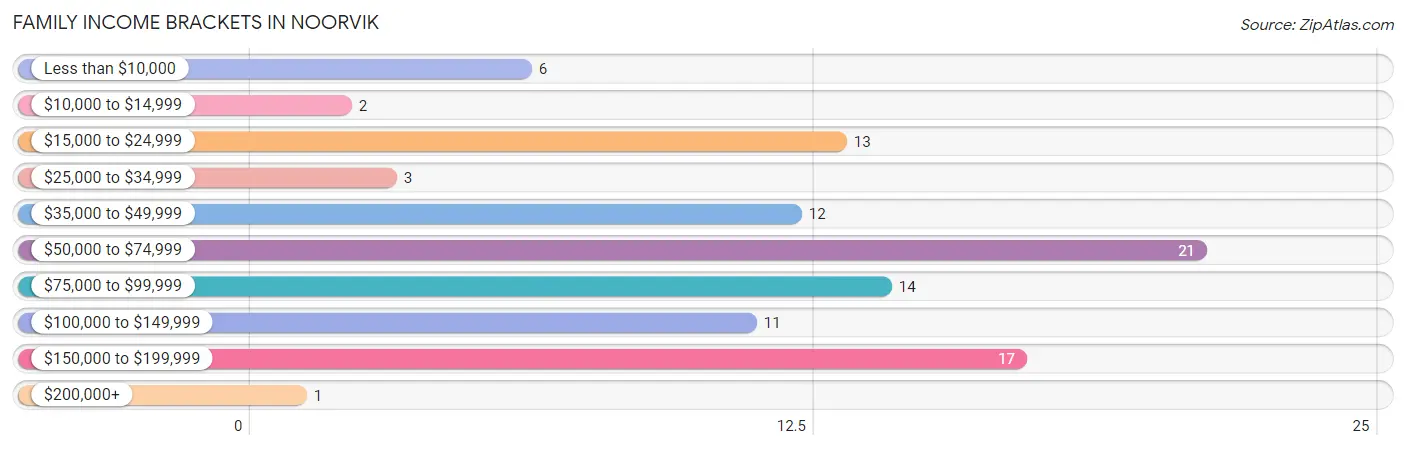
| Income Bracket | # Families | % Families |
| Less than $10,000 | 6 | 6.0% |
| $10,000 to $14,999 | 2 | 2.0% |
| $15,000 to $24,999 | 13 | 13.0% |
| $25,000 to $34,999 | 3 | 3.0% |
| $35,000 to $49,999 | 12 | 12.0% |
| $50,000 to $74,999 | 21 | 21.0% |
| $75,000 to $99,999 | 14 | 14.0% |
| $100,000 to $149,999 | 11 | 11.0% |
| $150,000 to $199,999 | 17 | 17.0% |
| $200,000+ | 1 | 1.0% |
Family Income by Famaliy Size in Noorvik
6-person families (19 | 19.0%) account for the highest median family income in Noorvik with $89,375 per family, while 6-person families (19 | 19.0%) have the highest median income of $14,896 per family member.
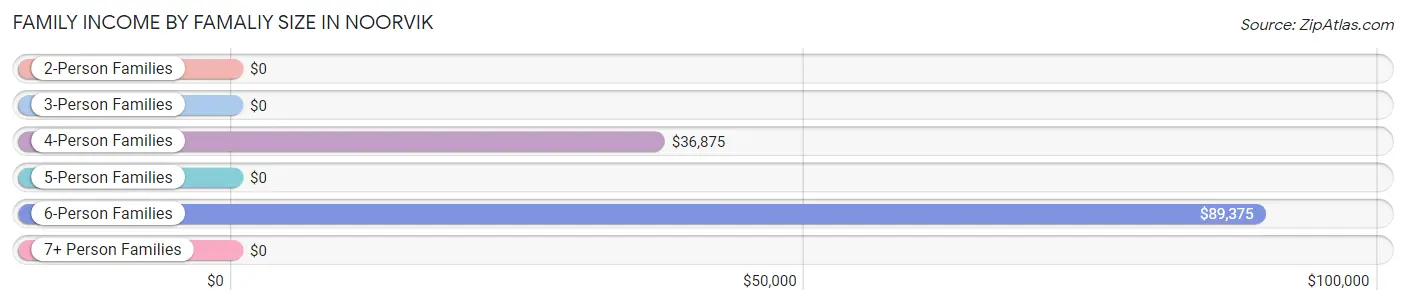
| Income Bracket | # Families | Median Income |
| 2-Person Families | 16 (16.0%) | $0 |
| 3-Person Families | 7 (7.0%) | $0 |
| 4-Person Families | 17 (17.0%) | $36,875 |
| 5-Person Families | 20 (20.0%) | $0 |
| 6-Person Families | 19 (19.0%) | $89,375 |
| 7+ Person Families | 21 (21.0%) | $0 |
| Total | 100 (100.0%) | $57,188 |
Family Income by Number of Earners in Noorvik
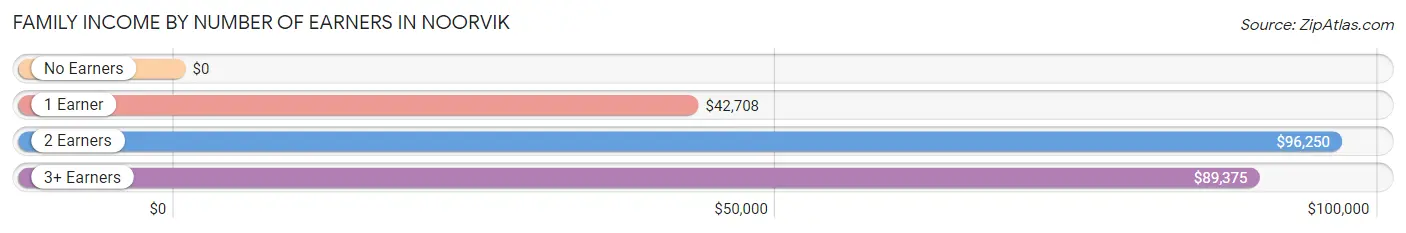
| Number of Earners | # Families | Median Income |
| No Earners | 16 (16.0%) | $0 |
| 1 Earner | 29 (29.0%) | $42,708 |
| 2 Earners | 34 (34.0%) | $96,250 |
| 3+ Earners | 21 (21.0%) | $89,375 |
| Total | 100 (100.0%) | $57,188 |
Household Income in Noorvik
Household Income Brackets in Noorvik
With 20 households falling in the category, the $100,000 to $149,999 income range is the most frequent in Noorvik, accounting for 16.7% of all households. In contrast, only 1 households (0.8%) fall into the $200,000+ income bracket, making it the least populous group.
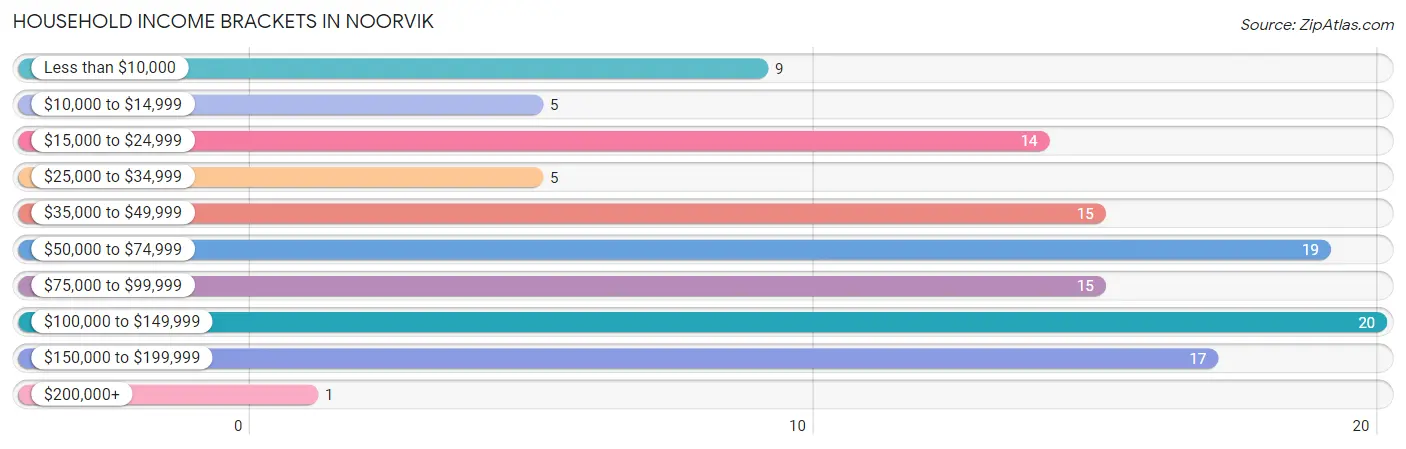
| Income Bracket | # Households | % Households |
| Less than $10,000 | 9 | 7.5% |
| $10,000 to $14,999 | 5 | 4.2% |
| $15,000 to $24,999 | 14 | 11.7% |
| $25,000 to $34,999 | 5 | 4.2% |
| $35,000 to $49,999 | 15 | 12.5% |
| $50,000 to $74,999 | 19 | 15.8% |
| $75,000 to $99,999 | 15 | 12.5% |
| $100,000 to $149,999 | 20 | 16.7% |
| $150,000 to $199,999 | 17 | 14.2% |
| $200,000+ | 1 | 0.8% |
Household Income by Householder Age in Noorvik
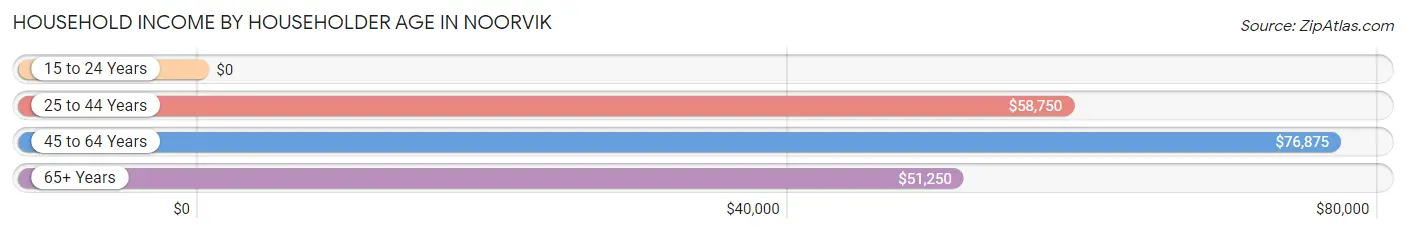
The median household income in Noorvik is $56,563, with the highest median household income of $76,875 found in the 45 to 64 years age bracket for the primary householder. A total of 61 households (50.8%) fall into this category.
| Income Bracket | # Households | Median Income |
| 15 to 24 Years | 0 (0.0%) | $0 |
| 25 to 44 Years | 28 (23.3%) | $58,750 |
| 45 to 64 Years | 61 (50.8%) | $76,875 |
| 65+ Years | 31 (25.8%) | $51,250 |
| Total | 120 (100.0%) | $56,563 |
Poverty in Noorvik
Income Below Poverty by Sex and Age in Noorvik
With 23.9% poverty level for males and 21.4% for females among the residents of Noorvik, 16 and 17 year old males and 25 to 34 year old females are the most vulnerable to poverty, with 7 males (41.2%) and 16 females (48.5%) in their respective age groups living below the poverty level.
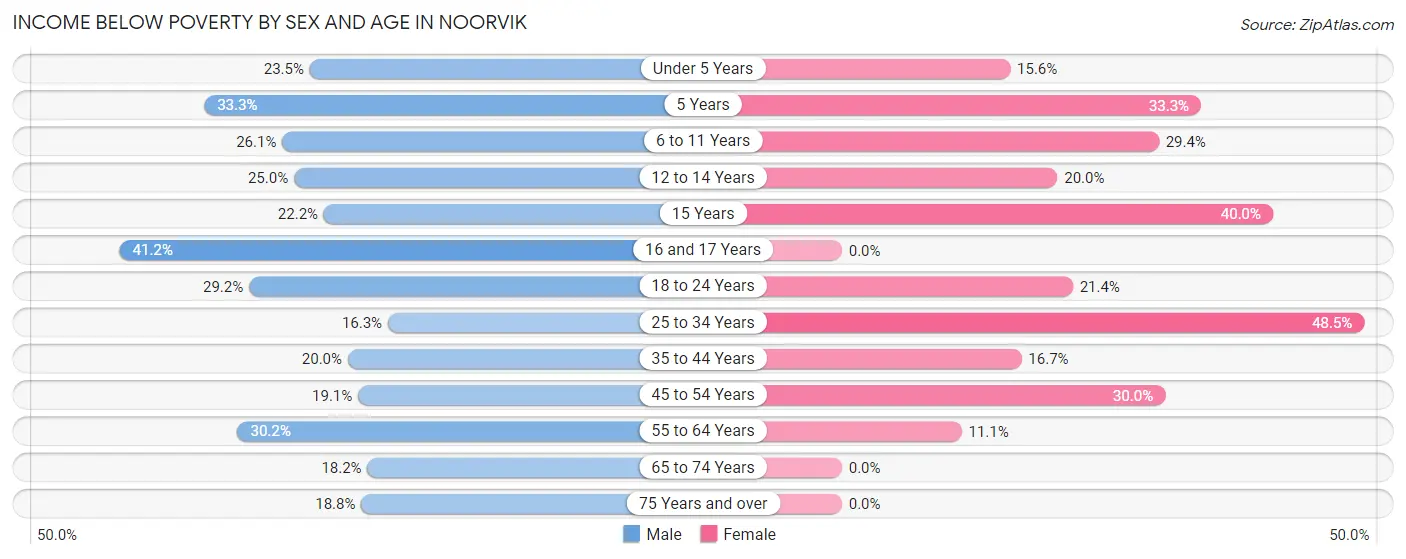
| Age Bracket | Male | Female |
| Under 5 Years | 8 (23.5%) | 5 (15.6%) |
| 5 Years | 2 (33.3%) | 2 (33.3%) |
| 6 to 11 Years | 12 (26.1%) | 10 (29.4%) |
| 12 to 14 Years | 6 (25.0%) | 6 (20.0%) |
| 15 Years | 2 (22.2%) | 2 (40.0%) |
| 16 and 17 Years | 7 (41.2%) | 0 (0.0%) |
| 18 to 24 Years | 7 (29.2%) | 6 (21.4%) |
| 25 to 34 Years | 7 (16.3%) | 16 (48.5%) |
| 35 to 44 Years | 8 (20.0%) | 3 (16.7%) |
| 45 to 54 Years | 8 (19.1%) | 6 (30.0%) |
| 55 to 64 Years | 13 (30.2%) | 6 (11.1%) |
| 65 to 74 Years | 2 (18.2%) | 0 (0.0%) |
| 75 Years and over | 3 (18.8%) | 0 (0.0%) |
| Total | 85 (23.9%) | 62 (21.4%) |
Income Above Poverty by Sex and Age in Noorvik
According to the poverty statistics in Noorvik, males aged 25 to 34 years and females aged 16 and 17 years are the age groups that are most secure financially, with 83.7% of males and 100.0% of females in these age groups living above the poverty line.
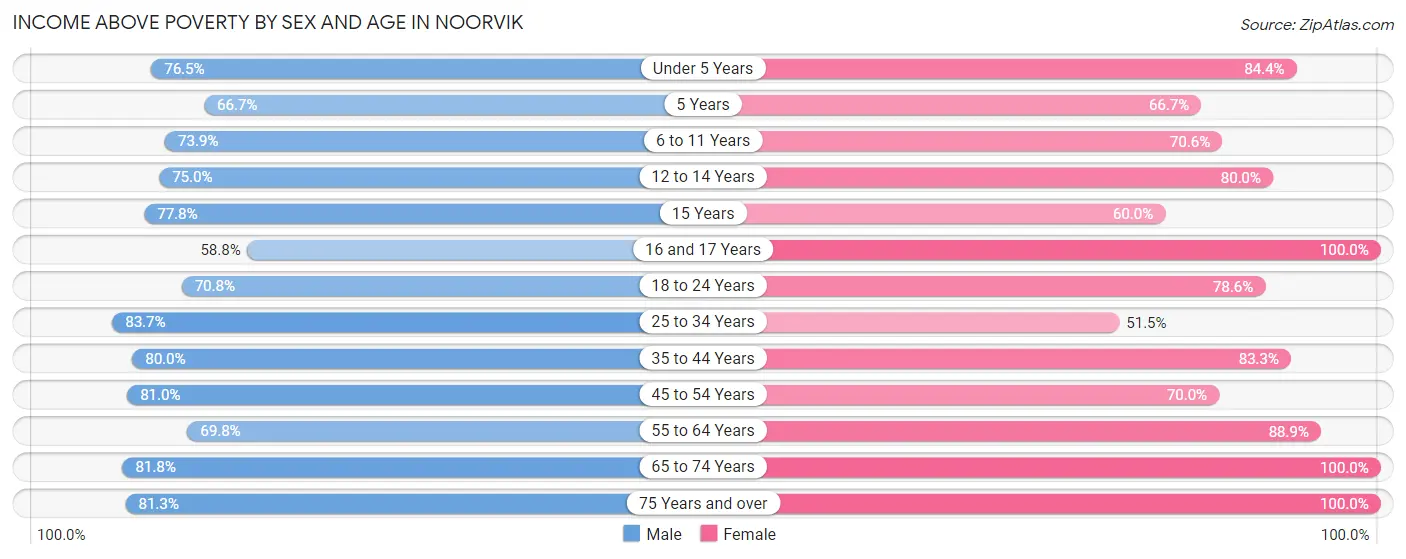
| Age Bracket | Male | Female |
| Under 5 Years | 26 (76.5%) | 27 (84.4%) |
| 5 Years | 4 (66.7%) | 4 (66.7%) |
| 6 to 11 Years | 34 (73.9%) | 24 (70.6%) |
| 12 to 14 Years | 18 (75.0%) | 24 (80.0%) |
| 15 Years | 7 (77.8%) | 3 (60.0%) |
| 16 and 17 Years | 10 (58.8%) | 9 (100.0%) |
| 18 to 24 Years | 17 (70.8%) | 22 (78.6%) |
| 25 to 34 Years | 36 (83.7%) | 17 (51.5%) |
| 35 to 44 Years | 32 (80.0%) | 15 (83.3%) |
| 45 to 54 Years | 34 (80.9%) | 14 (70.0%) |
| 55 to 64 Years | 30 (69.8%) | 48 (88.9%) |
| 65 to 74 Years | 9 (81.8%) | 18 (100.0%) |
| 75 Years and over | 13 (81.2%) | 3 (100.0%) |
| Total | 270 (76.1%) | 228 (78.6%) |
Income Below Poverty Among Married-Couple Families in Noorvik
The poverty statistics for married-couple families in Noorvik show that 10.5% or 6 of the total 57 families live below the poverty line. Families with no children have the highest poverty rate of 22.2%, comprising of 2 families. On the other hand, families with 3 or 4 children have the lowest poverty rate of 0.0%, which includes 0 families.
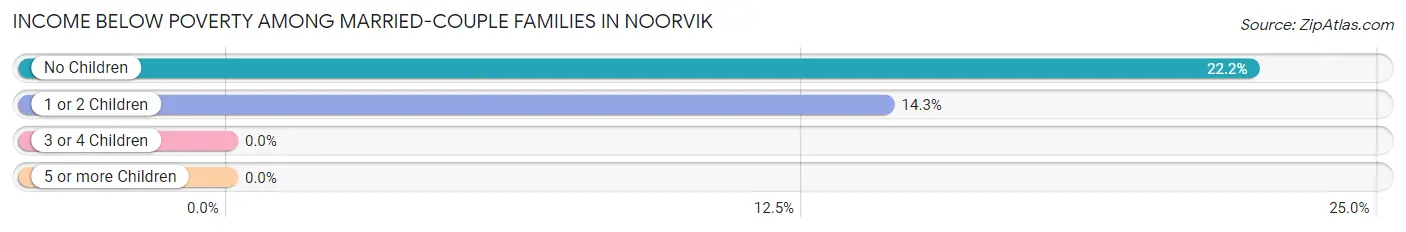
| Children | Above Poverty | Below Poverty |
| No Children | 7 (77.8%) | 2 (22.2%) |
| 1 or 2 Children | 24 (85.7%) | 4 (14.3%) |
| 3 or 4 Children | 16 (100.0%) | 0 (0.0%) |
| 5 or more Children | 4 (100.0%) | 0 (0.0%) |
| Total | 51 (89.5%) | 6 (10.5%) |
Income Below Poverty Among Single-Parent Households in Noorvik
According to the poverty data in Noorvik, 48.1% or 13 single-father households and 56.2% or 9 single-mother households are living below the poverty line. Among single-father households, those with 3 or 4 children have the highest poverty rate, with 7 households (77.8%) experiencing poverty. Likewise, among single-mother households, those with no children have the highest poverty rate, with 2 households (100.0%) falling below the poverty line.
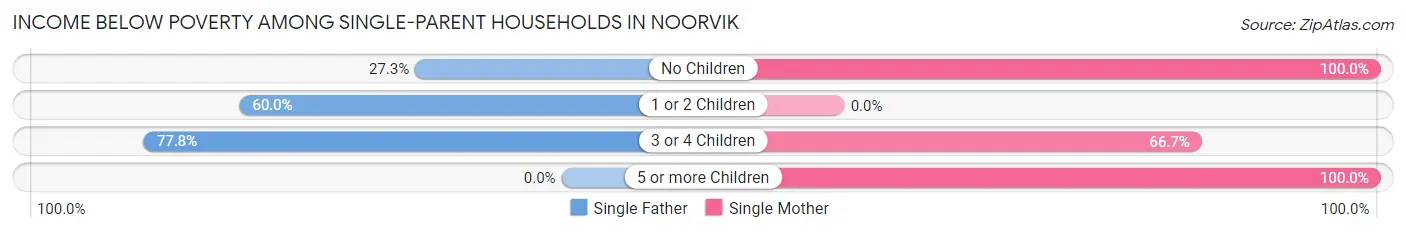
| Children | Single Father | Single Mother |
| No Children | 3 (27.3%) | 2 (100.0%) |
| 1 or 2 Children | 3 (60.0%) | 0 (0.0%) |
| 3 or 4 Children | 7 (77.8%) | 6 (66.7%) |
| 5 or more Children | 0 (0.0%) | 1 (100.0%) |
| Total | 13 (48.1%) | 9 (56.2%) |
Income Below Poverty Among Married-Couple vs Single-Parent Households in Noorvik
The poverty data for Noorvik shows that 6 of the married-couple family households (10.5%) and 22 of the single-parent households (51.2%) are living below the poverty level. Within the married-couple family households, those with no children have the highest poverty rate, with 2 households (22.2%) falling below the poverty line. Among the single-parent households, those with 3 or 4 children have the highest poverty rate, with 13 household (72.2%) living below poverty.
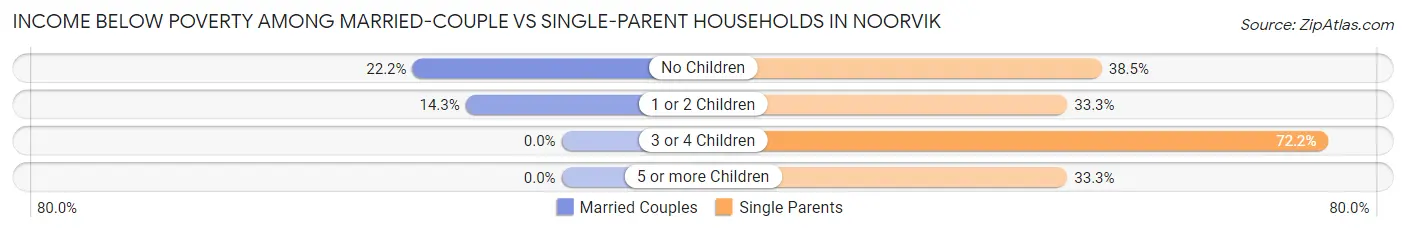
| Children | Married-Couple Families | Single-Parent Households |
| No Children | 2 (22.2%) | 5 (38.5%) |
| 1 or 2 Children | 4 (14.3%) | 3 (33.3%) |
| 3 or 4 Children | 0 (0.0%) | 13 (72.2%) |
| 5 or more Children | 0 (0.0%) | 1 (33.3%) |
| Total | 6 (10.5%) | 22 (51.2%) |
Race in Noorvik
The most populous races in Noorvik are Native / Alaskan (590 | 90.2%), Asian (33 | 5.1%), and Two or more Races (18 | 2.8%).
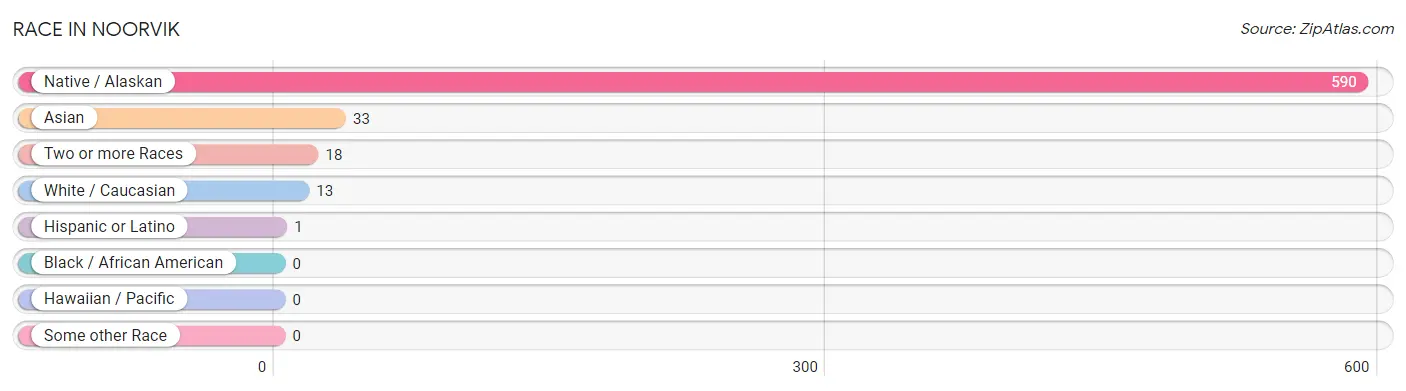
| Race | # Population | % Population |
| Asian | 33 | 5.1% |
| Black / African American | 0 | 0.0% |
| Hawaiian / Pacific | 0 | 0.0% |
| Hispanic or Latino | 1 | 0.2% |
| Native / Alaskan | 590 | 90.2% |
| White / Caucasian | 13 | 2.0% |
| Two or more Races | 18 | 2.8% |
| Some other Race | 0 | 0.0% |
| Total | 654 | 100.0% |
Ancestry in Noorvik
The most populous ancestries reported in Noorvik are Inupiat (584 | 89.3%), Korean (41 | 6.3%), Tlingit-Haida (12 | 1.8%), German (11 | 1.7%), and Samoan (8 | 1.2%), together accounting for 100.3% of all Noorvik residents.
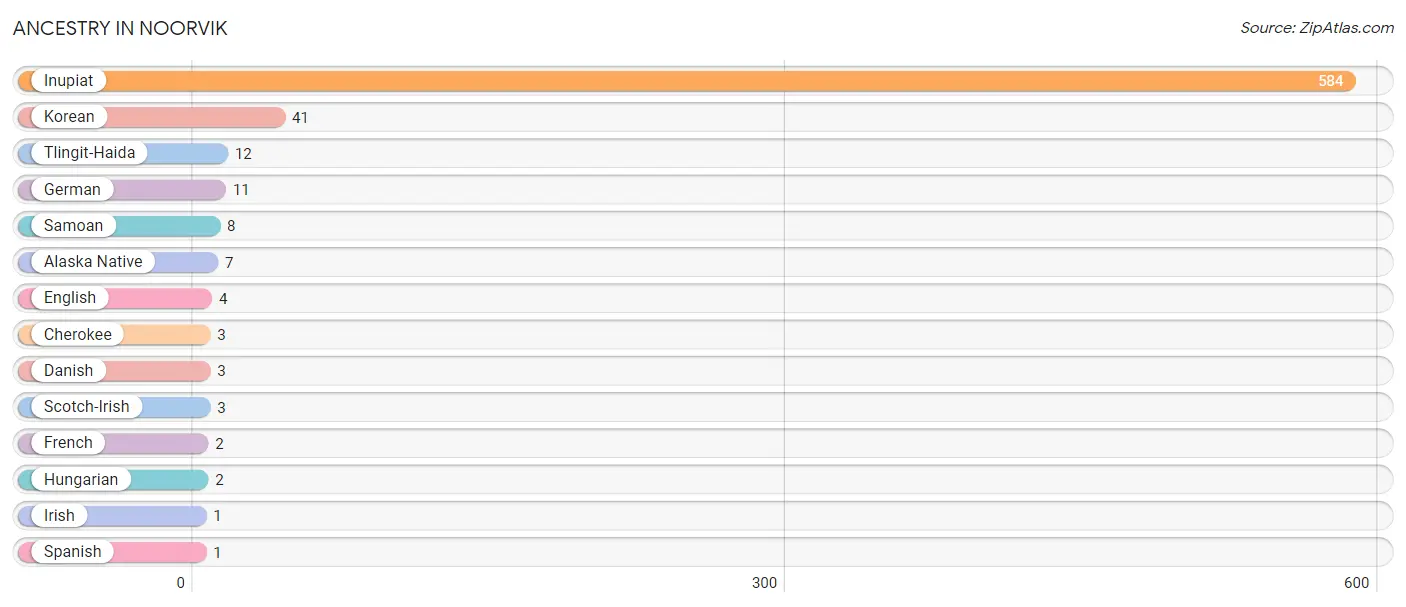
| Ancestry | # Population | % Population |
| Alaska Native | 7 | 1.1% |
| Cherokee | 3 | 0.5% |
| Danish | 3 | 0.5% |
| English | 4 | 0.6% |
| French | 2 | 0.3% |
| German | 11 | 1.7% |
| Hungarian | 2 | 0.3% |
| Inupiat | 584 | 89.3% |
| Irish | 1 | 0.2% |
| Korean | 41 | 6.3% |
| Samoan | 8 | 1.2% |
| Scotch-Irish | 3 | 0.5% |
| Spanish | 1 | 0.2% |
| Tlingit-Haida | 12 | 1.8% | View All 14 Rows |
Immigrants in Noorvik
The most numerous immigrant groups reported in Noorvik came from Asia (33 | 5.1%), Philippines (33 | 5.1%), South Eastern Asia (33 | 5.1%), Canada (3 | 0.5%), and Europe (2 | 0.3%), together accounting for 15.9% of all Noorvik residents.
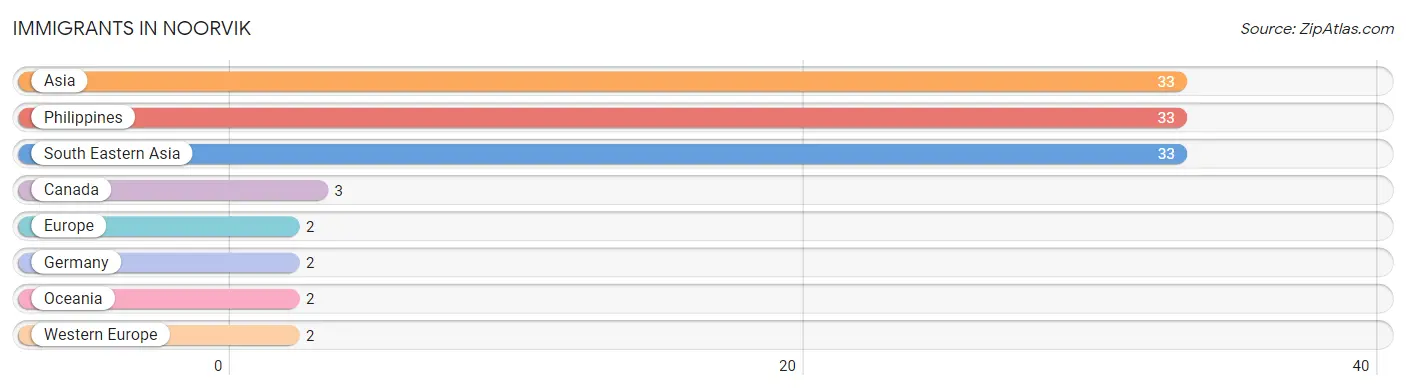
| Immigration Origin | # Population | % Population |
| Asia | 33 | 5.1% |
| Canada | 3 | 0.5% |
| Europe | 2 | 0.3% |
| Germany | 2 | 0.3% |
| Oceania | 2 | 0.3% |
| Philippines | 33 | 5.1% |
| South Eastern Asia | 33 | 5.1% |
| Western Europe | 2 | 0.3% | View All 8 Rows |
Sex and Age in Noorvik
Sex and Age in Noorvik
The most populous age groups in Noorvik are 10 to 14 Years (42 | 11.6%) for men and 10 to 14 Years (41 | 14.0%) for women.
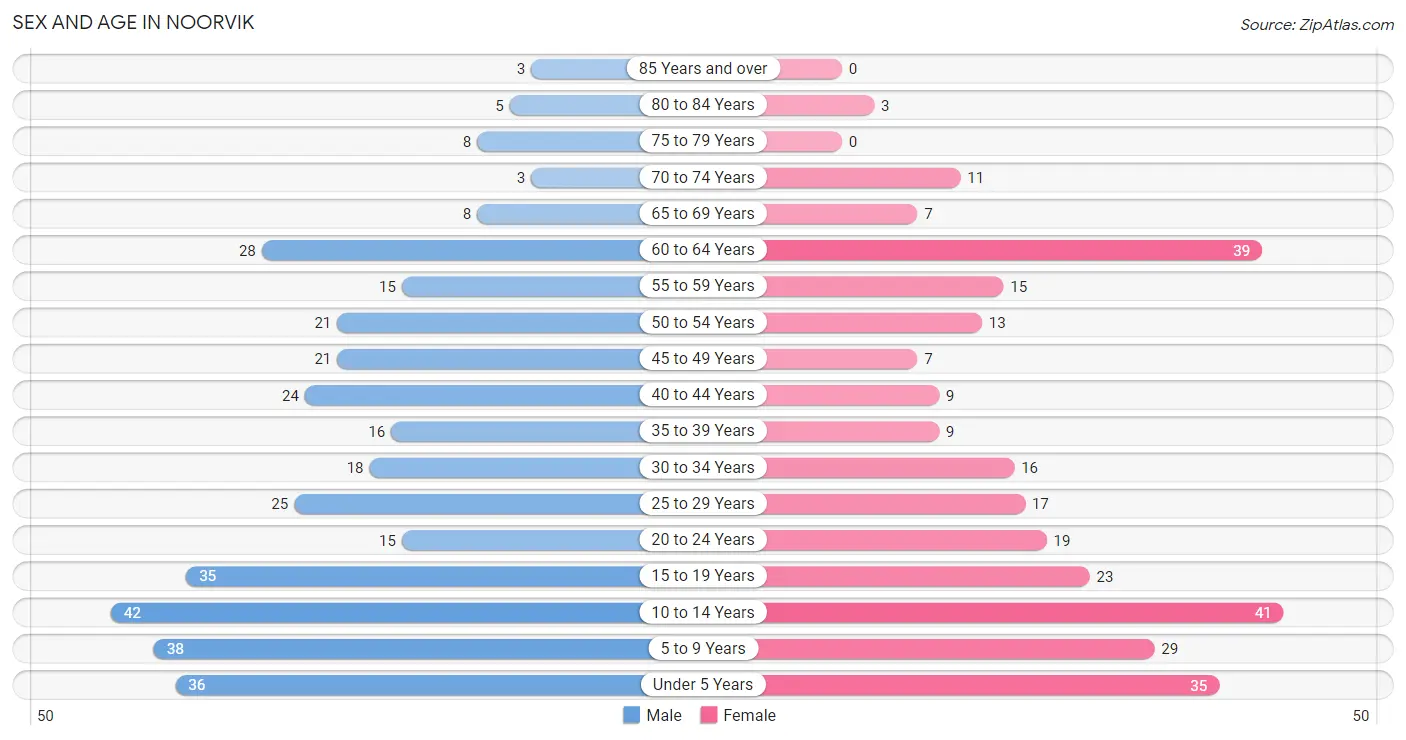
| Age Bracket | Male | Female |
| Under 5 Years | 36 (10.0%) | 35 (11.9%) |
| 5 to 9 Years | 38 (10.5%) | 29 (9.9%) |
| 10 to 14 Years | 42 (11.6%) | 41 (14.0%) |
| 15 to 19 Years | 35 (9.7%) | 23 (7.9%) |
| 20 to 24 Years | 15 (4.2%) | 19 (6.5%) |
| 25 to 29 Years | 25 (6.9%) | 17 (5.8%) |
| 30 to 34 Years | 18 (5.0%) | 16 (5.5%) |
| 35 to 39 Years | 16 (4.4%) | 9 (3.1%) |
| 40 to 44 Years | 24 (6.7%) | 9 (3.1%) |
| 45 to 49 Years | 21 (5.8%) | 7 (2.4%) |
| 50 to 54 Years | 21 (5.8%) | 13 (4.4%) |
| 55 to 59 Years | 15 (4.2%) | 15 (5.1%) |
| 60 to 64 Years | 28 (7.8%) | 39 (13.3%) |
| 65 to 69 Years | 8 (2.2%) | 7 (2.4%) |
| 70 to 74 Years | 3 (0.8%) | 11 (3.7%) |
| 75 to 79 Years | 8 (2.2%) | 0 (0.0%) |
| 80 to 84 Years | 5 (1.4%) | 3 (1.0%) |
| 85 Years and over | 3 (0.8%) | 0 (0.0%) |
| Total | 361 (100.0%) | 293 (100.0%) |
Families and Households in Noorvik
Median Family Size in Noorvik
The median family size in Noorvik is 5.69 persons per family, with single female/mother families (16 | 16.0%) accounting for the largest median family size of 6.31 persons per family. On the other hand, single male/father families (27 | 27.0%) represent the smallest median family size with 4.37 persons per family.
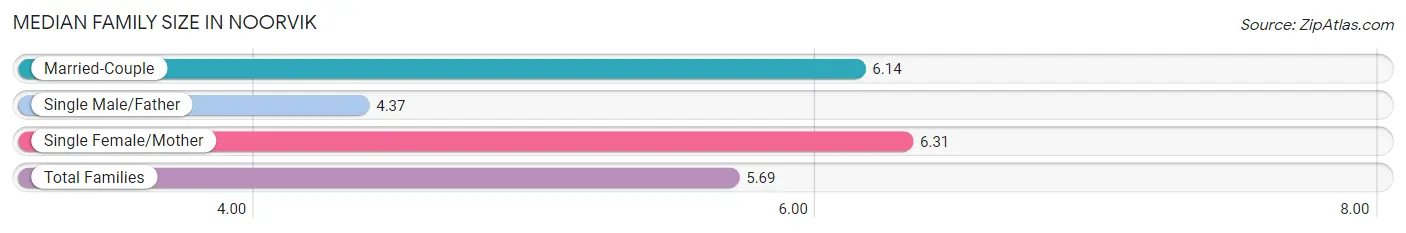
| Family Type | # Families | Family Size |
| Married-Couple | 57 (57.0%) | 6.14 |
| Single Male/Father | 27 (27.0%) | 4.37 |
| Single Female/Mother | 16 (16.0%) | 6.31 |
| Total Families | 100 (100.0%) | 5.69 |
Median Household Size in Noorvik
The median household size in Noorvik is 5.18 persons per household, with single female/mother households (16 | 13.3%) accounting for the largest median household size of 6.69 persons per household. non-family households (20 | 16.7%) represent the smallest median household size with 1.55 persons per household.
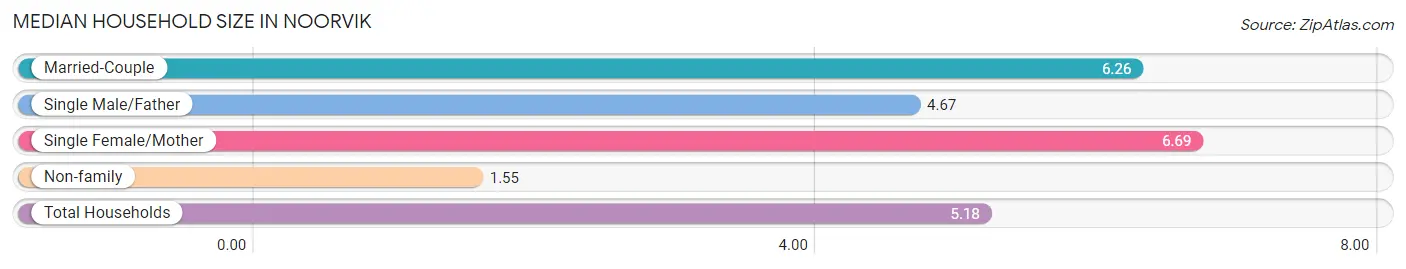
| Household Type | # Households | Household Size |
| Married-Couple | 57 (47.5%) | 6.26 |
| Single Male/Father | 27 (22.5%) | 4.67 |
| Single Female/Mother | 16 (13.3%) | 6.69 |
| Non-family | 20 (16.7%) | 1.55 |
| Total Households | 120 (100.0%) | 5.18 |
Household Size by Marriage Status in Noorvik
Out of a total of 120 households in Noorvik, 100 (83.3%) are family households, while 20 (16.7%) are nonfamily households. The most numerous type of family households are 5-person households, comprising 23, and the most common type of nonfamily households are 1-person households, comprising 14.
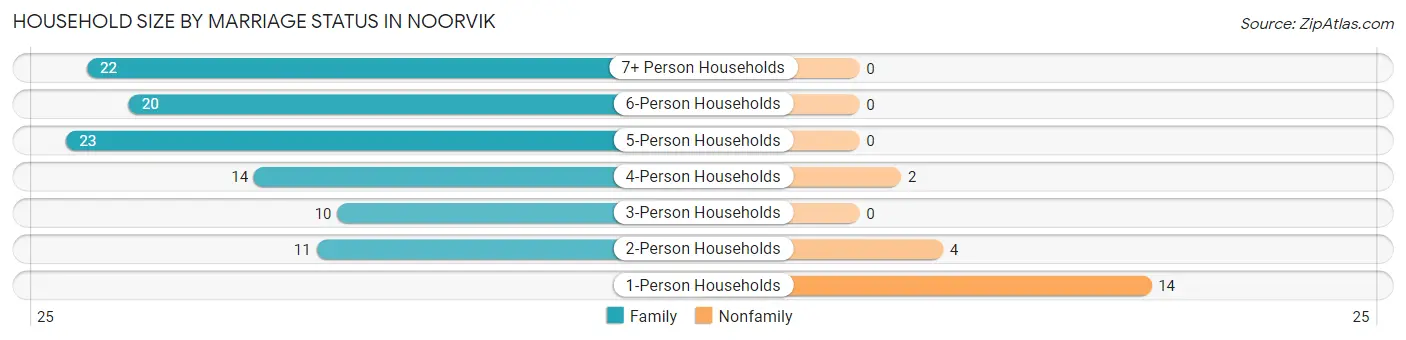
| Household Size | Family Households | Nonfamily Households |
| 1-Person Households | - | 14 (11.7%) |
| 2-Person Households | 11 (9.2%) | 4 (3.3%) |
| 3-Person Households | 10 (8.3%) | 0 (0.0%) |
| 4-Person Households | 14 (11.7%) | 2 (1.7%) |
| 5-Person Households | 23 (19.2%) | 0 (0.0%) |
| 6-Person Households | 20 (16.7%) | 0 (0.0%) |
| 7+ Person Households | 22 (18.3%) | 0 (0.0%) |
| Total | 100 (83.3%) | 20 (16.7%) |
Female Fertility in Noorvik
Fertility by Age in Noorvik
Average fertility rate in Noorvik is 127.0 births per 1,000 women. Women in the age bracket of 20 to 34 years have the highest fertility rate with 212.0 births per 1,000 women. Women in the age bracket of 20 to 34 years acount for 84.6% of all women with births.
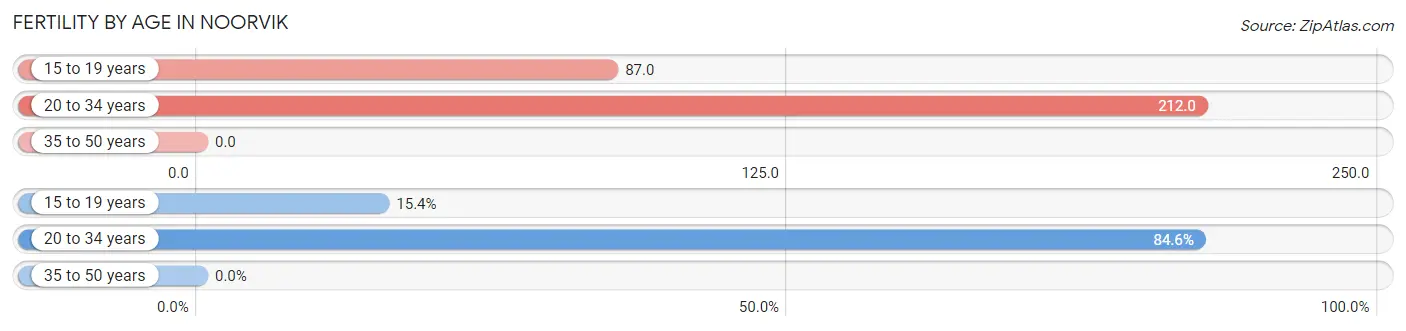
| Age Bracket | Women with Births | Births / 1,000 Women |
| 15 to 19 years | 2 (15.4%) | 87.0 |
| 20 to 34 years | 11 (84.6%) | 212.0 |
| 35 to 50 years | 0 (0.0%) | 0.0 |
| Total | 13 (100.0%) | 127.0 |
Fertility by Age by Marriage Status in Noorvik
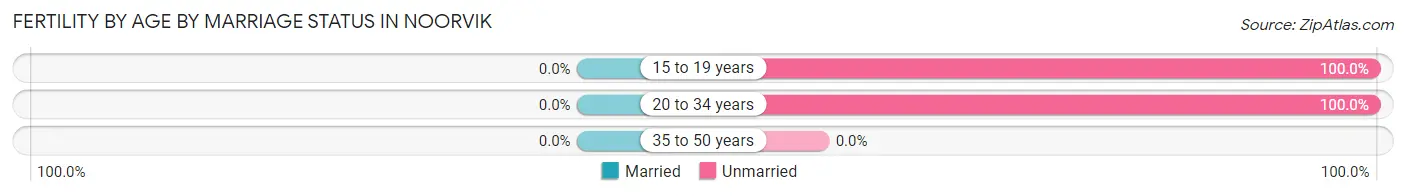
| Age Bracket | Married | Unmarried |
| 15 to 19 years | 0 (0.0%) | 2 (100.0%) |
| 20 to 34 years | 0 (0.0%) | 11 (100.0%) |
| 35 to 50 years | 0 (0.0%) | 0 (0.0%) |
| Total | 0 (0.0%) | 13 (100.0%) |
Fertility by Education in Noorvik
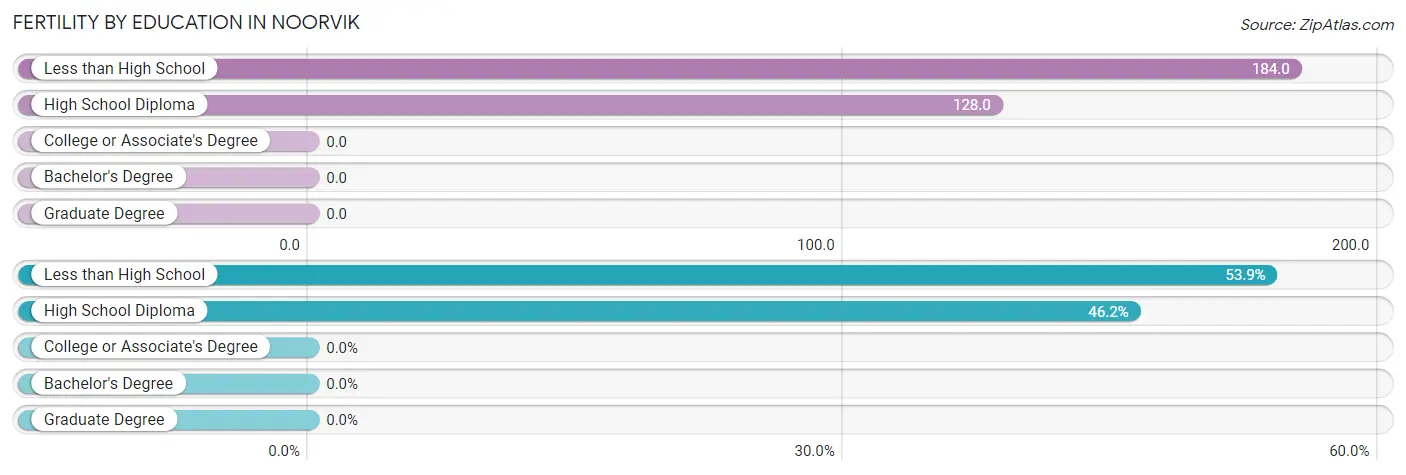
| Educational Attainment | Women with Births | Births / 1,000 Women |
| Less than High School | 7 (53.8%) | 184.0 |
| High School Diploma | 6 (46.2%) | 128.0 |
| College or Associate's Degree | 0 (0.0%) | 0.0 |
| Bachelor's Degree | 0 (0.0%) | 0.0 |
| Graduate Degree | 0 (0.0%) | 0.0 |
| Total | 13 (100.0%) | 127.0 |
Fertility by Education by Marriage Status in Noorvik
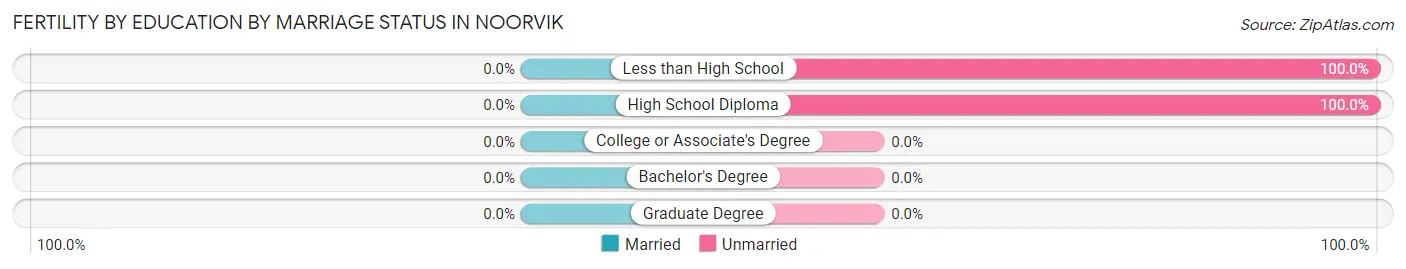
| Educational Attainment | Married | Unmarried |
| Less than High School | 0 (0.0%) | 7 (100.0%) |
| High School Diploma | 0 (0.0%) | 6 (100.0%) |
| College or Associate's Degree | 0 (0.0%) | 0 (0.0%) |
| Bachelor's Degree | 0 (0.0%) | 0 (0.0%) |
| Graduate Degree | 0 (0.0%) | 0 (0.0%) |
| Total | 0 (0.0%) | 13 (100.0%) |
Employment Characteristics in Noorvik
Employment by Class of Employer in Noorvik
Among the 109 employed individuals in Noorvik, private company employees (42 | 38.5%), local government employees (30 | 27.5%), and not-for-profit organizations (19 | 17.4%) make up the most common classes of employment.
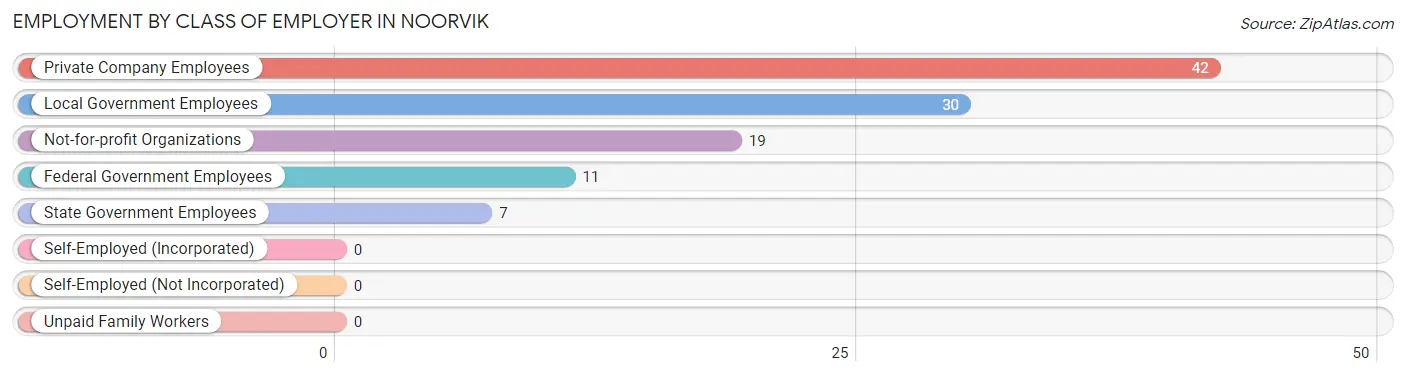
| Employer Class | # Employees | % Employees |
| Private Company Employees | 42 | 38.5% |
| Self-Employed (Incorporated) | 0 | 0.0% |
| Self-Employed (Not Incorporated) | 0 | 0.0% |
| Not-for-profit Organizations | 19 | 17.4% |
| Local Government Employees | 30 | 27.5% |
| State Government Employees | 7 | 6.4% |
| Federal Government Employees | 11 | 10.1% |
| Unpaid Family Workers | 0 | 0.0% |
| Total | 109 | 100.0% |
Employment Status by Age in Noorvik
According to the labor force statistics for Noorvik, out of the total population over 16 years of age (419), 45.3% or 190 individuals are in the labor force, with 33.7% or 64 of them unemployed. The age group with the highest labor force participation rate is 25 to 29 years, with 73.8% or 31 individuals in the labor force. Within the labor force, the 16 to 19 years age range has the highest percentage of unemployed individuals, with 78.6% or 11 of them being unemployed.
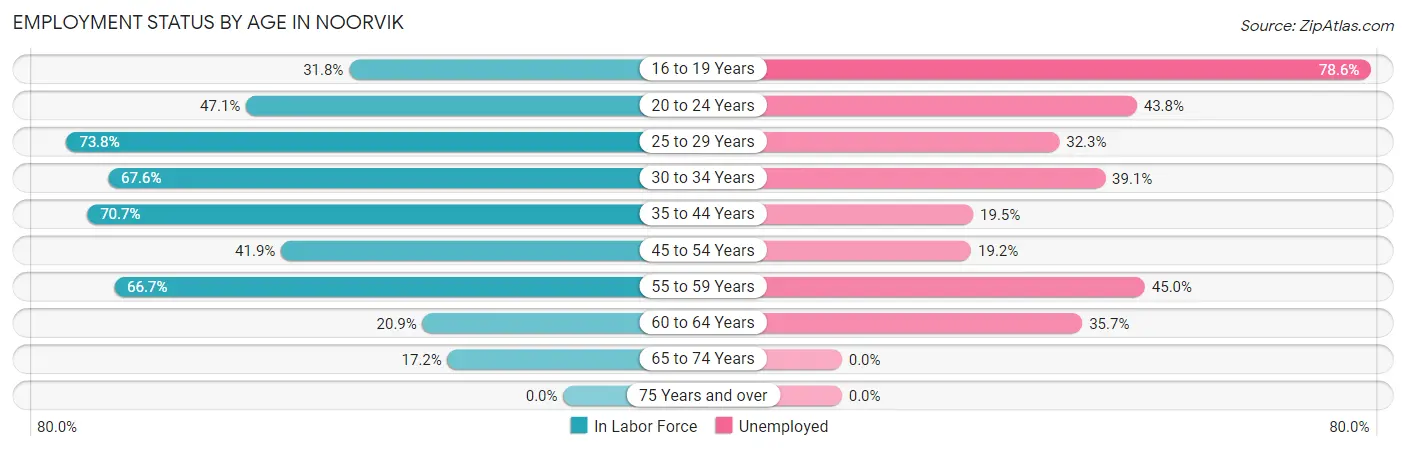
| Age Bracket | In Labor Force | Unemployed |
| 16 to 19 Years | 14 (31.8%) | 11 (78.6%) |
| 20 to 24 Years | 16 (47.1%) | 7 (43.8%) |
| 25 to 29 Years | 31 (73.8%) | 10 (32.3%) |
| 30 to 34 Years | 23 (67.6%) | 9 (39.1%) |
| 35 to 44 Years | 41 (70.7%) | 8 (19.5%) |
| 45 to 54 Years | 26 (41.9%) | 5 (19.2%) |
| 55 to 59 Years | 20 (66.7%) | 9 (45.0%) |
| 60 to 64 Years | 14 (20.9%) | 5 (35.7%) |
| 65 to 74 Years | 5 (17.2%) | 0 (0.0%) |
| 75 Years and over | 0 (0.0%) | 0 (0.0%) |
| Total | 190 (45.3%) | 64 (33.7%) |
Employment Status by Educational Attainment in Noorvik
According to labor force statistics for Noorvik, 52.9% of individuals (155) out of the total population between 25 and 64 years of age (293) are in the labor force, with 29.7% or 46 of them being unemployed. The group with the highest labor force participation rate are those with the educational attainment of high school diploma, with 65.5% or 93 individuals in the labor force. Within the labor force, individuals with college / associate degree education have the highest percentage of unemployment, with 43.8% or 7 of them being unemployed.
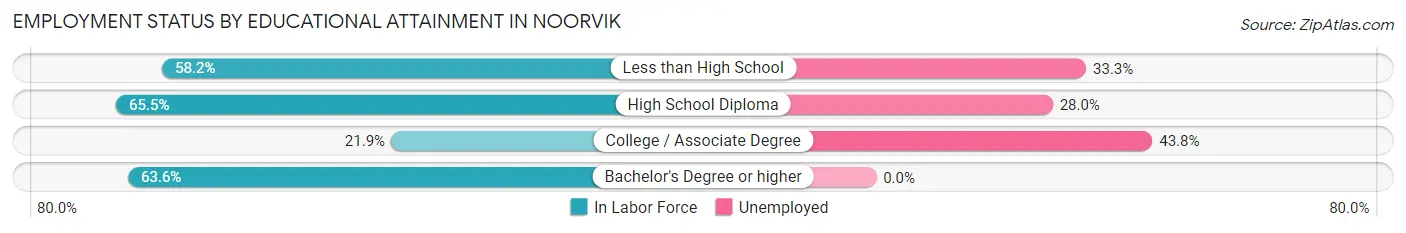
| Educational Attainment | In Labor Force | Unemployed |
| Less than High School | 39 (58.2%) | 22 (33.3%) |
| High School Diploma | 93 (65.5%) | 40 (28.0%) |
| College / Associate Degree | 16 (21.9%) | 32 (43.8%) |
| Bachelor's Degree or higher | 7 (63.6%) | 0 (0.0%) |
| Total | 155 (52.9%) | 87 (29.7%) |
Employment Occupations by Sex in Noorvik
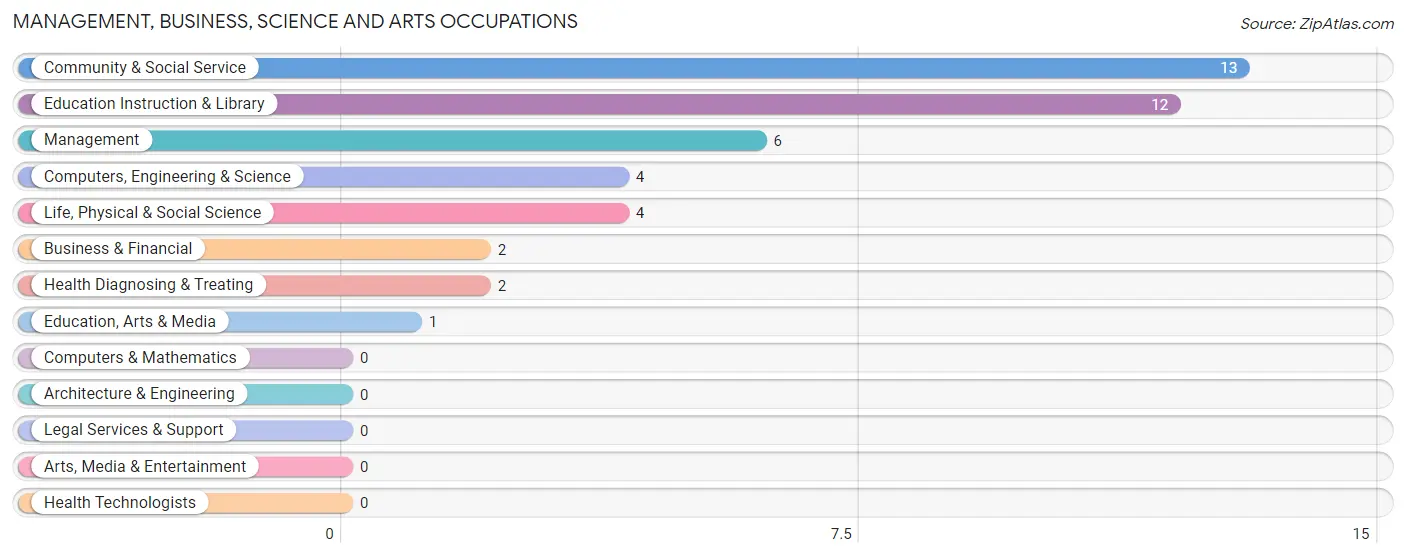
Management, Business, Science and Arts Occupations
The most common Management, Business, Science and Arts occupations in Noorvik are Community & Social Service (13 | 10.3%), Education Instruction & Library (12 | 9.5%), Management (6 | 4.8%), Computers, Engineering & Science (4 | 3.2%), and Life, Physical & Social Science (4 | 3.2%).
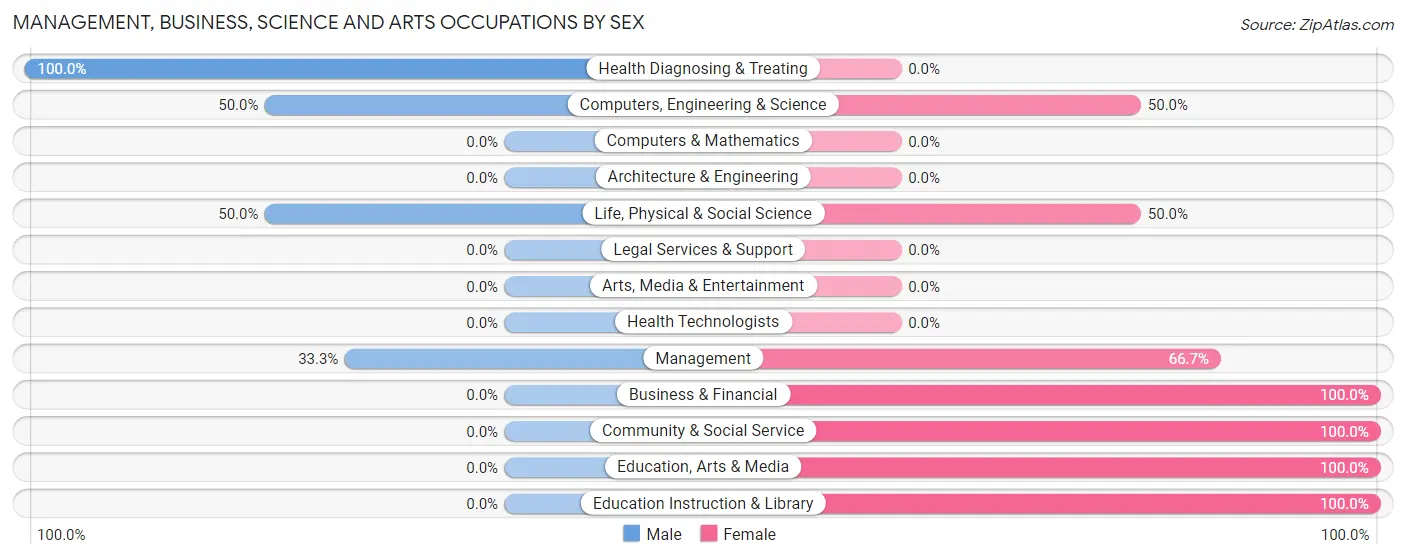
Management, Business, Science and Arts Occupations by Sex
Within the Management, Business, Science and Arts occupations in Noorvik, the most male-oriented occupations are Health Diagnosing & Treating (100.0%), Computers, Engineering & Science (50.0%), and Life, Physical & Social Science (50.0%), while the most female-oriented occupations are Business & Financial (100.0%), Community & Social Service (100.0%), and Education, Arts & Media (100.0%).
| Occupation | Male | Female |
| Management | 2 (33.3%) | 4 (66.7%) |
| Business & Financial | 0 (0.0%) | 2 (100.0%) |
| Computers, Engineering & Science | 2 (50.0%) | 2 (50.0%) |
| Computers & Mathematics | 0 (0.0%) | 0 (0.0%) |
| Architecture & Engineering | 0 (0.0%) | 0 (0.0%) |
| Life, Physical & Social Science | 2 (50.0%) | 2 (50.0%) |
| Community & Social Service | 0 (0.0%) | 13 (100.0%) |
| Education, Arts & Media | 0 (0.0%) | 1 (100.0%) |
| Legal Services & Support | 0 (0.0%) | 0 (0.0%) |
| Education Instruction & Library | 0 (0.0%) | 12 (100.0%) |
| Arts, Media & Entertainment | 0 (0.0%) | 0 (0.0%) |
| Health Diagnosing & Treating | 2 (100.0%) | 0 (0.0%) |
| Health Technologists | 0 (0.0%) | 0 (0.0%) |
| Total (Category) | 6 (22.2%) | 21 (77.8%) |
| Total (Overall) | 72 (57.1%) | 54 (42.9%) |
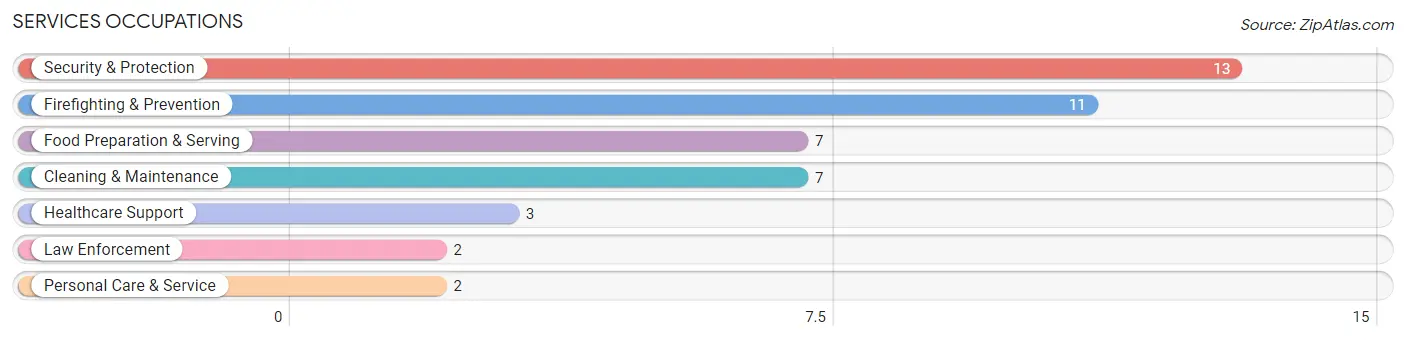
Services Occupations
The most common Services occupations in Noorvik are Security & Protection (13 | 10.3%), Firefighting & Prevention (11 | 8.7%), Food Preparation & Serving (7 | 5.6%), Cleaning & Maintenance (7 | 5.6%), and Healthcare Support (3 | 2.4%).
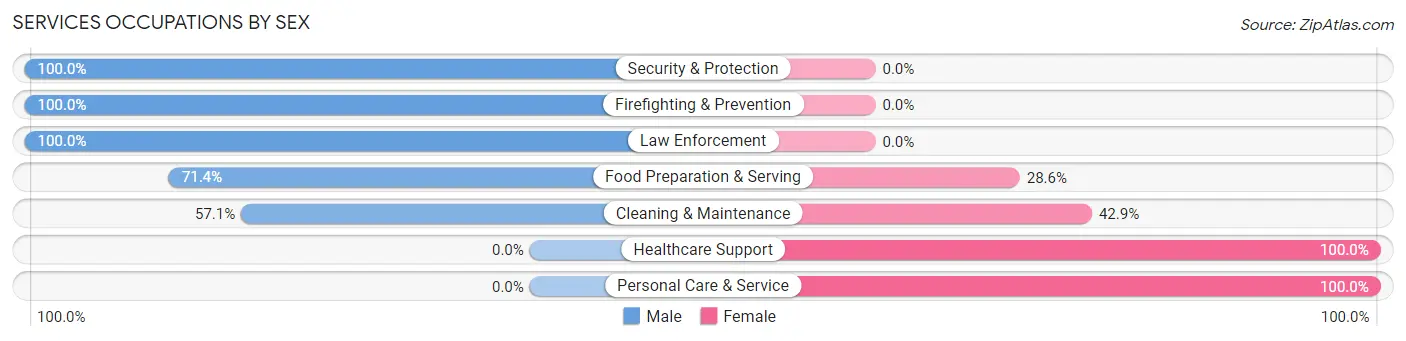
Services Occupations by Sex
Within the Services occupations in Noorvik, the most male-oriented occupations are Security & Protection (100.0%), Firefighting & Prevention (100.0%), and Law Enforcement (100.0%), while the most female-oriented occupations are Healthcare Support (100.0%), Personal Care & Service (100.0%), and Cleaning & Maintenance (42.9%).
| Occupation | Male | Female |
| Healthcare Support | 0 (0.0%) | 3 (100.0%) |
| Security & Protection | 13 (100.0%) | 0 (0.0%) |
| Firefighting & Prevention | 11 (100.0%) | 0 (0.0%) |
| Law Enforcement | 2 (100.0%) | 0 (0.0%) |
| Food Preparation & Serving | 5 (71.4%) | 2 (28.6%) |
| Cleaning & Maintenance | 4 (57.1%) | 3 (42.9%) |
| Personal Care & Service | 0 (0.0%) | 2 (100.0%) |
| Total (Category) | 22 (68.8%) | 10 (31.2%) |
| Total (Overall) | 72 (57.1%) | 54 (42.9%) |
Sales and Office Occupations
The most common Sales and Office occupations in Noorvik are Office & Administration (11 | 8.7%), and Sales & Related (5 | 4.0%).
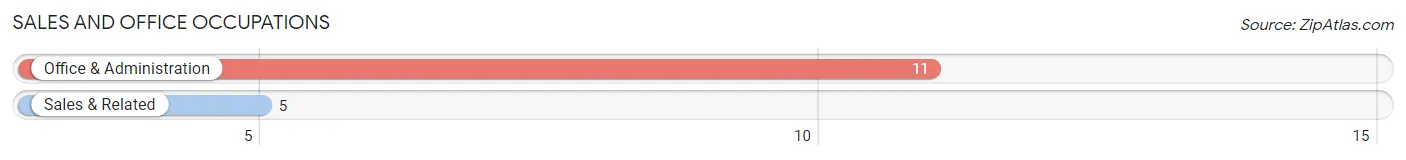
Sales and Office Occupations by Sex
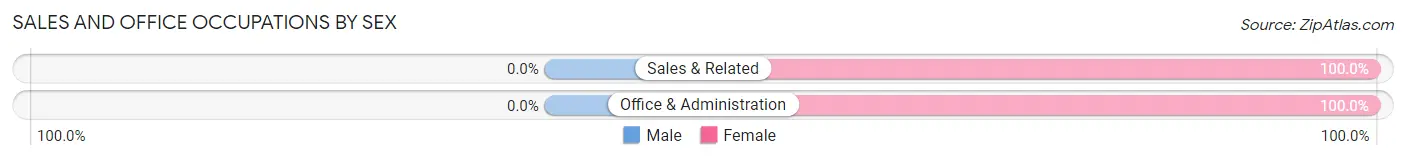
| Occupation | Male | Female |
| Sales & Related | 0 (0.0%) | 5 (100.0%) |
| Office & Administration | 0 (0.0%) | 11 (100.0%) |
| Total (Category) | 0 (0.0%) | 16 (100.0%) |
| Total (Overall) | 72 (57.1%) | 54 (42.9%) |
Natural Resources, Construction and Maintenance Occupations
The most common Natural Resources, Construction and Maintenance occupations in Noorvik are Construction & Extraction (32 | 25.4%), and Installation, Maintenance & Repair (7 | 5.6%).
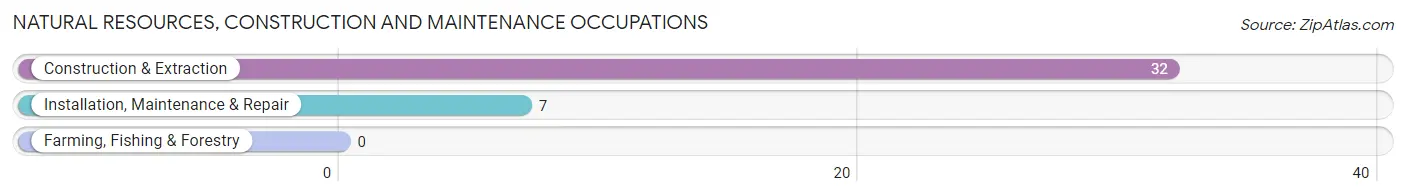
Natural Resources, Construction and Maintenance Occupations by Sex
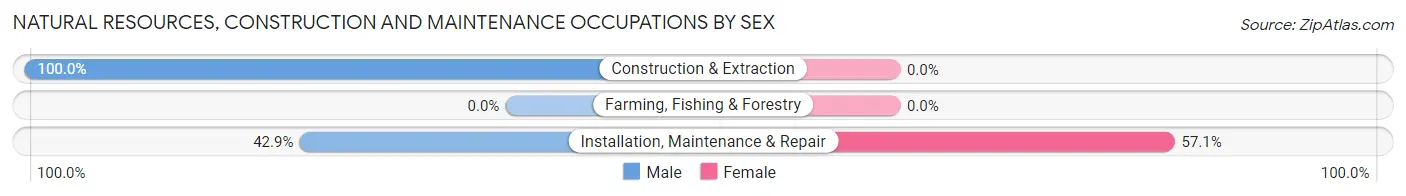
| Occupation | Male | Female |
| Farming, Fishing & Forestry | 0 (0.0%) | 0 (0.0%) |
| Construction & Extraction | 32 (100.0%) | 0 (0.0%) |
| Installation, Maintenance & Repair | 3 (42.9%) | 4 (57.1%) |
| Total (Category) | 35 (89.7%) | 4 (10.3%) |
| Total (Overall) | 72 (57.1%) | 54 (42.9%) |
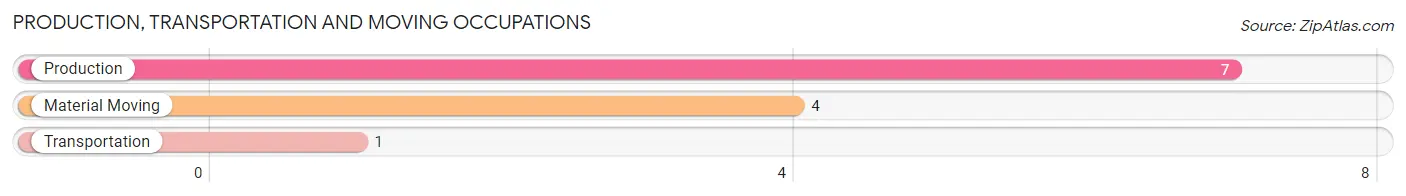
Production, Transportation and Moving Occupations
The most common Production, Transportation and Moving occupations in Noorvik are Production (7 | 5.6%), Material Moving (4 | 3.2%), and Transportation (1 | 0.8%).
Production, Transportation and Moving Occupations by Sex
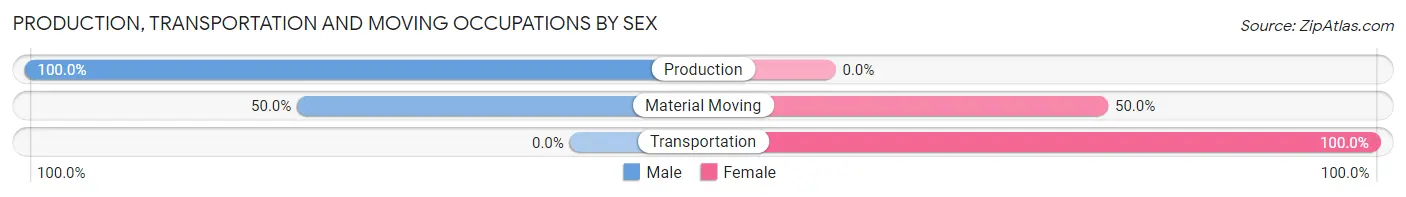
| Occupation | Male | Female |
| Production | 7 (100.0%) | 0 (0.0%) |
| Transportation | 0 (0.0%) | 1 (100.0%) |
| Material Moving | 2 (50.0%) | 2 (50.0%) |
| Total (Category) | 9 (75.0%) | 3 (25.0%) |
| Total (Overall) | 72 (57.1%) | 54 (42.9%) |
Employment Industries by Sex in Noorvik
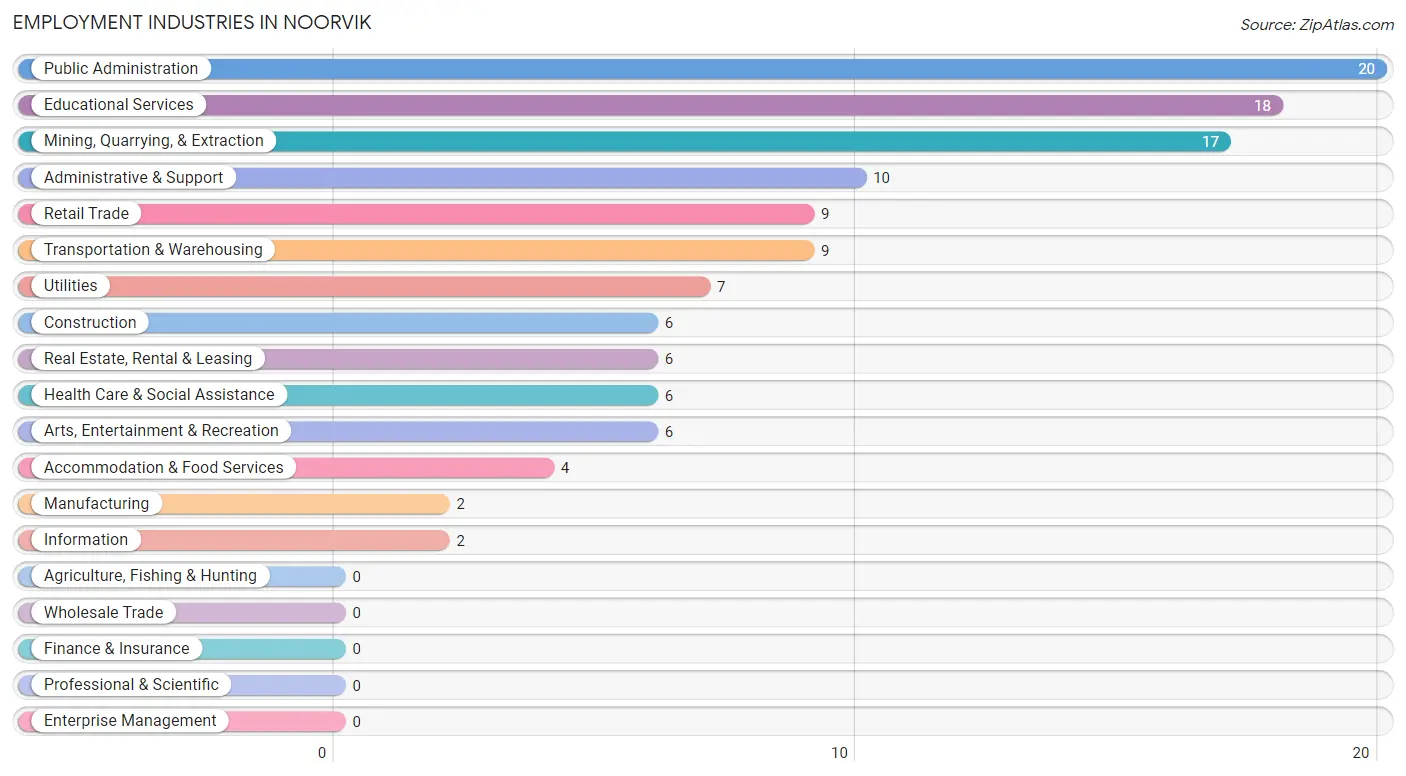
Employment Industries in Noorvik
The major employment industries in Noorvik include Public Administration (20 | 15.9%), Educational Services (18 | 14.3%), Mining, Quarrying, & Extraction (17 | 13.5%), Administrative & Support (10 | 7.9%), and Retail Trade (9 | 7.1%).
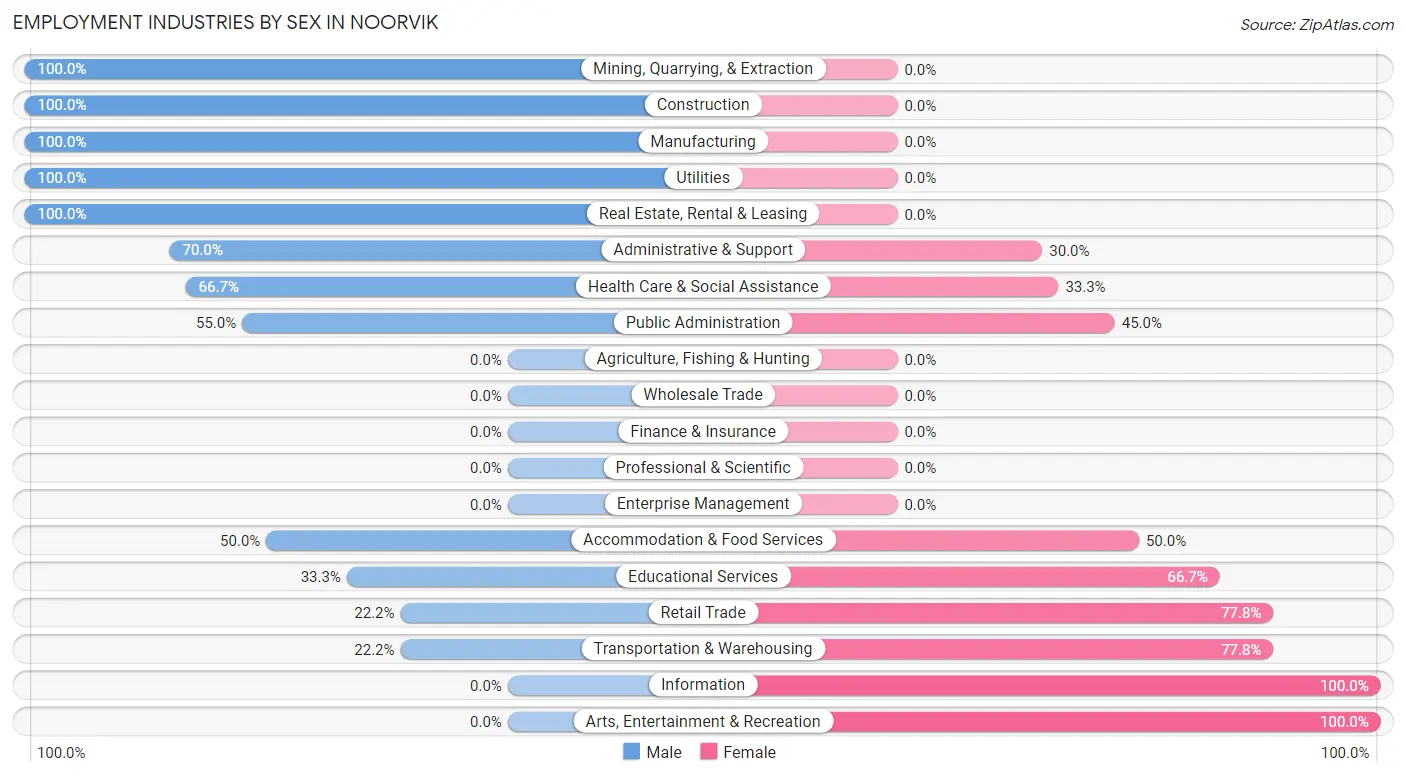
Employment Industries by Sex in Noorvik
The Noorvik industries that see more men than women are Mining, Quarrying, & Extraction (100.0%), Construction (100.0%), and Manufacturing (100.0%), whereas the industries that tend to have a higher number of women are Information (100.0%), Arts, Entertainment & Recreation (100.0%), and Retail Trade (77.8%).
| Industry | Male | Female |
| Agriculture, Fishing & Hunting | 0 (0.0%) | 0 (0.0%) |
| Mining, Quarrying, & Extraction | 17 (100.0%) | 0 (0.0%) |
| Construction | 6 (100.0%) | 0 (0.0%) |
| Manufacturing | 2 (100.0%) | 0 (0.0%) |
| Wholesale Trade | 0 (0.0%) | 0 (0.0%) |
| Retail Trade | 2 (22.2%) | 7 (77.8%) |
| Transportation & Warehousing | 2 (22.2%) | 7 (77.8%) |
| Utilities | 7 (100.0%) | 0 (0.0%) |
| Information | 0 (0.0%) | 2 (100.0%) |
| Finance & Insurance | 0 (0.0%) | 0 (0.0%) |
| Real Estate, Rental & Leasing | 6 (100.0%) | 0 (0.0%) |
| Professional & Scientific | 0 (0.0%) | 0 (0.0%) |
| Enterprise Management | 0 (0.0%) | 0 (0.0%) |
| Administrative & Support | 7 (70.0%) | 3 (30.0%) |
| Educational Services | 6 (33.3%) | 12 (66.7%) |
| Health Care & Social Assistance | 4 (66.7%) | 2 (33.3%) |
| Arts, Entertainment & Recreation | 0 (0.0%) | 6 (100.0%) |
| Accommodation & Food Services | 2 (50.0%) | 2 (50.0%) |
| Public Administration | 11 (55.0%) | 9 (45.0%) |
| Total | 72 (57.1%) | 54 (42.9%) |
Education in Noorvik
School Enrollment in Noorvik
The most common levels of schooling among the 198 students in Noorvik are elementary school (61 | 30.8%), high school (57 | 28.8%), and middle school (56 | 28.3%).
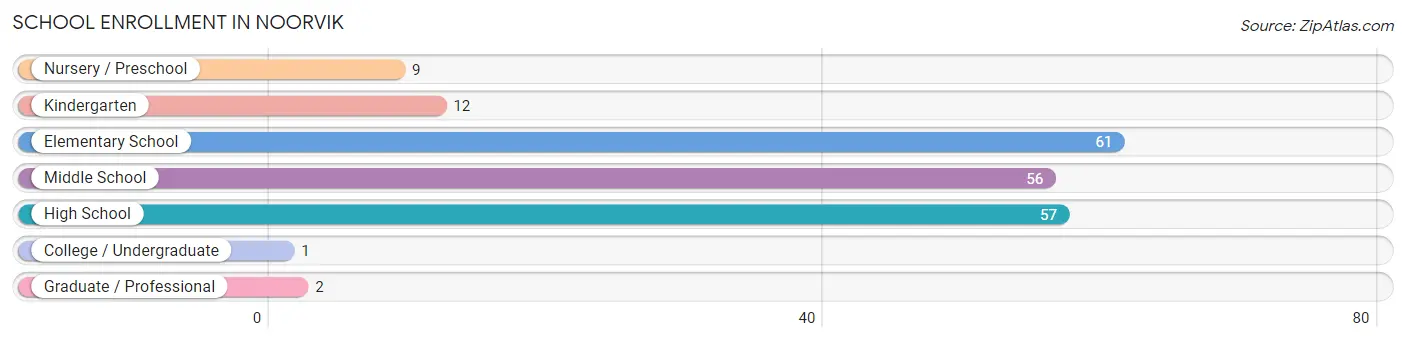
| School Level | # Students | % Students |
| Nursery / Preschool | 9 | 4.5% |
| Kindergarten | 12 | 6.1% |
| Elementary School | 61 | 30.8% |
| Middle School | 56 | 28.3% |
| High School | 57 | 28.8% |
| College / Undergraduate | 1 | 0.5% |
| Graduate / Professional | 2 | 1.0% |
| Total | 198 | 100.0% |
School Enrollment by Age by Funding Source in Noorvik
Out of a total of 198 students who are enrolled in schools in Noorvik, 7 (3.5%) attend a private institution, while the remaining 191 (96.5%) are enrolled in public schools. The age group of 20 to 24 year olds has the highest likelihood of being enrolled in private schools, with 2 (100.0% in the age bracket) enrolled. Conversely, the age group of 3 to 4 year olds has the lowest likelihood of being enrolled in a private school, with 9 (100.0% in the age bracket) attending a public institution.
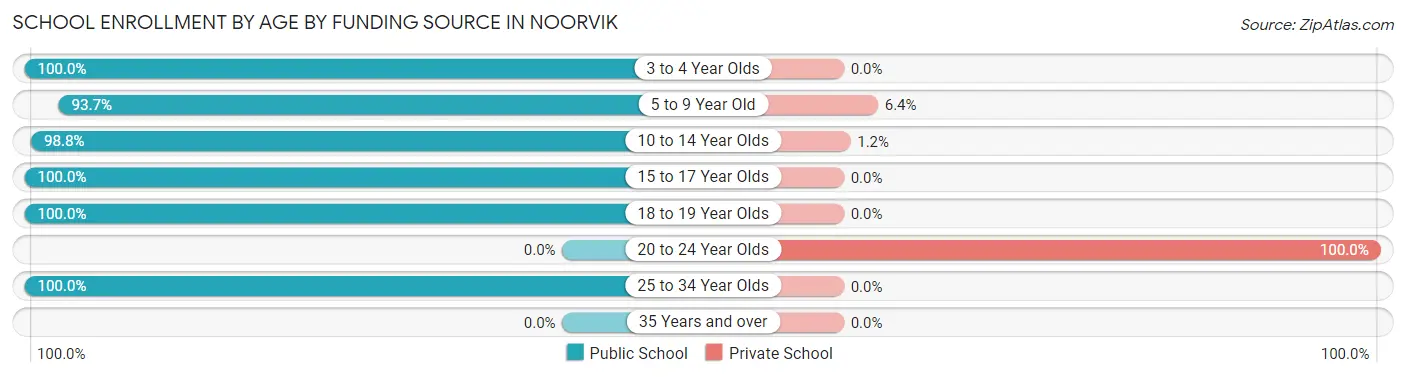
| Age Bracket | Public School | Private School |
| 3 to 4 Year Olds | 9 (100.0%) | 0 (0.0%) |
| 5 to 9 Year Old | 59 (93.6%) | 4 (6.4%) |
| 10 to 14 Year Olds | 80 (98.8%) | 1 (1.2%) |
| 15 to 17 Year Olds | 38 (100.0%) | 0 (0.0%) |
| 18 to 19 Year Olds | 4 (100.0%) | 0 (0.0%) |
| 20 to 24 Year Olds | 0 (0.0%) | 2 (100.0%) |
| 25 to 34 Year Olds | 1 (100.0%) | 0 (0.0%) |
| 35 Years and over | 0 (0.0%) | 0 (0.0%) |
| Total | 191 (96.5%) | 7 (3.5%) |
Educational Attainment by Field of Study in Noorvik
Computers & mathematics (3 | 21.4%), psychology (3 | 21.4%), science & technology (3 | 21.4%), education (3 | 21.4%), and business (1 | 7.1%) are the most common fields of study among 14 individuals in Noorvik who have obtained a bachelor's degree or higher.
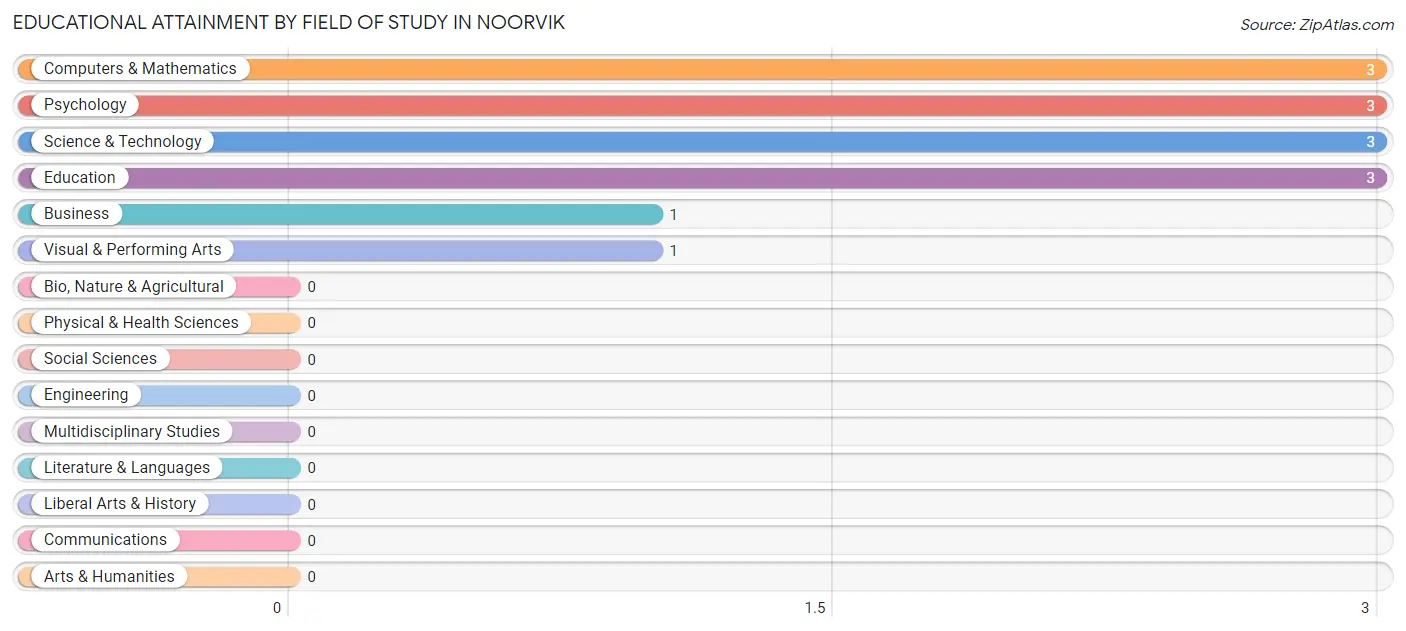
| Field of Study | # Graduates | % Graduates |
| Computers & Mathematics | 3 | 21.4% |
| Bio, Nature & Agricultural | 0 | 0.0% |
| Physical & Health Sciences | 0 | 0.0% |
| Psychology | 3 | 21.4% |
| Social Sciences | 0 | 0.0% |
| Engineering | 0 | 0.0% |
| Multidisciplinary Studies | 0 | 0.0% |
| Science & Technology | 3 | 21.4% |
| Business | 1 | 7.1% |
| Education | 3 | 21.4% |
| Literature & Languages | 0 | 0.0% |
| Liberal Arts & History | 0 | 0.0% |
| Visual & Performing Arts | 1 | 7.1% |
| Communications | 0 | 0.0% |
| Arts & Humanities | 0 | 0.0% |
| Total | 14 | 100.0% |
Transportation & Commute in Noorvik
Vehicle Availability by Sex in Noorvik
The most prevalent vehicle ownership categories in Noorvik are males with no vehicle (33, accounting for 55.0%) and females with no vehicle (11, making up 67.3%).
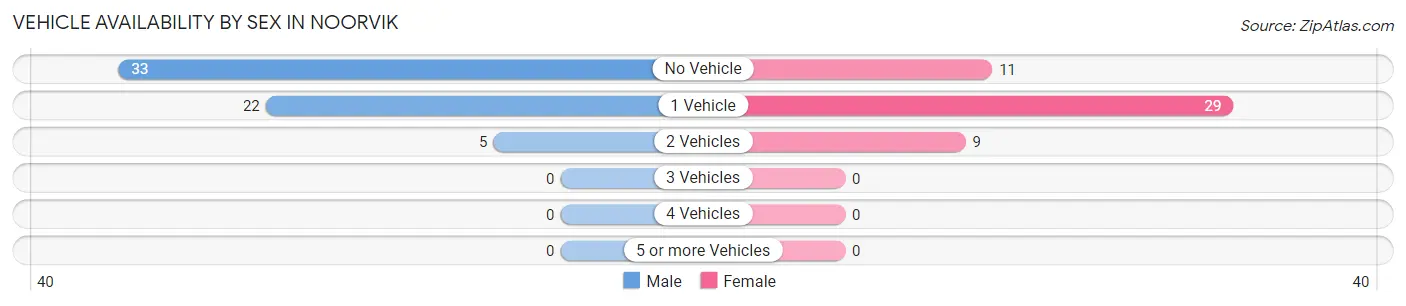
| Vehicles Available | Male | Female |
| No Vehicle | 33 (55.0%) | 11 (22.5%) |
| 1 Vehicle | 22 (36.7%) | 29 (59.2%) |
| 2 Vehicles | 5 (8.3%) | 9 (18.4%) |
| 3 Vehicles | 0 (0.0%) | 0 (0.0%) |
| 4 Vehicles | 0 (0.0%) | 0 (0.0%) |
| 5 or more Vehicles | 0 (0.0%) | 0 (0.0%) |
| Total | 60 (100.0%) | 49 (100.0%) |
Commute Time in Noorvik
The most frequently occuring commute durations in Noorvik are less than 5 minutes (48 commuters, 46.6%), 5 to 9 minutes (34 commuters, 33.0%), and 10 to 14 minutes (10 commuters, 9.7%).
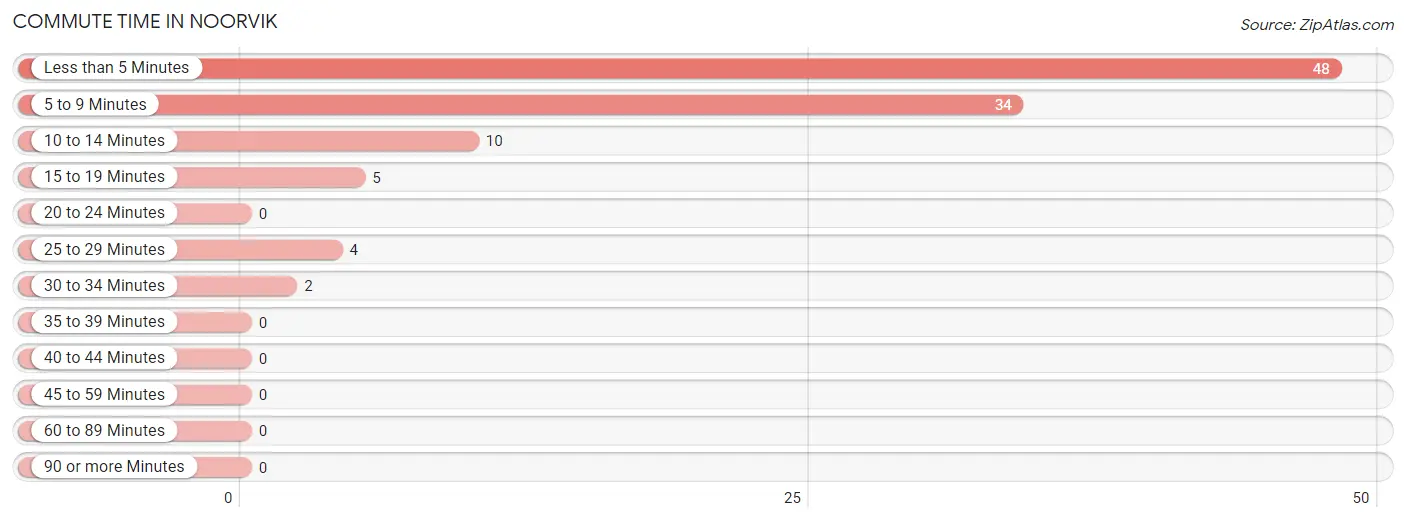
| Commute Time | # Commuters | % Commuters |
| Less than 5 Minutes | 48 | 46.6% |
| 5 to 9 Minutes | 34 | 33.0% |
| 10 to 14 Minutes | 10 | 9.7% |
| 15 to 19 Minutes | 5 | 4.9% |
| 20 to 24 Minutes | 0 | 0.0% |
| 25 to 29 Minutes | 4 | 3.9% |
| 30 to 34 Minutes | 2 | 1.9% |
| 35 to 39 Minutes | 0 | 0.0% |
| 40 to 44 Minutes | 0 | 0.0% |
| 45 to 59 Minutes | 0 | 0.0% |
| 60 to 89 Minutes | 0 | 0.0% |
| 90 or more Minutes | 0 | 0.0% |
Commute Time by Sex in Noorvik
The most common commute times in Noorvik are less than 5 minutes (25 commuters, 41.7%) for males and less than 5 minutes (23 commuters, 53.5%) for females.
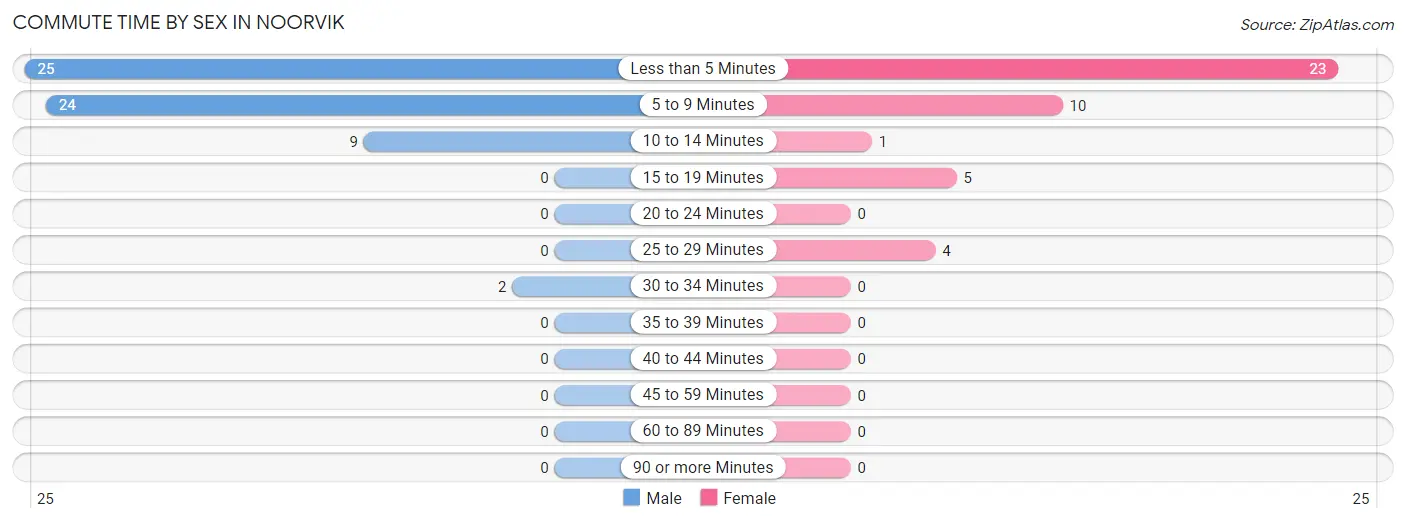
| Commute Time | Male | Female |
| Less than 5 Minutes | 25 (41.7%) | 23 (53.5%) |
| 5 to 9 Minutes | 24 (40.0%) | 10 (23.3%) |
| 10 to 14 Minutes | 9 (15.0%) | 1 (2.3%) |
| 15 to 19 Minutes | 0 (0.0%) | 5 (11.6%) |
| 20 to 24 Minutes | 0 (0.0%) | 0 (0.0%) |
| 25 to 29 Minutes | 0 (0.0%) | 4 (9.3%) |
| 30 to 34 Minutes | 2 (3.3%) | 0 (0.0%) |
| 35 to 39 Minutes | 0 (0.0%) | 0 (0.0%) |
| 40 to 44 Minutes | 0 (0.0%) | 0 (0.0%) |
| 45 to 59 Minutes | 0 (0.0%) | 0 (0.0%) |
| 60 to 89 Minutes | 0 (0.0%) | 0 (0.0%) |
| 90 or more Minutes | 0 (0.0%) | 0 (0.0%) |
Time of Departure to Work by Sex in Noorvik
The most frequent times of departure to work in Noorvik are 7:30 AM to 7:59 AM (20, 33.3%) for males and 7:30 AM to 7:59 AM (21, 48.8%) for females.
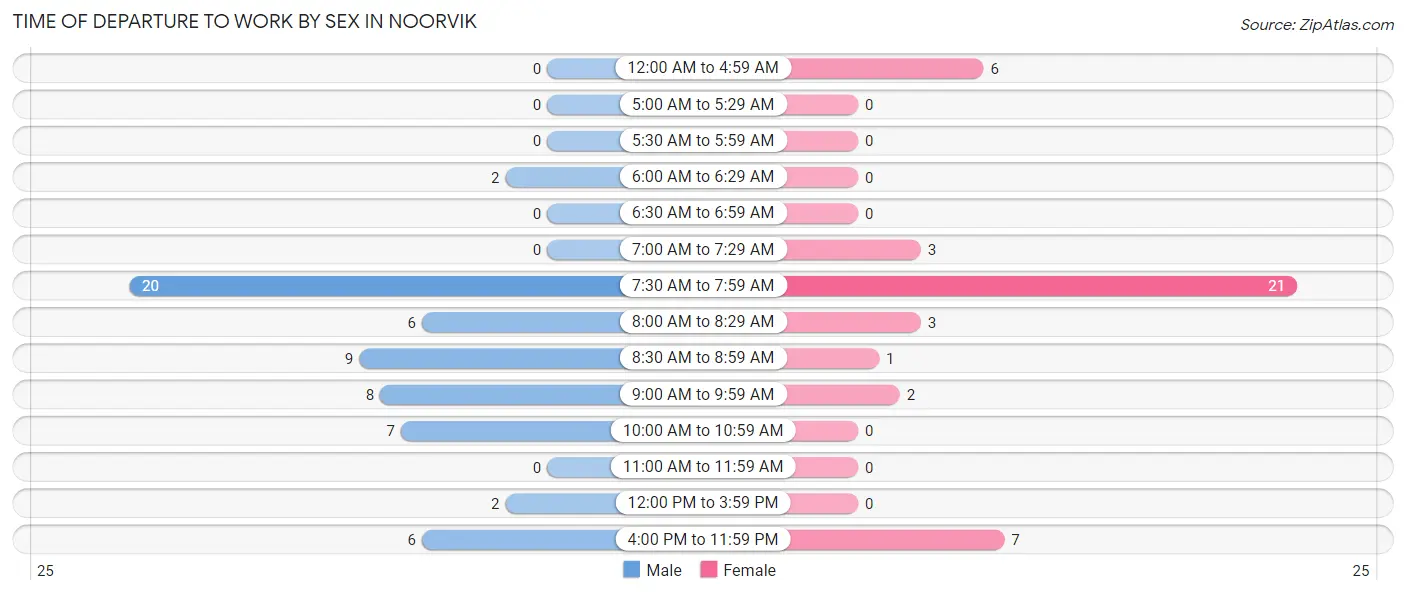
| Time of Departure | Male | Female |
| 12:00 AM to 4:59 AM | 0 (0.0%) | 6 (14.0%) |
| 5:00 AM to 5:29 AM | 0 (0.0%) | 0 (0.0%) |
| 5:30 AM to 5:59 AM | 0 (0.0%) | 0 (0.0%) |
| 6:00 AM to 6:29 AM | 2 (3.3%) | 0 (0.0%) |
| 6:30 AM to 6:59 AM | 0 (0.0%) | 0 (0.0%) |
| 7:00 AM to 7:29 AM | 0 (0.0%) | 3 (7.0%) |
| 7:30 AM to 7:59 AM | 20 (33.3%) | 21 (48.8%) |
| 8:00 AM to 8:29 AM | 6 (10.0%) | 3 (7.0%) |
| 8:30 AM to 8:59 AM | 9 (15.0%) | 1 (2.3%) |
| 9:00 AM to 9:59 AM | 8 (13.3%) | 2 (4.6%) |
| 10:00 AM to 10:59 AM | 7 (11.7%) | 0 (0.0%) |
| 11:00 AM to 11:59 AM | 0 (0.0%) | 0 (0.0%) |
| 12:00 PM to 3:59 PM | 2 (3.3%) | 0 (0.0%) |
| 4:00 PM to 11:59 PM | 6 (10.0%) | 7 (16.3%) |
| Total | 60 (100.0%) | 43 (100.0%) |
Housing Occupancy in Noorvik
Occupancy by Ownership in Noorvik
Of the total 120 dwellings in Noorvik, owner-occupied units account for 74 (61.7%), while renter-occupied units make up 46 (38.3%).
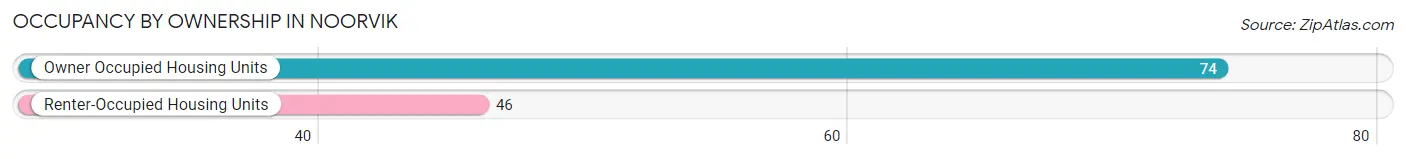
| Occupancy | # Housing Units | % Housing Units |
| Owner Occupied Housing Units | 74 | 61.7% |
| Renter-Occupied Housing Units | 46 | 38.3% |
| Total Occupied Housing Units | 120 | 100.0% |
Occupancy by Household Size in Noorvik
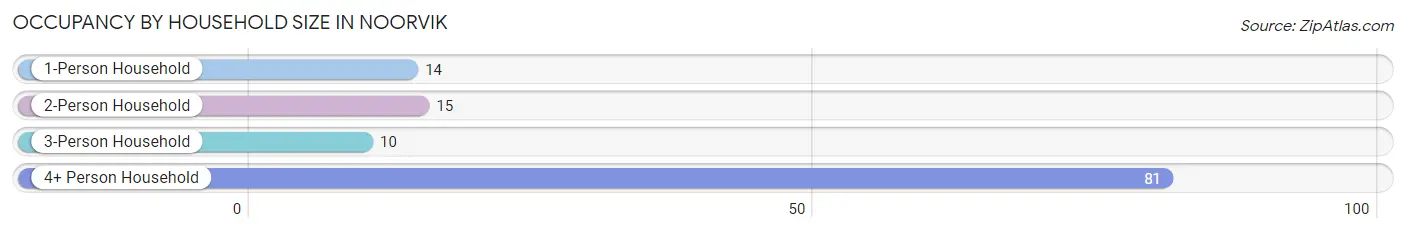
| Household Size | # Housing Units | % Housing Units |
| 1-Person Household | 14 | 11.7% |
| 2-Person Household | 15 | 12.5% |
| 3-Person Household | 10 | 8.3% |
| 4+ Person Household | 81 | 67.5% |
| Total Housing Units | 120 | 100.0% |
Occupancy by Ownership by Household Size in Noorvik
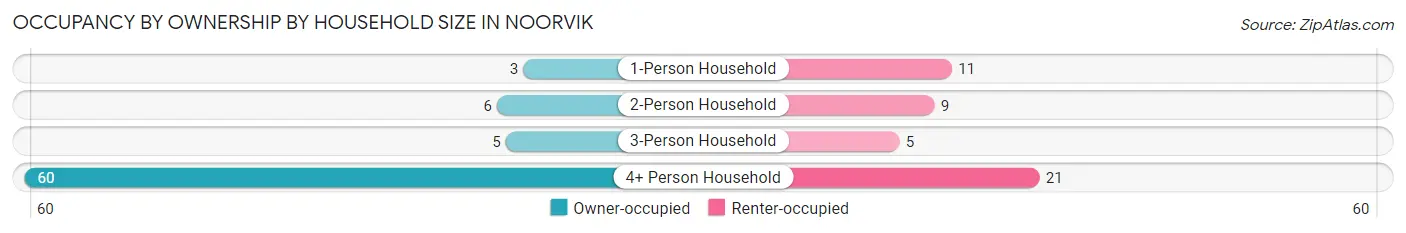
| Household Size | Owner-occupied | Renter-occupied |
| 1-Person Household | 3 (21.4%) | 11 (78.6%) |
| 2-Person Household | 6 (40.0%) | 9 (60.0%) |
| 3-Person Household | 5 (50.0%) | 5 (50.0%) |
| 4+ Person Household | 60 (74.1%) | 21 (25.9%) |
| Total Housing Units | 74 (61.7%) | 46 (38.3%) |
Occupancy by Educational Attainment in Noorvik
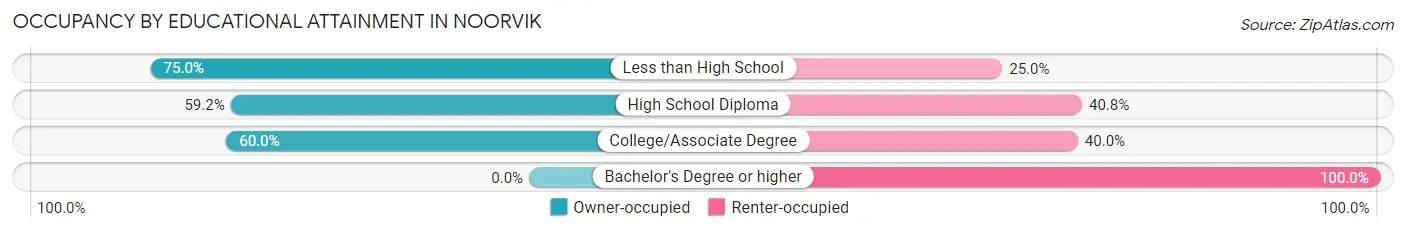
| Household Size | Owner-occupied | Renter-occupied |
| Less than High School | 30 (75.0%) | 10 (25.0%) |
| High School Diploma | 29 (59.2%) | 20 (40.8%) |
| College/Associate Degree | 15 (60.0%) | 10 (40.0%) |
| Bachelor's Degree or higher | 0 (0.0%) | 6 (100.0%) |
Occupancy by Age of Householder in Noorvik
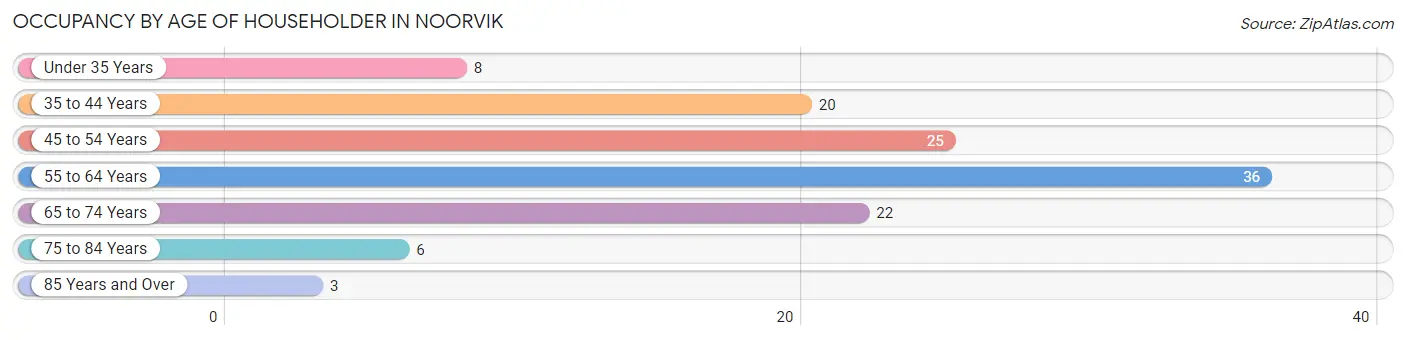
| Age Bracket | # Households | % Households |
| Under 35 Years | 8 | 6.7% |
| 35 to 44 Years | 20 | 16.7% |
| 45 to 54 Years | 25 | 20.8% |
| 55 to 64 Years | 36 | 30.0% |
| 65 to 74 Years | 22 | 18.3% |
| 75 to 84 Years | 6 | 5.0% |
| 85 Years and Over | 3 | 2.5% |
| Total | 120 | 100.0% |
Housing Finances in Noorvik
Median Income by Occupancy in Noorvik
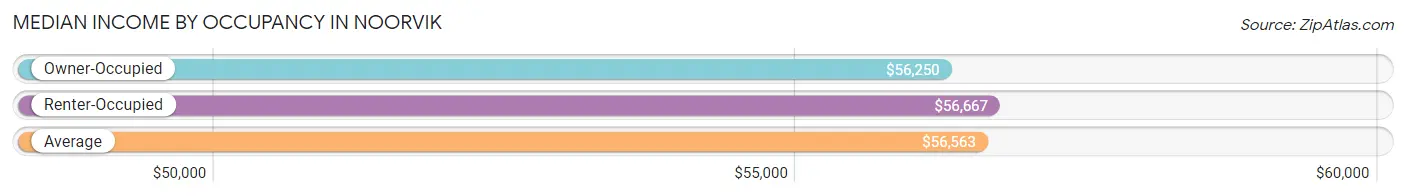
| Occupancy Type | # Households | Median Income |
| Owner-Occupied | 74 (61.7%) | $56,250 |
| Renter-Occupied | 46 (38.3%) | $56,667 |
| Average | 120 (100.0%) | $56,563 |
Occupancy by Householder Income Bracket in Noorvik
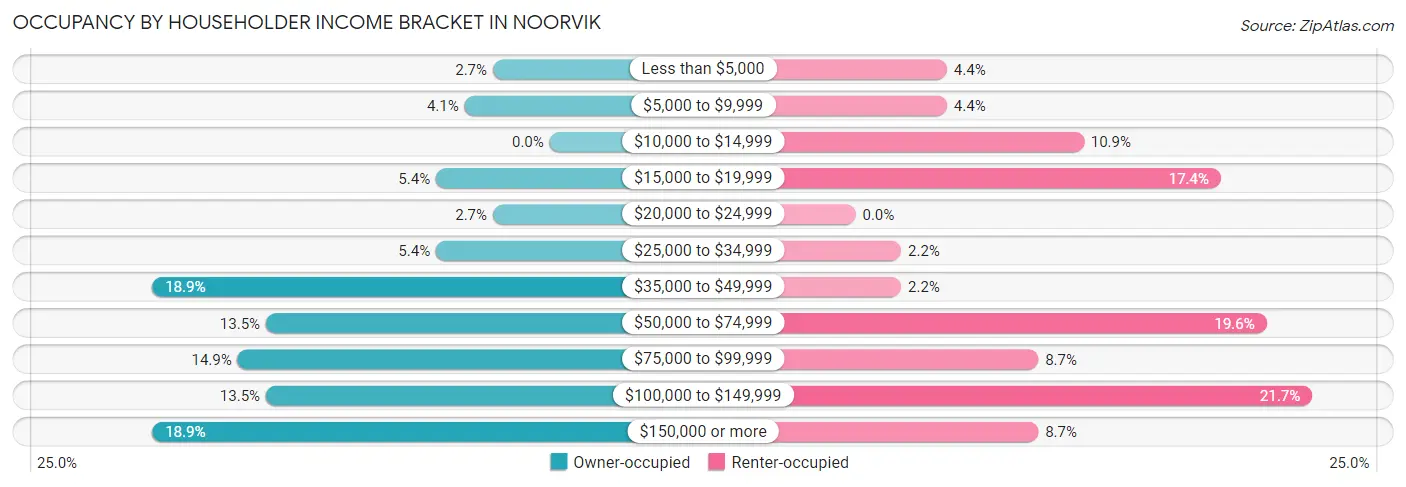
| Income Bracket | Owner-occupied | Renter-occupied |
| Less than $5,000 | 2 (2.7%) | 2 (4.3%) |
| $5,000 to $9,999 | 3 (4.1%) | 2 (4.3%) |
| $10,000 to $14,999 | 0 (0.0%) | 5 (10.9%) |
| $15,000 to $19,999 | 4 (5.4%) | 8 (17.4%) |
| $20,000 to $24,999 | 2 (2.7%) | 0 (0.0%) |
| $25,000 to $34,999 | 4 (5.4%) | 1 (2.2%) |
| $35,000 to $49,999 | 14 (18.9%) | 1 (2.2%) |
| $50,000 to $74,999 | 10 (13.5%) | 9 (19.6%) |
| $75,000 to $99,999 | 11 (14.9%) | 4 (8.7%) |
| $100,000 to $149,999 | 10 (13.5%) | 10 (21.7%) |
| $150,000 or more | 14 (18.9%) | 4 (8.7%) |
| Total | 74 (100.0%) | 46 (100.0%) |
Monthly Housing Cost Tiers in Noorvik
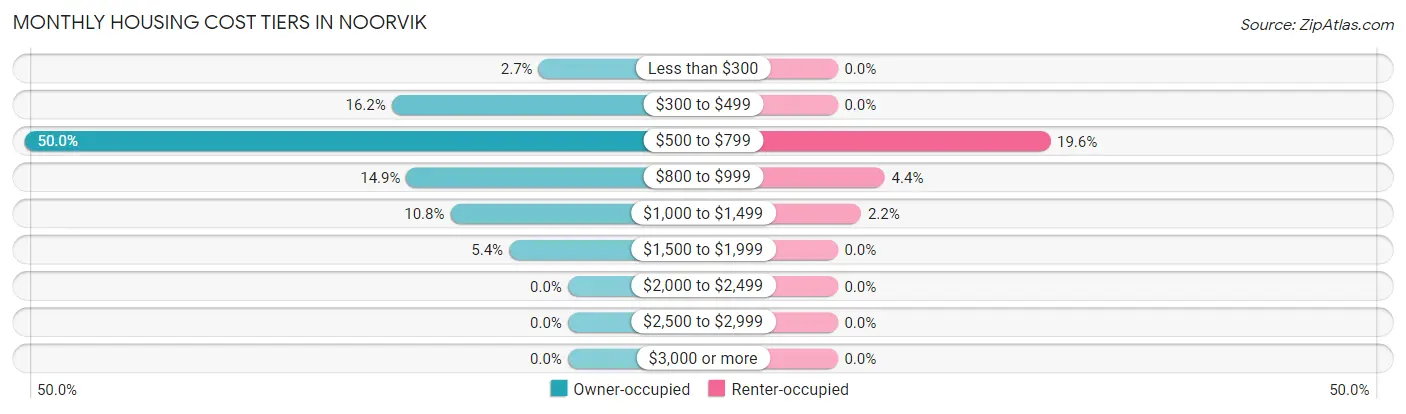
| Monthly Cost | Owner-occupied | Renter-occupied |
| Less than $300 | 2 (2.7%) | 0 (0.0%) |
| $300 to $499 | 12 (16.2%) | 0 (0.0%) |
| $500 to $799 | 37 (50.0%) | 9 (19.6%) |
| $800 to $999 | 11 (14.9%) | 2 (4.3%) |
| $1,000 to $1,499 | 8 (10.8%) | 1 (2.2%) |
| $1,500 to $1,999 | 4 (5.4%) | 0 (0.0%) |
| $2,000 to $2,499 | 0 (0.0%) | 0 (0.0%) |
| $2,500 to $2,999 | 0 (0.0%) | 0 (0.0%) |
| $3,000 or more | 0 (0.0%) | 0 (0.0%) |
| Total | 74 (100.0%) | 46 (100.0%) |
Physical Housing Characteristics in Noorvik
Housing Structures in Noorvik
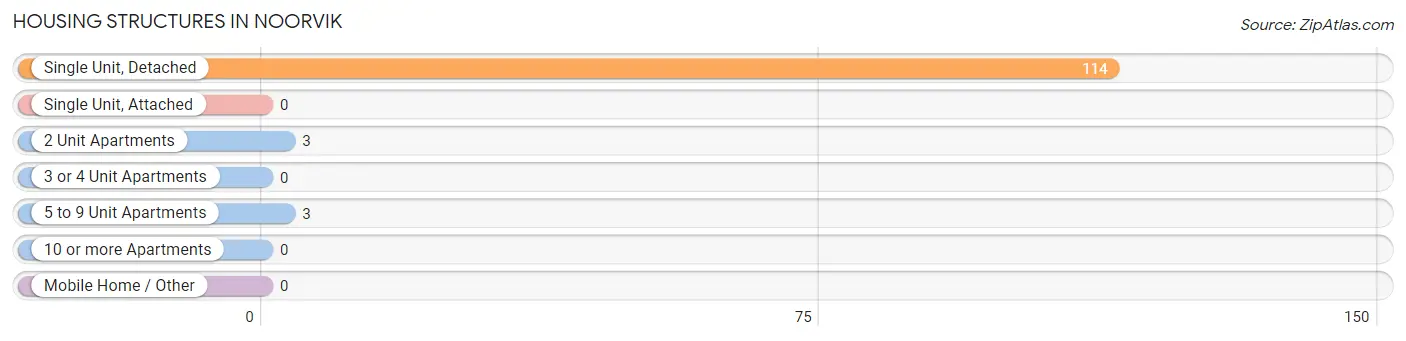
| Structure Type | # Housing Units | % Housing Units |
| Single Unit, Detached | 114 | 95.0% |
| Single Unit, Attached | 0 | 0.0% |
| 2 Unit Apartments | 3 | 2.5% |
| 3 or 4 Unit Apartments | 0 | 0.0% |
| 5 to 9 Unit Apartments | 3 | 2.5% |
| 10 or more Apartments | 0 | 0.0% |
| Mobile Home / Other | 0 | 0.0% |
| Total | 120 | 100.0% |
Housing Structures by Occupancy in Noorvik
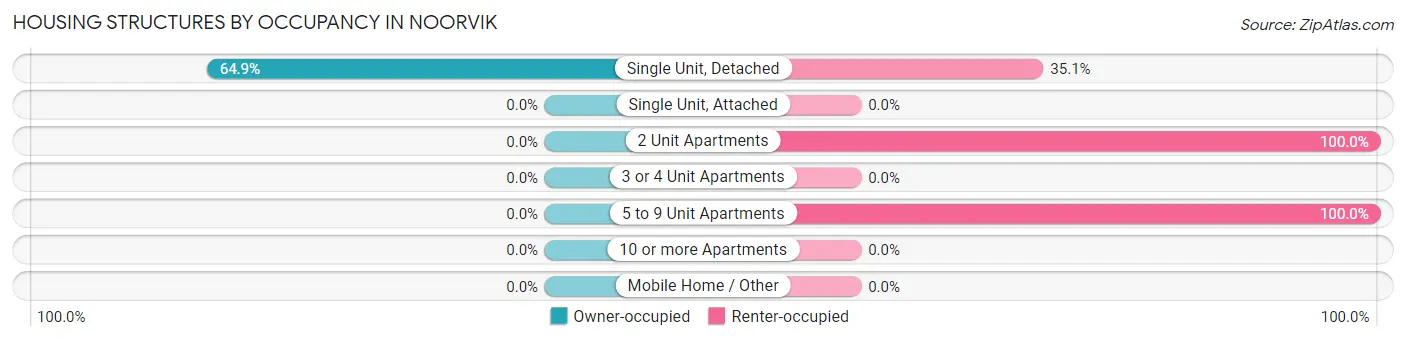
| Structure Type | Owner-occupied | Renter-occupied |
| Single Unit, Detached | 74 (64.9%) | 40 (35.1%) |
| Single Unit, Attached | 0 (0.0%) | 0 (0.0%) |
| 2 Unit Apartments | 0 (0.0%) | 3 (100.0%) |
| 3 or 4 Unit Apartments | 0 (0.0%) | 0 (0.0%) |
| 5 to 9 Unit Apartments | 0 (0.0%) | 3 (100.0%) |
| 10 or more Apartments | 0 (0.0%) | 0 (0.0%) |
| Mobile Home / Other | 0 (0.0%) | 0 (0.0%) |
| Total | 74 (61.7%) | 46 (38.3%) |
Housing Structures by Number of Rooms in Noorvik
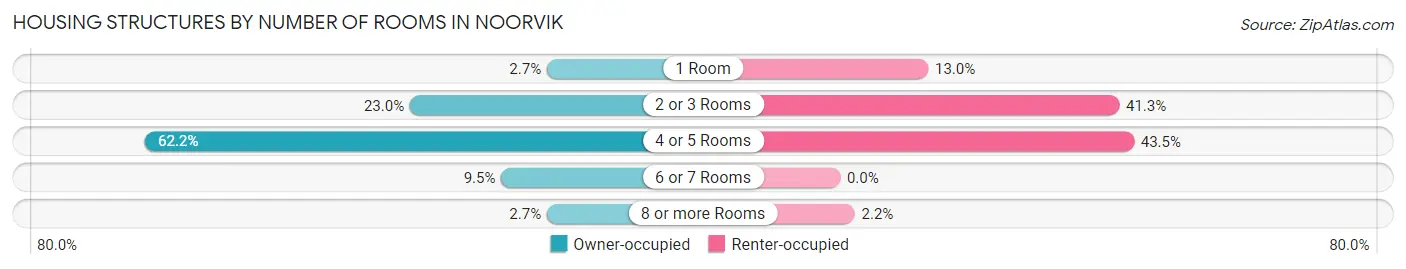
| Number of Rooms | Owner-occupied | Renter-occupied |
| 1 Room | 2 (2.7%) | 6 (13.0%) |
| 2 or 3 Rooms | 17 (23.0%) | 19 (41.3%) |
| 4 or 5 Rooms | 46 (62.2%) | 20 (43.5%) |
| 6 or 7 Rooms | 7 (9.5%) | 0 (0.0%) |
| 8 or more Rooms | 2 (2.7%) | 1 (2.2%) |
| Total | 74 (100.0%) | 46 (100.0%) |
Housing Structure by Heating Type in Noorvik
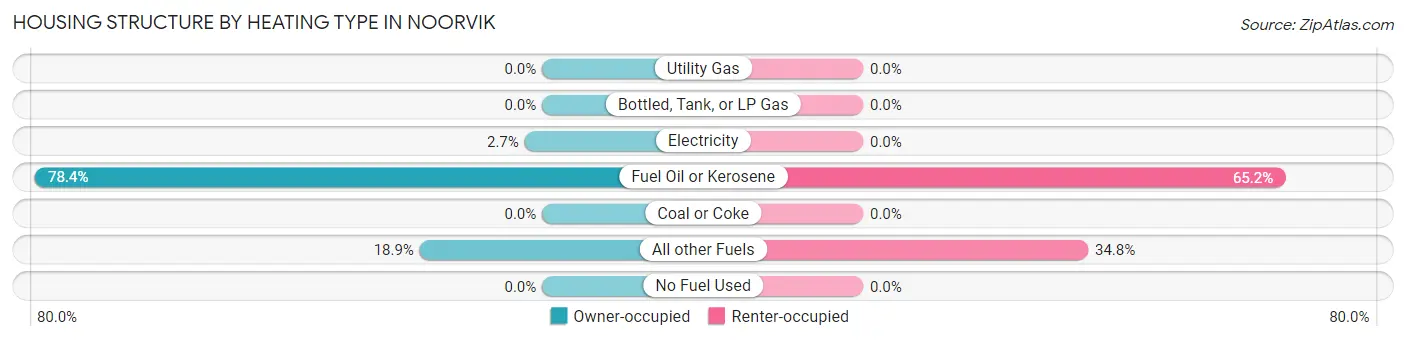
| Heating Type | Owner-occupied | Renter-occupied |
| Utility Gas | 0 (0.0%) | 0 (0.0%) |
| Bottled, Tank, or LP Gas | 0 (0.0%) | 0 (0.0%) |
| Electricity | 2 (2.7%) | 0 (0.0%) |
| Fuel Oil or Kerosene | 58 (78.4%) | 30 (65.2%) |
| Coal or Coke | 0 (0.0%) | 0 (0.0%) |
| All other Fuels | 14 (18.9%) | 16 (34.8%) |
| No Fuel Used | 0 (0.0%) | 0 (0.0%) |
| Total | 74 (100.0%) | 46 (100.0%) |
Household Vehicle Usage in Noorvik
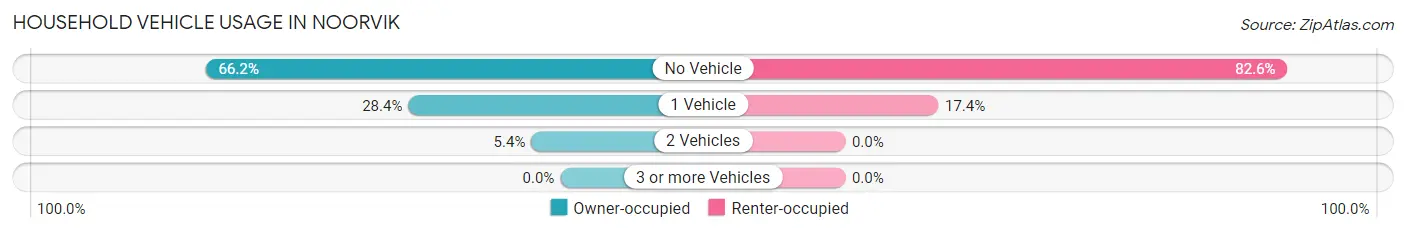
| Vehicles per Household | Owner-occupied | Renter-occupied |
| No Vehicle | 49 (66.2%) | 38 (82.6%) |
| 1 Vehicle | 21 (28.4%) | 8 (17.4%) |
| 2 Vehicles | 4 (5.4%) | 0 (0.0%) |
| 3 or more Vehicles | 0 (0.0%) | 0 (0.0%) |
| Total | 74 (100.0%) | 46 (100.0%) |
Real Estate & Mortgages in Noorvik
Real Estate and Mortgage Overview in Noorvik
| Characteristic | Without Mortgage | With Mortgage |
| Housing Units | 56 | 18 |
| Median Property Value | $95,700 | $165,000 |
| Median Household Income | $53,750 | $2 |
| Monthly Housing Costs | $622 | $0 |
| Real Estate Taxes | - | - |
Property Value by Mortgage Status in Noorvik
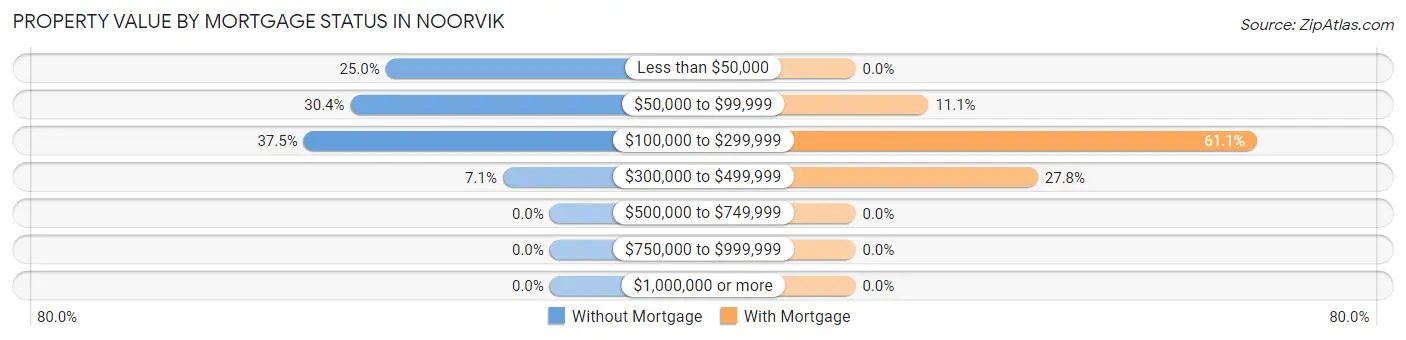
| Property Value | Without Mortgage | With Mortgage |
| Less than $50,000 | 14 (25.0%) | 0 (0.0%) |
| $50,000 to $99,999 | 17 (30.4%) | 2 (11.1%) |
| $100,000 to $299,999 | 21 (37.5%) | 11 (61.1%) |
| $300,000 to $499,999 | 4 (7.1%) | 5 (27.8%) |
| $500,000 to $749,999 | 0 (0.0%) | 0 (0.0%) |
| $750,000 to $999,999 | 0 (0.0%) | 0 (0.0%) |
| $1,000,000 or more | 0 (0.0%) | 0 (0.0%) |
| Total | 56 (100.0%) | 18 (100.0%) |
Household Income by Mortgage Status in Noorvik
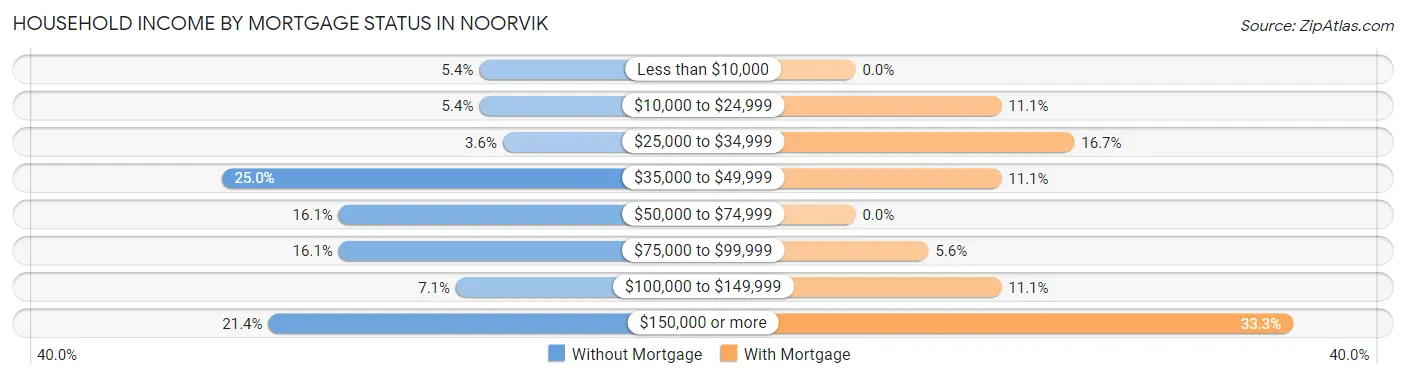
| Household Income | Without Mortgage | With Mortgage |
| Less than $10,000 | 3 (5.4%) | 0 (0.0%) |
| $10,000 to $24,999 | 3 (5.4%) | 2 (11.1%) |
| $25,000 to $34,999 | 2 (3.6%) | 3 (16.7%) |
| $35,000 to $49,999 | 14 (25.0%) | 2 (11.1%) |
| $50,000 to $74,999 | 9 (16.1%) | 0 (0.0%) |
| $75,000 to $99,999 | 9 (16.1%) | 1 (5.6%) |
| $100,000 to $149,999 | 4 (7.1%) | 2 (11.1%) |
| $150,000 or more | 12 (21.4%) | 6 (33.3%) |
| Total | 56 (100.0%) | 18 (100.0%) |
Property Value to Household Income Ratio in Noorvik
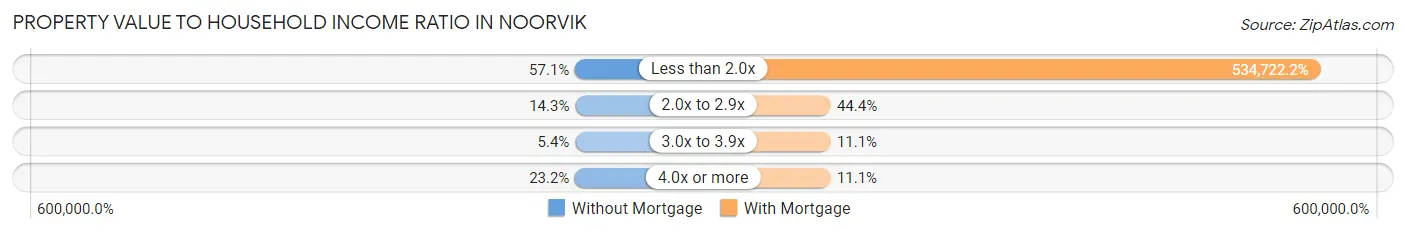
| Value-to-Income Ratio | Without Mortgage | With Mortgage |
| Less than 2.0x | 32 (57.1%) | 96,250 (534,722.2%) |
| 2.0x to 2.9x | 8 (14.3%) | 8 (44.4%) |
| 3.0x to 3.9x | 3 (5.4%) | 2 (11.1%) |
| 4.0x or more | 13 (23.2%) | 2 (11.1%) |
| Total | 56 (100.0%) | 18 (100.0%) |
Real Estate Taxes by Mortgage Status in Noorvik
| Property Taxes | Without Mortgage | With Mortgage |
| Less than $800 | 0 (0.0%) | 0 (0.0%) |
| $800 to $1,499 | 0 (0.0%) | 0 (0.0%) |
| $800 to $1,499 | 0 (0.0%) | 0 (0.0%) |
| Total | 56 (100.0%) | 18 (100.0%) |
Health & Disability in Noorvik
Health Insurance Coverage by Age in Noorvik
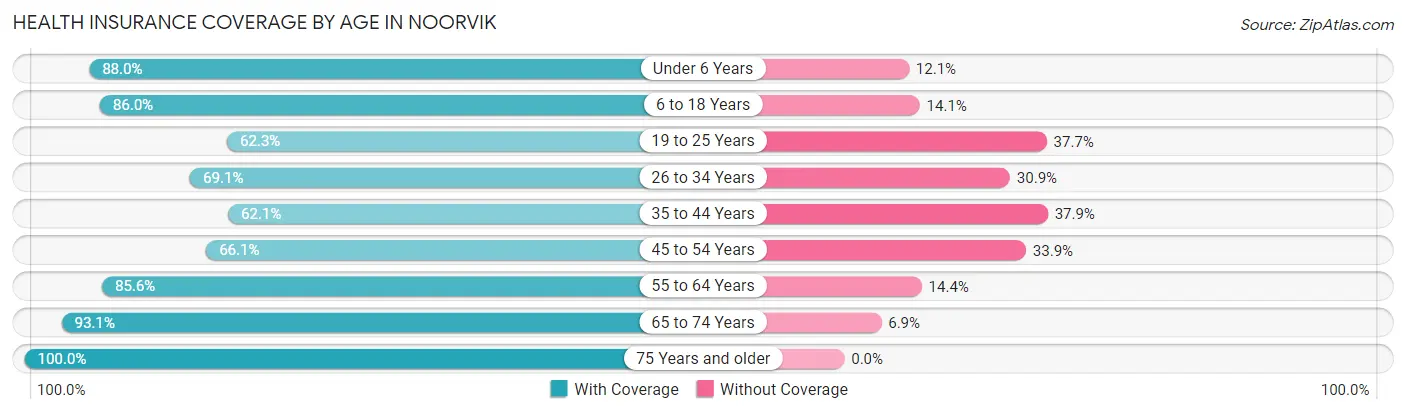
| Age Bracket | With Coverage | Without Coverage |
| Under 6 Years | 73 (87.9%) | 10 (12.0%) |
| 6 to 18 Years | 159 (86.0%) | 26 (14.1%) |
| 19 to 25 Years | 33 (62.3%) | 20 (37.7%) |
| 26 to 34 Years | 47 (69.1%) | 21 (30.9%) |
| 35 to 44 Years | 36 (62.1%) | 22 (37.9%) |
| 45 to 54 Years | 41 (66.1%) | 21 (33.9%) |
| 55 to 64 Years | 83 (85.6%) | 14 (14.4%) |
| 65 to 74 Years | 27 (93.1%) | 2 (6.9%) |
| 75 Years and older | 19 (100.0%) | 0 (0.0%) |
| Total | 518 (79.2%) | 136 (20.8%) |
Health Insurance Coverage by Citizenship Status in Noorvik
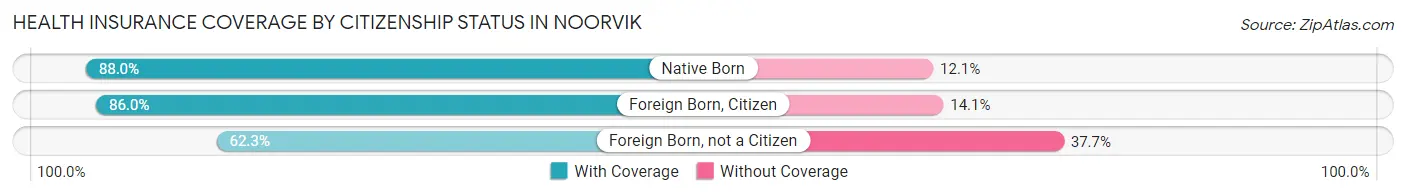
| Citizenship Status | With Coverage | Without Coverage |
| Native Born | 73 (87.9%) | 10 (12.0%) |
| Foreign Born, Citizen | 159 (86.0%) | 26 (14.1%) |
| Foreign Born, not a Citizen | 33 (62.3%) | 20 (37.7%) |
Health Insurance Coverage by Household Income in Noorvik
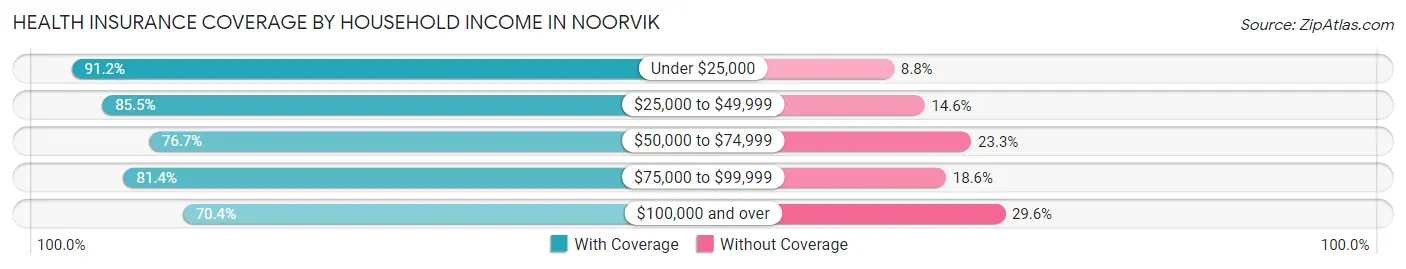
| Household Income | With Coverage | Without Coverage |
| Under $25,000 | 62 (91.2%) | 6 (8.8%) |
| $25,000 to $49,999 | 94 (85.5%) | 16 (14.5%) |
| $50,000 to $74,999 | 79 (76.7%) | 24 (23.3%) |
| $75,000 to $99,999 | 79 (81.4%) | 18 (18.6%) |
| $100,000 and over | 171 (70.4%) | 72 (29.6%) |
Public vs Private Health Insurance Coverage by Age in Noorvik
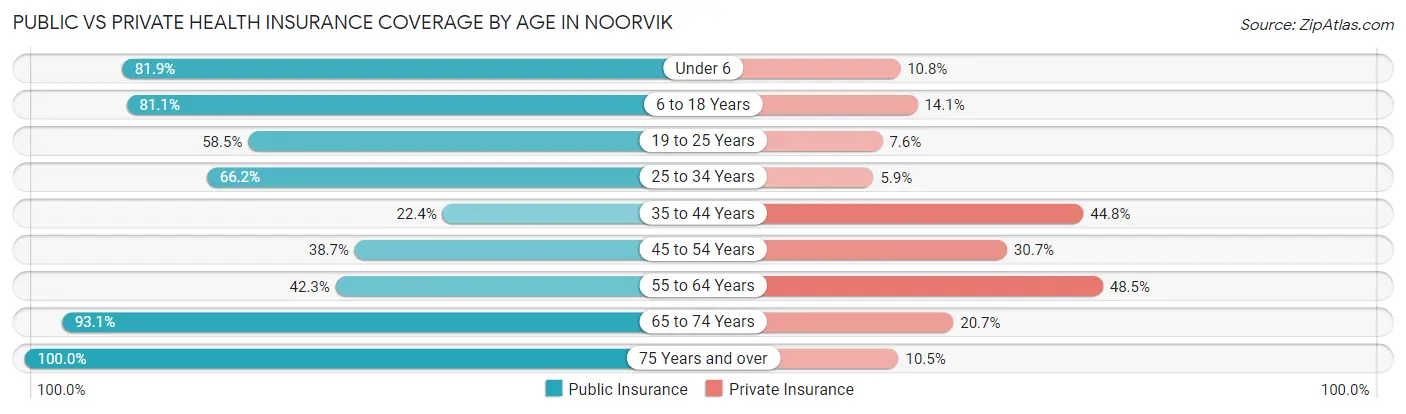
| Age Bracket | Public Insurance | Private Insurance |
| Under 6 | 68 (81.9%) | 9 (10.8%) |
| 6 to 18 Years | 150 (81.1%) | 26 (14.1%) |
| 19 to 25 Years | 31 (58.5%) | 4 (7.5%) |
| 25 to 34 Years | 45 (66.2%) | 4 (5.9%) |
| 35 to 44 Years | 13 (22.4%) | 26 (44.8%) |
| 45 to 54 Years | 24 (38.7%) | 19 (30.6%) |
| 55 to 64 Years | 41 (42.3%) | 47 (48.4%) |
| 65 to 74 Years | 27 (93.1%) | 6 (20.7%) |
| 75 Years and over | 19 (100.0%) | 2 (10.5%) |
| Total | 418 (63.9%) | 143 (21.9%) |
Disability Status by Sex by Age in Noorvik
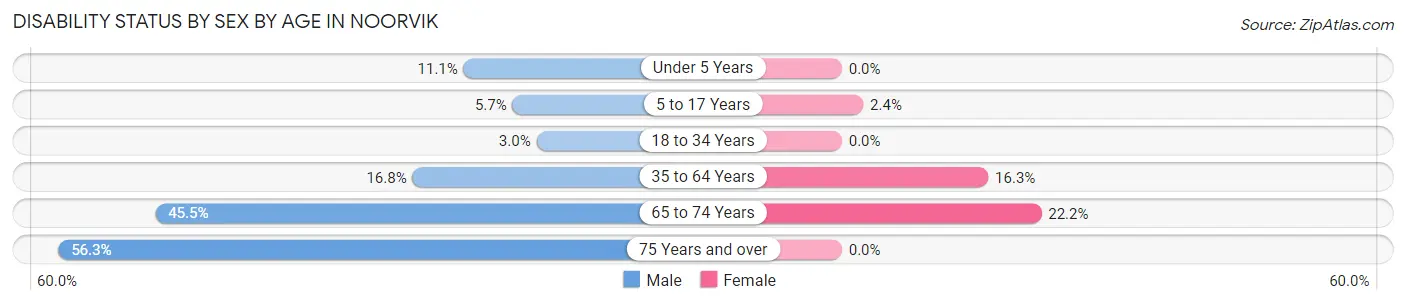
| Age Bracket | Male | Female |
| Under 5 Years | 4 (11.1%) | 0 (0.0%) |
| 5 to 17 Years | 6 (5.7%) | 2 (2.4%) |
| 18 to 34 Years | 2 (3.0%) | 0 (0.0%) |
| 35 to 64 Years | 21 (16.8%) | 15 (16.3%) |
| 65 to 74 Years | 5 (45.5%) | 4 (22.2%) |
| 75 Years and over | 9 (56.2%) | 0 (0.0%) |
Disability Class by Sex by Age in Noorvik
Disability Class: Hearing Difficulty
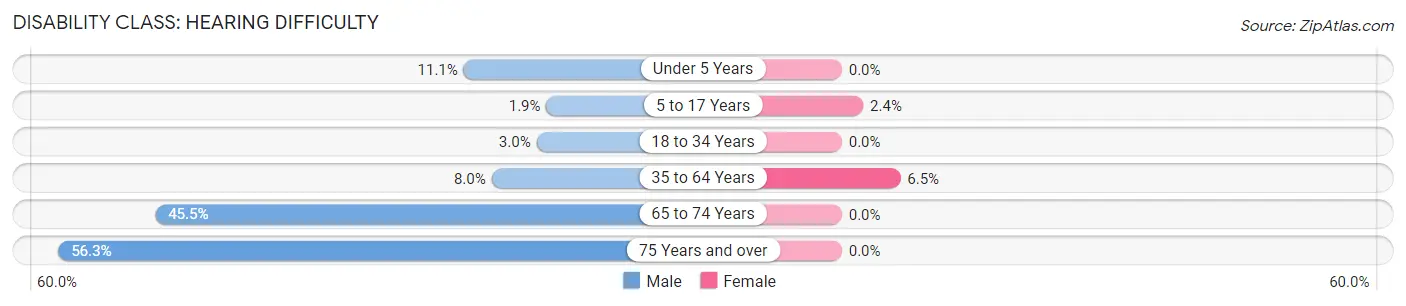
| Age Bracket | Male | Female |
| Under 5 Years | 4 (11.1%) | 0 (0.0%) |
| 5 to 17 Years | 2 (1.9%) | 2 (2.4%) |
| 18 to 34 Years | 2 (3.0%) | 0 (0.0%) |
| 35 to 64 Years | 10 (8.0%) | 6 (6.5%) |
| 65 to 74 Years | 5 (45.5%) | 0 (0.0%) |
| 75 Years and over | 9 (56.2%) | 0 (0.0%) |
Disability Class: Vision Difficulty
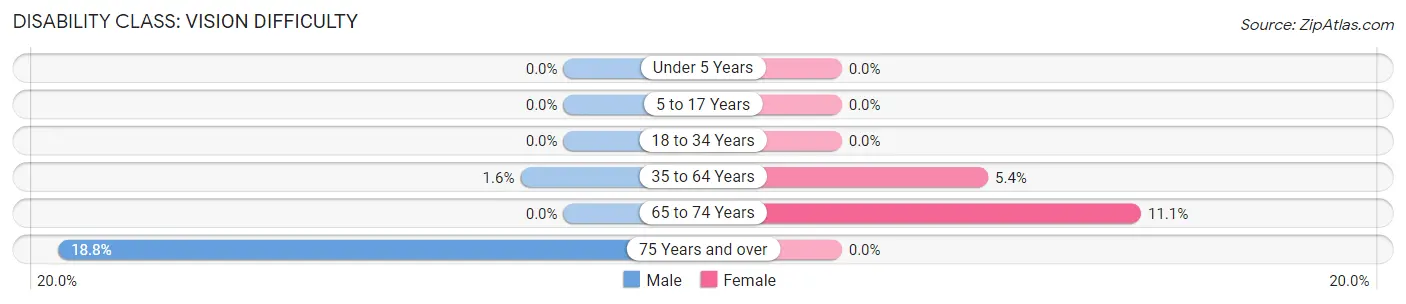
| Age Bracket | Male | Female |
| Under 5 Years | 0 (0.0%) | 0 (0.0%) |
| 5 to 17 Years | 0 (0.0%) | 0 (0.0%) |
| 18 to 34 Years | 0 (0.0%) | 0 (0.0%) |
| 35 to 64 Years | 2 (1.6%) | 5 (5.4%) |
| 65 to 74 Years | 0 (0.0%) | 2 (11.1%) |
| 75 Years and over | 3 (18.8%) | 0 (0.0%) |
Disability Class: Cognitive Difficulty
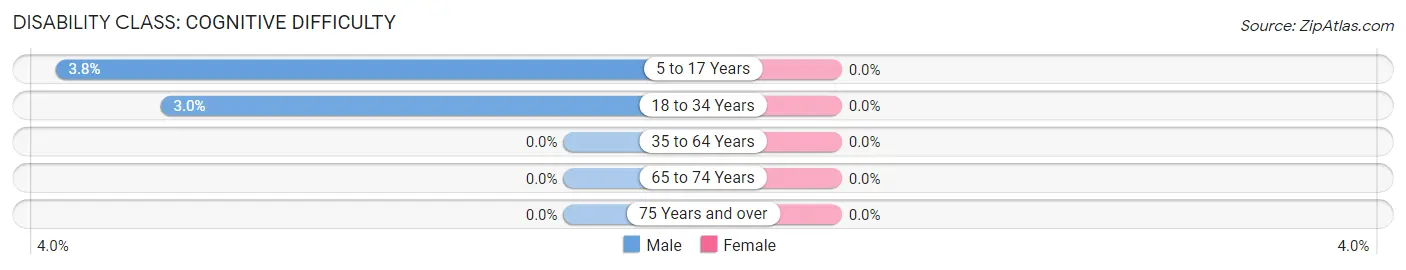
| Age Bracket | Male | Female |
| 5 to 17 Years | 4 (3.8%) | 0 (0.0%) |
| 18 to 34 Years | 2 (3.0%) | 0 (0.0%) |
| 35 to 64 Years | 0 (0.0%) | 0 (0.0%) |
| 65 to 74 Years | 0 (0.0%) | 0 (0.0%) |
| 75 Years and over | 0 (0.0%) | 0 (0.0%) |
Disability Class: Ambulatory Difficulty
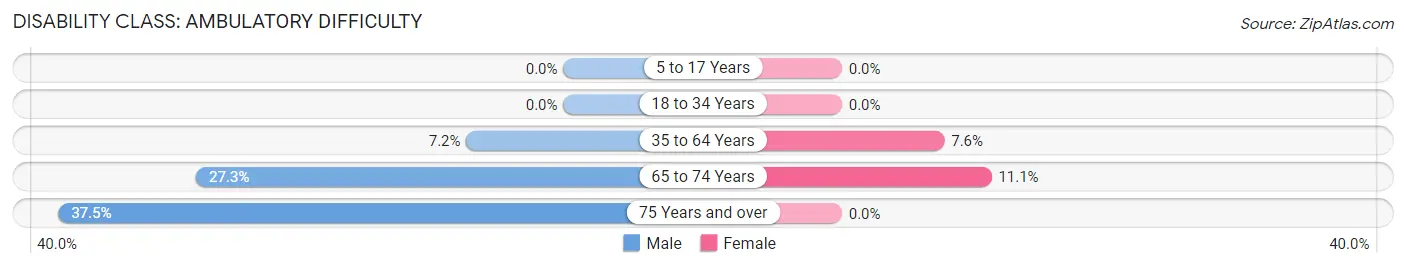
| Age Bracket | Male | Female |
| 5 to 17 Years | 0 (0.0%) | 0 (0.0%) |
| 18 to 34 Years | 0 (0.0%) | 0 (0.0%) |
| 35 to 64 Years | 9 (7.2%) | 7 (7.6%) |
| 65 to 74 Years | 3 (27.3%) | 2 (11.1%) |
| 75 Years and over | 6 (37.5%) | 0 (0.0%) |
Disability Class: Self-Care Difficulty
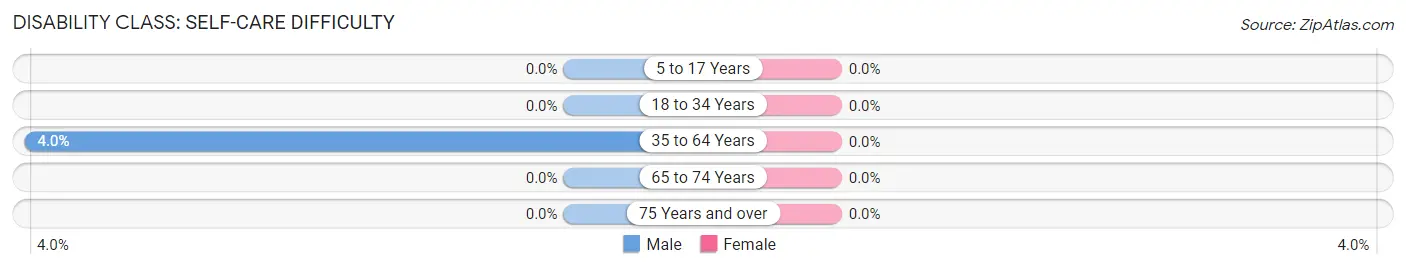
| Age Bracket | Male | Female |
| 5 to 17 Years | 0 (0.0%) | 0 (0.0%) |
| 18 to 34 Years | 0 (0.0%) | 0 (0.0%) |
| 35 to 64 Years | 5 (4.0%) | 0 (0.0%) |
| 65 to 74 Years | 0 (0.0%) | 0 (0.0%) |
| 75 Years and over | 0 (0.0%) | 0 (0.0%) |
Technology Access in Noorvik
Computing Device Access in Noorvik
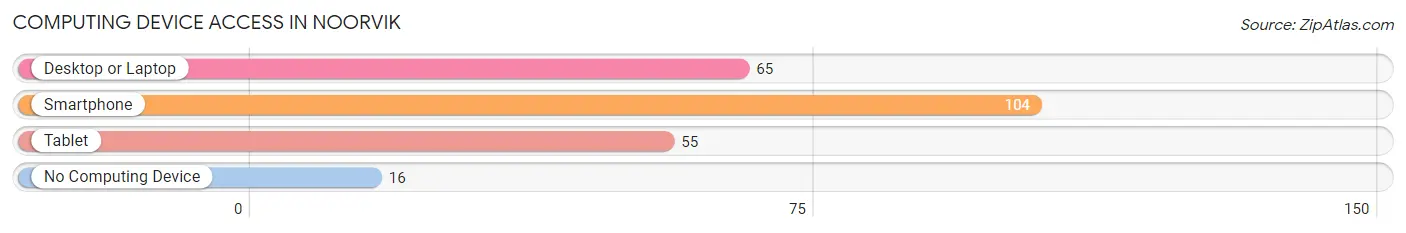
| Device Type | # Households | % Households |
| Desktop or Laptop | 65 | 54.2% |
| Smartphone | 104 | 86.7% |
| Tablet | 55 | 45.8% |
| No Computing Device | 16 | 13.3% |
| Total | 120 | 100.0% |
Internet Access in Noorvik
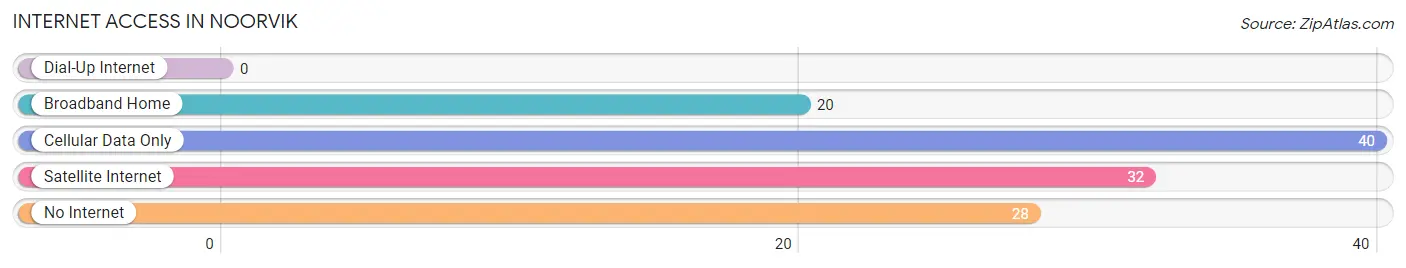
| Internet Type | # Households | % Households |
| Dial-Up Internet | 0 | 0.0% |
| Broadband Home | 20 | 16.7% |
| Cellular Data Only | 40 | 33.3% |
| Satellite Internet | 32 | 26.7% |
| No Internet | 28 | 23.3% |
| Total | 120 | 100.0% |
Noorvik Summary
Noorvik is a city located in the Northwest Arctic Borough of Alaska, United States. It is located on the Kobuk River, approximately 40 miles (64 km) east of Kotzebue. The population was 668 at the 2010 census, up from 591 in 2000. It is the largest community in the borough and the second-largest in the region, after Kotzebue.
Noorvik was founded in the early 1900s by Inupiat Eskimos who had migrated from the Kobuk River area. The city was named after the Inupiat word for "place of refuge." The city was incorporated in 1974.
Noorvik is located in the northernmost part of Alaska, on the Kobuk River. It is situated on a flat plain, surrounded by mountains and tundra. The climate is subarctic, with long, cold winters and short, cool summers.
The economy of Noorvik is largely based on subsistence hunting and fishing. The city is home to a number of small businesses, including a grocery store, a hardware store, a post office, and a restaurant. The city also has a school, a clinic, and a library.
The population of Noorvik is predominantly Inupiat Eskimo. The city is home to a number of traditional Inupiat villages, including Kivalina, Kiana, and Noatak. The population of Noorvik is approximately 668, according to the 2010 census. The median age is 24.7 years, and the median household income is $45,000.
Noorvik is served by the Noatak Airport, which is located approximately 10 miles (16 km) from the city. The airport is served by a number of regional airlines, including Alaska Airlines, Ravn Alaska, and Era Alaska. The city is also served by the Noatak River, which is used for transportation and recreation.
Noorvik is home to a number of cultural and recreational activities. The city hosts an annual Eskimo dance festival, as well as a number of other cultural events. The city also has a number of parks and trails, including the Noatak National Preserve, which is located just outside of the city.
Noorvik is a unique and vibrant city, with a rich history and culture. The city is home to a number of traditional Inupiat villages, and the population is largely Inupiat Eskimo. The city is served by a number of regional airlines, and is home to a number of cultural and recreational activities. The economy of Noorvik is largely based on subsistence hunting and fishing, and the median household income is $45,000. Noorvik is an important part of the Northwest Arctic Borough, and is an important part of Alaska's history and culture.
Common Questions
What is Per Capita Income in Noorvik?
Per Capita income in Noorvik is $16,793.
What is the Median Family Income in Noorvik?
Median Family Income in Noorvik is $57,188.
What is the Median Household income in Noorvik?
Median Household Income in Noorvik is $56,563.
What is Income or Wage Gap in Noorvik?
Income or Wage Gap in Noorvik is 3.4%.
Women in Noorvik earn 96.6 cents for every dollar earned by a man.
What is Family Income Deficit in Noorvik?
Family Income Deficit in Noorvik is $8,196.
Families that are below poverty line in Noorvik earn $8,196 less on average than the poverty threshold level.
What is Inequality or Gini Index in Noorvik?
Inequality or Gini Index in Noorvik is 0.43.
What is the Total Population of Noorvik?
Total Population of Noorvik is 654.
What is the Total Male Population of Noorvik?
Total Male Population of Noorvik is 361.
What is the Total Female Population of Noorvik?
Total Female Population of Noorvik is 293.
What is the Ratio of Males per 100 Females in Noorvik?
There are 123.21 Males per 100 Females in Noorvik.
What is the Ratio of Females per 100 Males in Noorvik?
There are 81.16 Females per 100 Males in Noorvik.
What is the Median Population Age in Noorvik?
Median Population Age in Noorvik is 26.7 Years.
What is the Average Family Size in Noorvik
Average Family Size in Noorvik is 5.7 People.
What is the Average Household Size in Noorvik
Average Household Size in Noorvik is 5.2 People.
How Large is the Labor Force in Noorvik?
There are 190 People in the Labor Forcein in Noorvik.
What is the Percentage of People in the Labor Force in Noorvik?
45.3% of People are in the Labor Force in Noorvik.
What is the Unemployment Rate in Noorvik?
Unemployment Rate in Noorvik is 33.7%.