Hoonah, AK Map & Demographics
Hoonah Map
Hoonah Overview
$37,151
PER CAPITA INCOME
$86,389
AVG FAMILY INCOME
$72,969
AVG HOUSEHOLD INCOME
7.0%
WAGE / INCOME GAP [ % ]
93.0¢/ $1
WAGE / INCOME GAP [ $ ]
0.42
INEQUALITY / GINI INDEX
896
TOTAL POPULATION
565
MALE POPULATION
331
FEMALE POPULATION
170.69
MALES / 100 FEMALES
58.58
FEMALES / 100 MALES
47.0
MEDIAN AGE
3.7
AVG FAMILY SIZE
2.9
AVG HOUSEHOLD SIZE
533
LABOR FORCE [ PEOPLE ]
68.9%
PERCENT IN LABOR FORCE
18.6%
UNEMPLOYMENT RATE
Hoonah Zip Codes
Hoonah Area Codes
Income in Hoonah
Income Overview in Hoonah
Per Capita Income in Hoonah is $37,151, while median incomes of families and households are $86,389 and $72,969 respectively.
| Characteristic | Number | Measure |
| Per Capita Income | 896 | $37,151 |
| Median Family Income | 166 | $86,389 |
| Mean Family Income | 166 | $110,326 |
| Median Household Income | 269 | $72,969 |
| Mean Household Income | 269 | $90,276 |
| Income Deficit | 166 | $0 |
| Wage / Income Gap (%) | 896 | 7.04% |
| Wage / Income Gap ($) | 896 | 92.96¢ per $1 |
| Gini / Inequality Index | 896 | 0.42 |
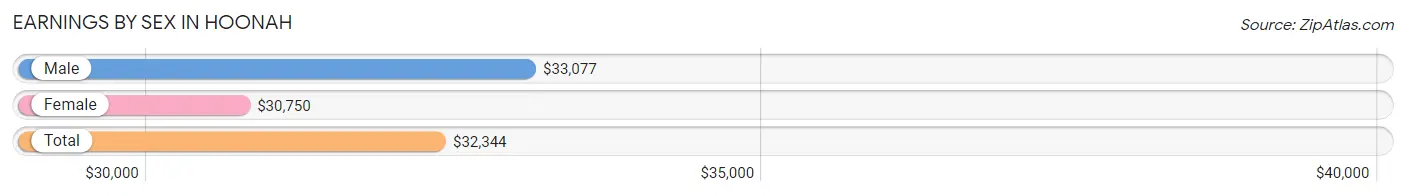
Earnings by Sex in Hoonah
Average Earnings in Hoonah are $32,344, $33,077 for men and $30,750 for women, a difference of 7.0%.
| Sex | Number | Average Earnings |
| Male | 386 (67.8%) | $33,077 |
| Female | 183 (32.2%) | $30,750 |
| Total | 569 (100.0%) | $32,344 |
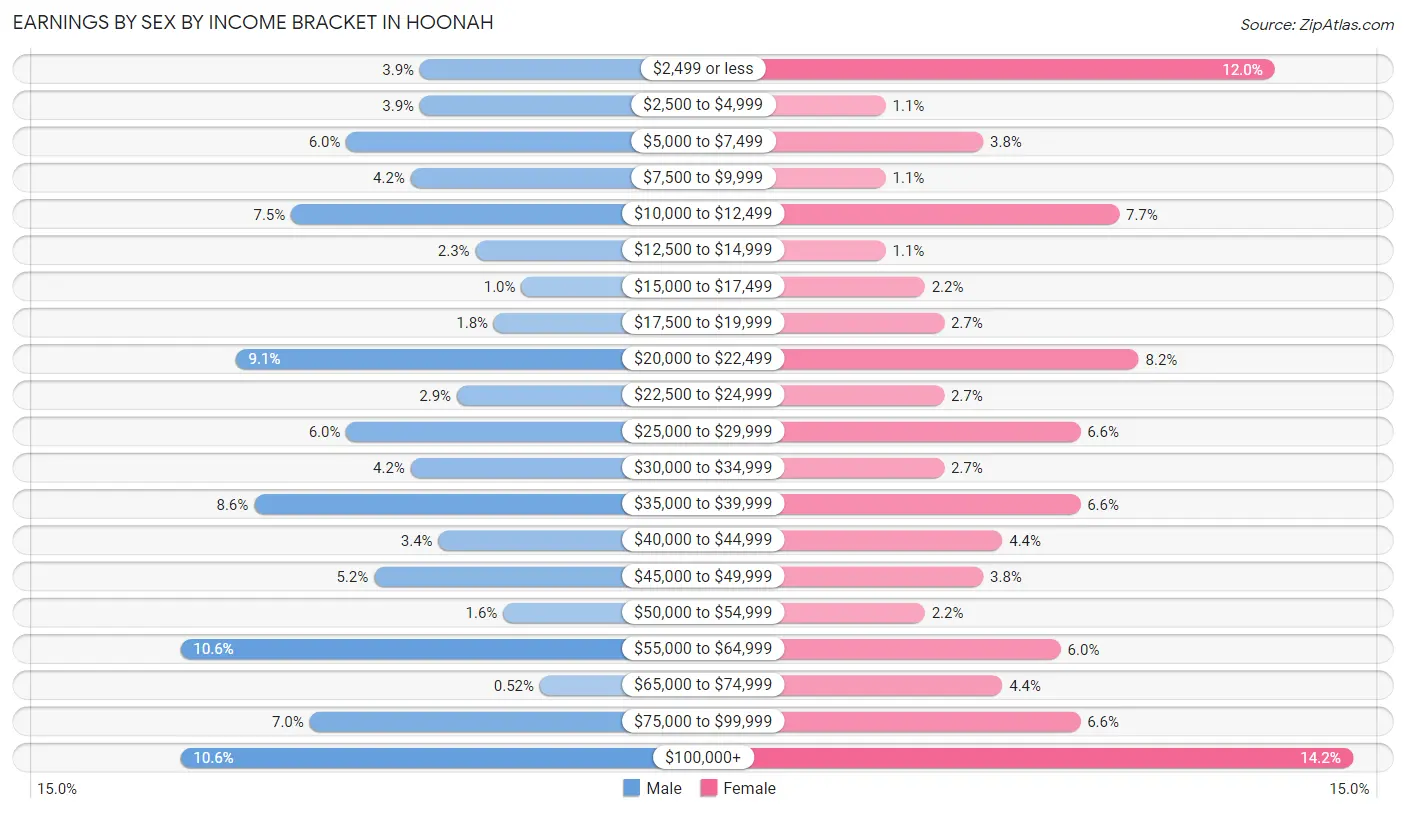
Earnings by Sex by Income Bracket in Hoonah
The most common earnings brackets in Hoonah are $55,000 to $64,999 for men (41 | 10.6%) and $100,000+ for women (26 | 14.2%).
| Income | Male | Female |
| $2,499 or less | 15 (3.9%) | 22 (12.0%) |
| $2,500 to $4,999 | 15 (3.9%) | 2 (1.1%) |
| $5,000 to $7,499 | 23 (6.0%) | 7 (3.8%) |
| $7,500 to $9,999 | 16 (4.2%) | 2 (1.1%) |
| $10,000 to $12,499 | 29 (7.5%) | 14 (7.6%) |
| $12,500 to $14,999 | 9 (2.3%) | 2 (1.1%) |
| $15,000 to $17,499 | 4 (1.0%) | 4 (2.2%) |
| $17,500 to $19,999 | 7 (1.8%) | 5 (2.7%) |
| $20,000 to $22,499 | 35 (9.1%) | 15 (8.2%) |
| $22,500 to $24,999 | 11 (2.9%) | 5 (2.7%) |
| $25,000 to $29,999 | 23 (6.0%) | 12 (6.6%) |
| $30,000 to $34,999 | 16 (4.2%) | 5 (2.7%) |
| $35,000 to $39,999 | 33 (8.6%) | 12 (6.6%) |
| $40,000 to $44,999 | 13 (3.4%) | 8 (4.4%) |
| $45,000 to $49,999 | 20 (5.2%) | 7 (3.8%) |
| $50,000 to $54,999 | 6 (1.5%) | 4 (2.2%) |
| $55,000 to $64,999 | 41 (10.6%) | 11 (6.0%) |
| $65,000 to $74,999 | 2 (0.5%) | 8 (4.4%) |
| $75,000 to $99,999 | 27 (7.0%) | 12 (6.6%) |
| $100,000+ | 41 (10.6%) | 26 (14.2%) |
| Total | 386 (100.0%) | 183 (100.0%) |
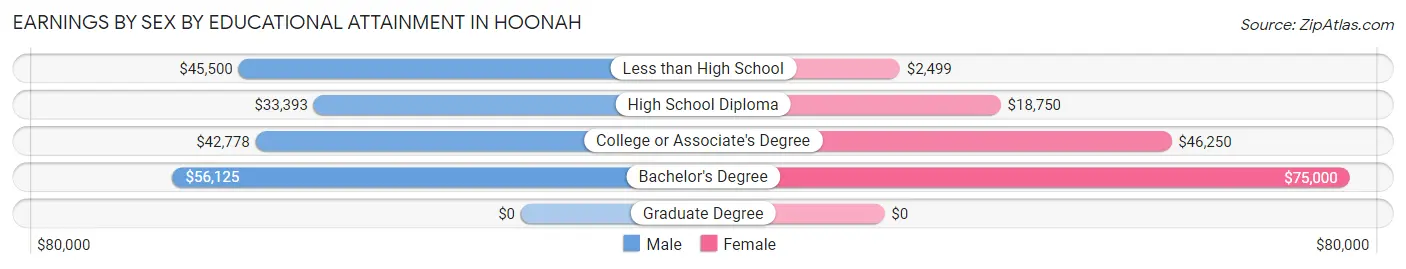
Earnings by Sex by Educational Attainment in Hoonah
Average earnings in Hoonah are $38,625 for men and $33,750 for women, a difference of 12.6%. Men with an educational attainment of bachelor's degree enjoy the highest average annual earnings of $56,125, while those with high school diploma education earn the least with $33,393. Women with an educational attainment of bachelor's degree earn the most with the average annual earnings of $75,000, while those with less than high school education have the smallest earnings of $2,499.
| Educational Attainment | Male Income | Female Income |
| Less than High School | $45,500 | $2,499 |
| High School Diploma | $33,393 | $18,750 |
| College or Associate's Degree | $42,778 | $46,250 |
| Bachelor's Degree | $56,125 | $75,000 |
| Graduate Degree | - | - |
| Total | $38,625 | $33,750 |
Family Income in Hoonah
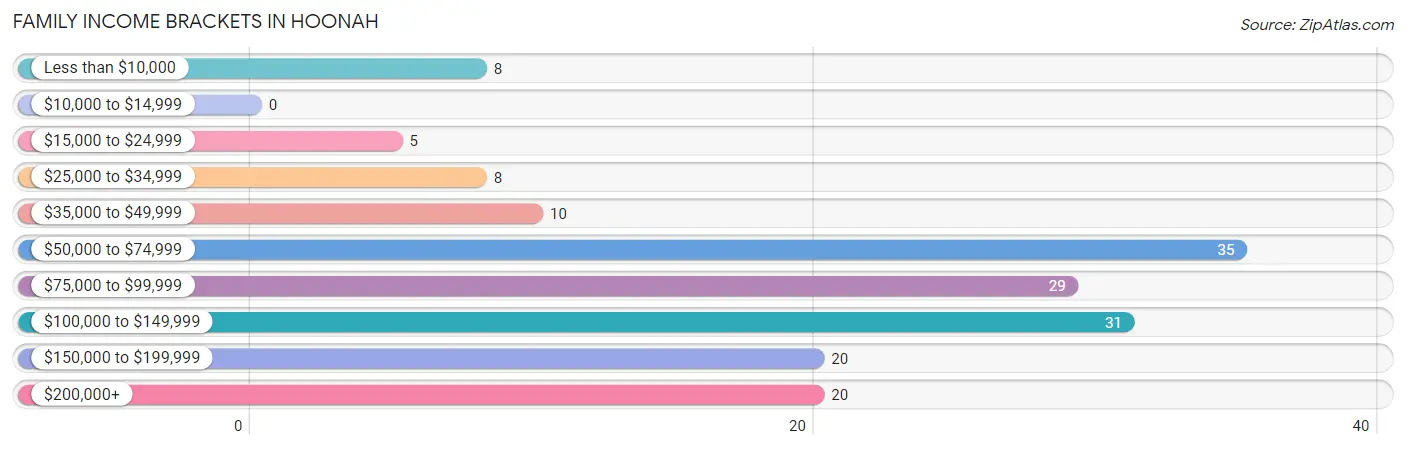
Family Income Brackets in Hoonah
According to the Hoonah family income data, there are 35 families falling into the $50,000 to $74,999 income range, which is the most common income bracket and makes up 21.1% of all families.
| Income Bracket | # Families | % Families |
| Less than $10,000 | 8 | 4.8% |
| $10,000 to $14,999 | 0 | 0.0% |
| $15,000 to $24,999 | 5 | 3.0% |
| $25,000 to $34,999 | 8 | 4.8% |
| $35,000 to $49,999 | 10 | 6.0% |
| $50,000 to $74,999 | 35 | 21.1% |
| $75,000 to $99,999 | 29 | 17.5% |
| $100,000 to $149,999 | 31 | 18.7% |
| $150,000 to $199,999 | 20 | 12.0% |
| $200,000+ | 20 | 12.0% |
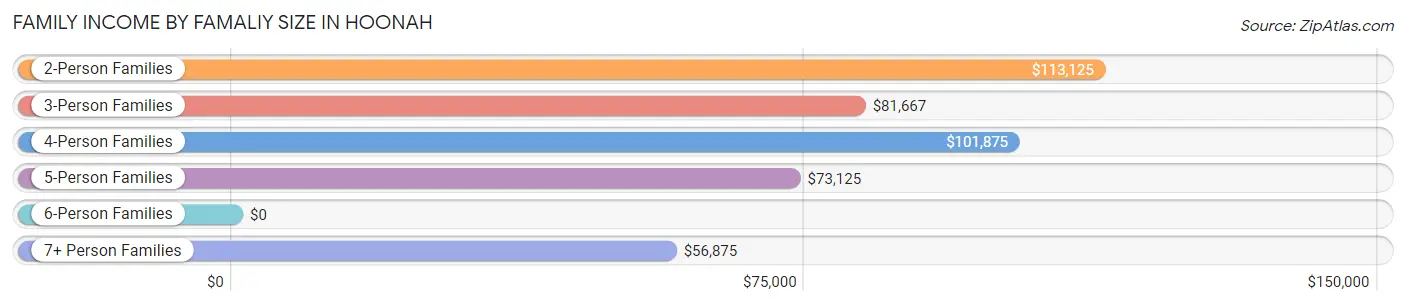
Family Income by Famaliy Size in Hoonah
2-person families (99 | 59.6%) account for the highest median family income in Hoonah with $113,125 per family, while 2-person families (99 | 59.6%) have the highest median income of $56,562 per family member.
| Income Bracket | # Families | Median Income |
| 2-Person Families | 99 (59.6%) | $113,125 |
| 3-Person Families | 36 (21.7%) | $81,667 |
| 4-Person Families | 11 (6.6%) | $101,875 |
| 5-Person Families | 7 (4.2%) | $73,125 |
| 6-Person Families | 7 (4.2%) | $0 |
| 7+ Person Families | 6 (3.6%) | $56,875 |
| Total | 166 (100.0%) | $86,389 |
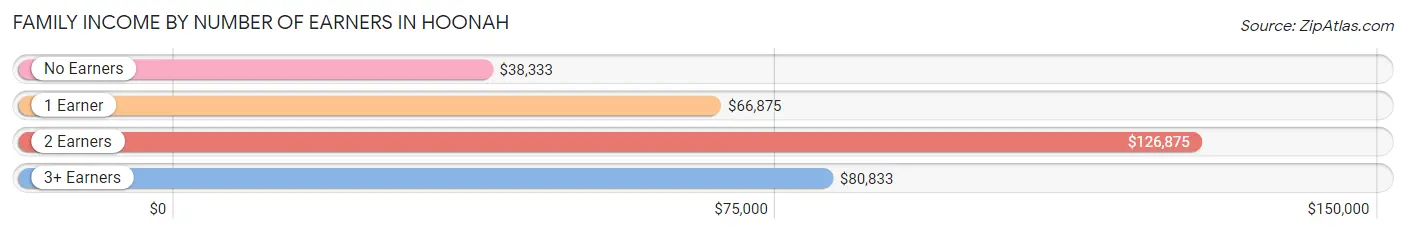
Family Income by Number of Earners in Hoonah
The median family income in Hoonah is $86,389, with families comprising 2 earners (72) having the highest median family income of $126,875, while families with no earners (20) have the lowest median family income of $38,333, accounting for 43.4% and 12.0% of families, respectively.
| Number of Earners | # Families | Median Income |
| No Earners | 20 (12.0%) | $38,333 |
| 1 Earner | 60 (36.1%) | $66,875 |
| 2 Earners | 72 (43.4%) | $126,875 |
| 3+ Earners | 14 (8.4%) | $80,833 |
| Total | 166 (100.0%) | $86,389 |
Household Income in Hoonah
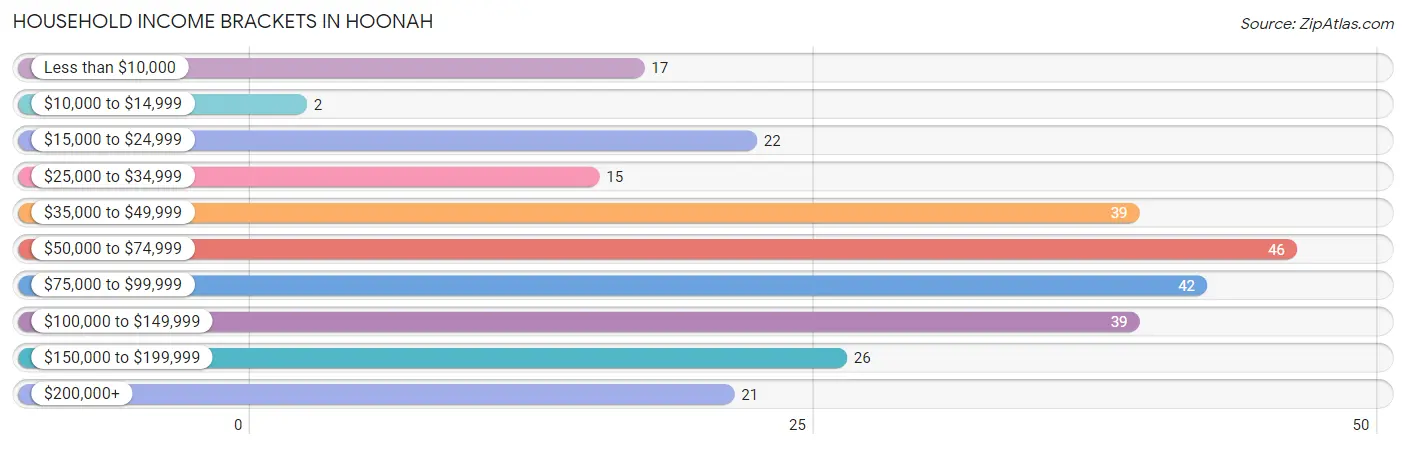
Household Income Brackets in Hoonah
With 46 households falling in the category, the $50,000 to $74,999 income range is the most frequent in Hoonah, accounting for 17.1% of all households. In contrast, only 2 households (0.7%) fall into the $10,000 to $14,999 income bracket, making it the least populous group.
| Income Bracket | # Households | % Households |
| Less than $10,000 | 17 | 6.3% |
| $10,000 to $14,999 | 2 | 0.7% |
| $15,000 to $24,999 | 22 | 8.2% |
| $25,000 to $34,999 | 15 | 5.6% |
| $35,000 to $49,999 | 39 | 14.5% |
| $50,000 to $74,999 | 46 | 17.1% |
| $75,000 to $99,999 | 42 | 15.6% |
| $100,000 to $149,999 | 39 | 14.5% |
| $150,000 to $199,999 | 26 | 9.7% |
| $200,000+ | 21 | 7.8% |
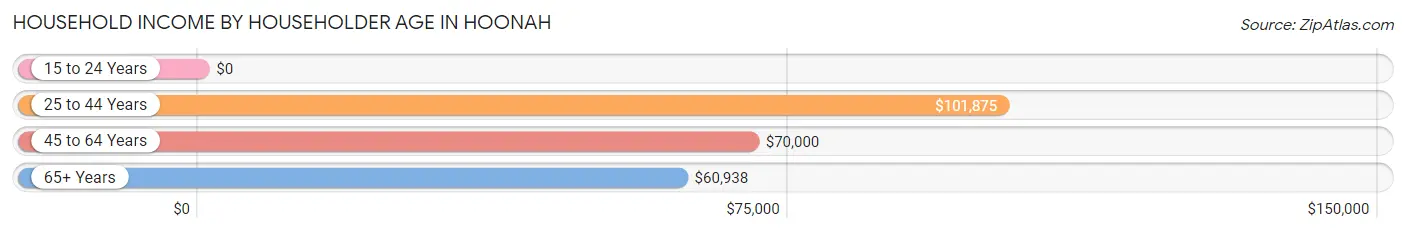
Household Income by Householder Age in Hoonah
The median household income in Hoonah is $72,969, with the highest median household income of $101,875 found in the 25 to 44 years age bracket for the primary householder. A total of 41 households (15.2%) fall into this category. Meanwhile, the 15 to 24 years age bracket for the primary householder has the lowest median household income of $0, with 3 households (1.1%) in this group.
| Income Bracket | # Households | Median Income |
| 15 to 24 Years | 3 (1.1%) | $0 |
| 25 to 44 Years | 41 (15.2%) | $101,875 |
| 45 to 64 Years | 124 (46.1%) | $70,000 |
| 65+ Years | 101 (37.6%) | $60,938 |
| Total | 269 (100.0%) | $72,969 |
Poverty in Hoonah
Income Below Poverty by Sex and Age in Hoonah
With 12.7% poverty level for males and 8.2% for females among the residents of Hoonah, 65 to 74 year old males and 15 year old females are the most vulnerable to poverty, with 20 males (25.6%) and 2 females (100.0%) in their respective age groups living below the poverty level.
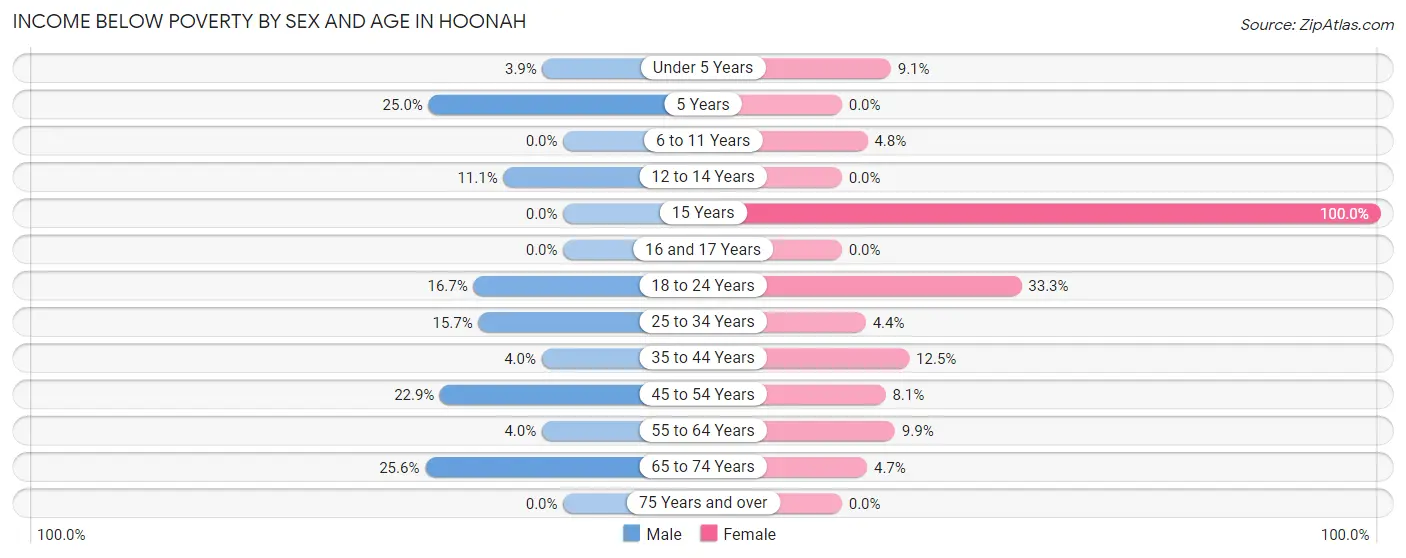
| Age Bracket | Male | Female |
| Under 5 Years | 1 (3.8%) | 1 (9.1%) |
| 5 Years | 1 (25.0%) | 0 (0.0%) |
| 6 to 11 Years | 0 (0.0%) | 1 (4.8%) |
| 12 to 14 Years | 1 (11.1%) | 0 (0.0%) |
| 15 Years | 0 (0.0%) | 2 (100.0%) |
| 16 and 17 Years | 0 (0.0%) | 0 (0.0%) |
| 18 to 24 Years | 10 (16.7%) | 5 (33.3%) |
| 25 to 34 Years | 17 (15.7%) | 2 (4.4%) |
| 35 to 44 Years | 2 (4.0%) | 3 (12.5%) |
| 45 to 54 Years | 16 (22.9%) | 3 (8.1%) |
| 55 to 64 Years | 4 (4.0%) | 7 (9.9%) |
| 65 to 74 Years | 20 (25.6%) | 3 (4.7%) |
| 75 Years and over | 0 (0.0%) | 0 (0.0%) |
| Total | 72 (12.7%) | 27 (8.2%) |
Income Above Poverty by Sex and Age in Hoonah
According to the poverty statistics in Hoonah, males aged 6 to 11 years and females aged 5 years are the age groups that are most secure financially, with 100.0% of males and 100.0% of females in these age groups living above the poverty line.
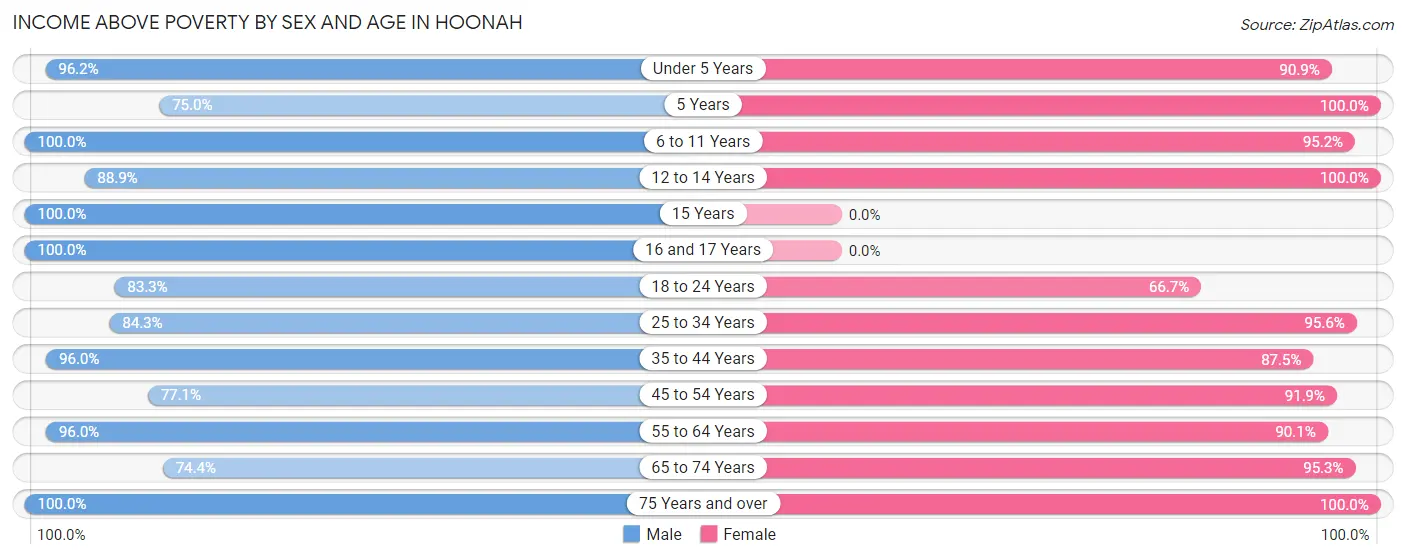
| Age Bracket | Male | Female |
| Under 5 Years | 25 (96.2%) | 10 (90.9%) |
| 5 Years | 3 (75.0%) | 5 (100.0%) |
| 6 to 11 Years | 25 (100.0%) | 20 (95.2%) |
| 12 to 14 Years | 8 (88.9%) | 18 (100.0%) |
| 15 Years | 1 (100.0%) | 0 (0.0%) |
| 16 and 17 Years | 2 (100.0%) | 0 (0.0%) |
| 18 to 24 Years | 50 (83.3%) | 10 (66.7%) |
| 25 to 34 Years | 91 (84.3%) | 43 (95.6%) |
| 35 to 44 Years | 48 (96.0%) | 21 (87.5%) |
| 45 to 54 Years | 54 (77.1%) | 34 (91.9%) |
| 55 to 64 Years | 97 (96.0%) | 64 (90.1%) |
| 65 to 74 Years | 58 (74.4%) | 61 (95.3%) |
| 75 Years and over | 31 (100.0%) | 18 (100.0%) |
| Total | 493 (87.3%) | 304 (91.8%) |
Income Below Poverty Among Married-Couple Families in Hoonah
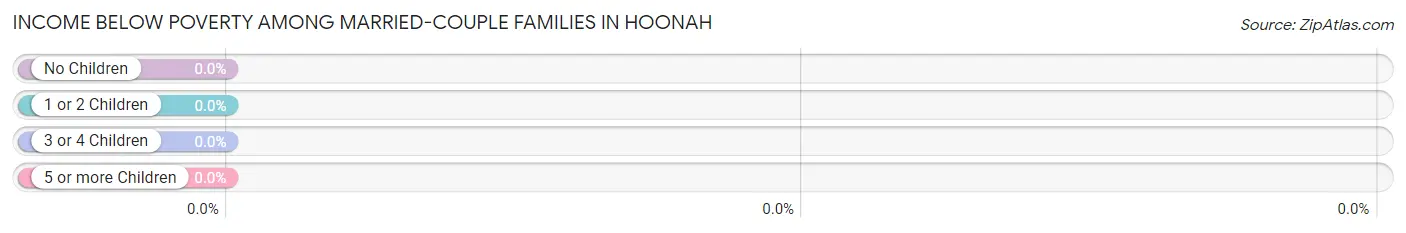
| Children | Above Poverty | Below Poverty |
| No Children | 86 (100.0%) | 0 (0.0%) |
| 1 or 2 Children | 16 (100.0%) | 0 (0.0%) |
| 3 or 4 Children | 1 (100.0%) | 0 (0.0%) |
| 5 or more Children | 1 (100.0%) | 0 (0.0%) |
| Total | 104 (100.0%) | 0 (0.0%) |
Income Below Poverty Among Single-Parent Households in Hoonah
According to the poverty data in Hoonah, 16.7% or 4 single-father households and 15.8% or 6 single-mother households are living below the poverty line. Among single-father households, those with no children have the highest poverty rate, with 2 households (25.0%) experiencing poverty. Likewise, among single-mother households, those with 1 or 2 children have the highest poverty rate, with 4 households (26.7%) falling below the poverty line.
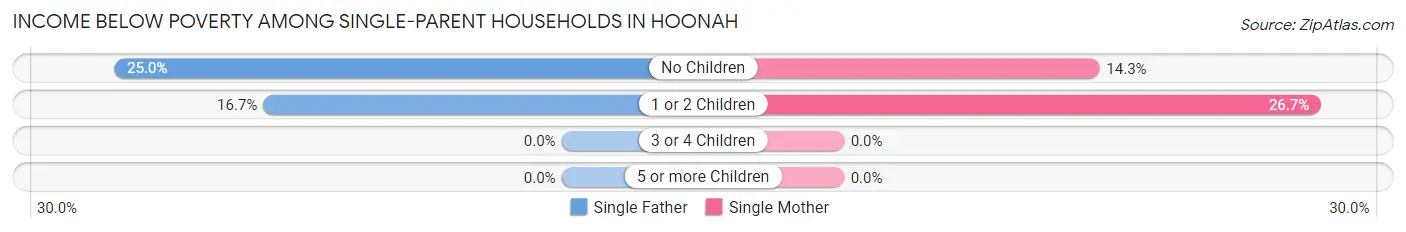
| Children | Single Father | Single Mother |
| No Children | 2 (25.0%) | 2 (14.3%) |
| 1 or 2 Children | 2 (16.7%) | 4 (26.7%) |
| 3 or 4 Children | 0 (0.0%) | 0 (0.0%) |
| 5 or more Children | 0 (0.0%) | 0 (0.0%) |
| Total | 4 (16.7%) | 6 (15.8%) |
Income Below Poverty Among Married-Couple vs Single-Parent Households in Hoonah
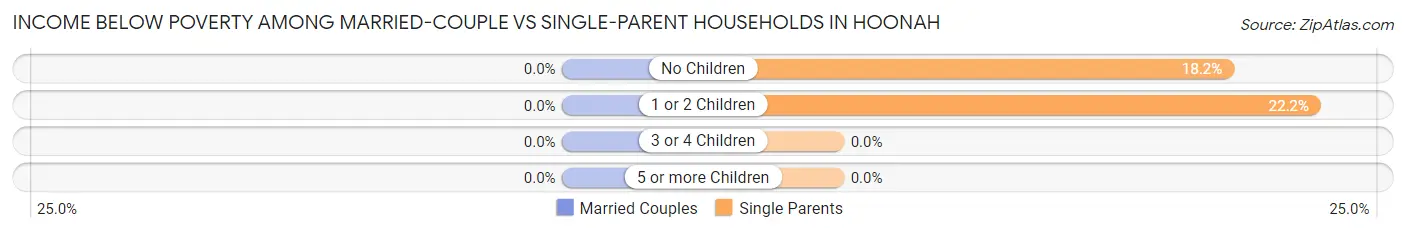
| Children | Married-Couple Families | Single-Parent Households |
| No Children | 0 (0.0%) | 4 (18.2%) |
| 1 or 2 Children | 0 (0.0%) | 6 (22.2%) |
| 3 or 4 Children | 0 (0.0%) | 0 (0.0%) |
| 5 or more Children | 0 (0.0%) | 0 (0.0%) |
| Total | 0 (0.0%) | 10 (16.1%) |
Race in Hoonah
The most populous races in Hoonah are White / Caucasian (323 | 36.0%), Native / Alaskan (302 | 33.7%), and Two or more Races (239 | 26.7%).
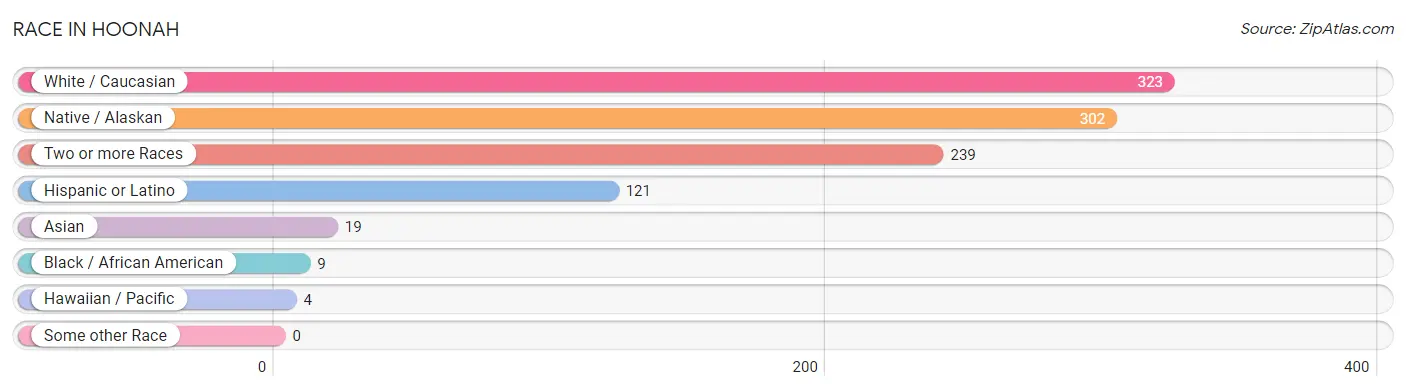
| Race | # Population | % Population |
| Asian | 19 | 2.1% |
| Black / African American | 9 | 1.0% |
| Hawaiian / Pacific | 4 | 0.4% |
| Hispanic or Latino | 121 | 13.5% |
| Native / Alaskan | 302 | 33.7% |
| White / Caucasian | 323 | 36.0% |
| Two or more Races | 239 | 26.7% |
| Some other Race | 0 | 0.0% |
| Total | 896 | 100.0% |
Ancestry in Hoonah
The most populous ancestries reported in Hoonah are Tlingit-Haida (442 | 49.3%), German (126 | 14.1%), Mexican (80 | 8.9%), Korean (44 | 4.9%), and Irish (42 | 4.7%), together accounting for 81.9% of all Hoonah residents.
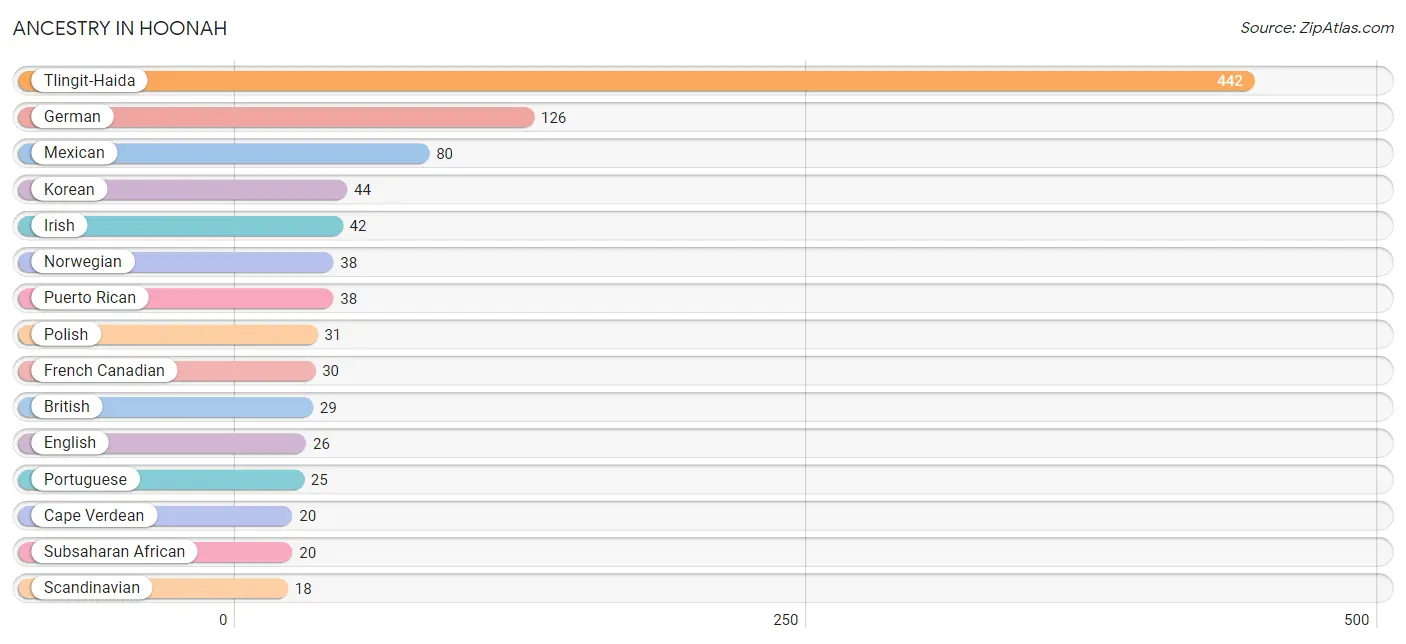
| Ancestry | # Population | % Population |
| Alaska Native | 8 | 0.9% |
| Alaskan Athabascan | 2 | 0.2% |
| Aleut | 6 | 0.7% |
| Arab | 2 | 0.2% |
| Bhutanese | 2 | 0.2% |
| British | 29 | 3.2% |
| Bulgarian | 4 | 0.4% |
| Canadian | 1 | 0.1% |
| Cape Verdean | 20 | 2.2% |
| Central American | 3 | 0.3% |
| Czech | 2 | 0.2% |
| Czechoslovakian | 3 | 0.3% |
| Danish | 1 | 0.1% |
| English | 26 | 2.9% |
| European | 15 | 1.7% |
| Finnish | 5 | 0.6% |
| French | 7 | 0.8% |
| French Canadian | 30 | 3.4% |
| German | 126 | 14.1% |
| Hungarian | 2 | 0.2% |
| Indian (Asian) | 3 | 0.3% |
| Inupiat | 4 | 0.4% |
| Irish | 42 | 4.7% |
| Italian | 14 | 1.6% |
| Korean | 44 | 4.9% |
| Lebanese | 2 | 0.2% |
| Mexican | 80 | 8.9% |
| Mexican American Indian | 3 | 0.3% |
| Native Hawaiian | 15 | 1.7% |
| Northern European | 3 | 0.3% |
| Norwegian | 38 | 4.2% |
| Polish | 31 | 3.5% |
| Portuguese | 25 | 2.8% |
| Puerto Rican | 38 | 4.2% |
| Russian | 11 | 1.2% |
| Salvadoran | 3 | 0.3% |
| Scandinavian | 18 | 2.0% |
| Scotch-Irish | 12 | 1.3% |
| Scottish | 2 | 0.2% |
| Subsaharan African | 20 | 2.2% |
| Swedish | 13 | 1.5% |
| Tlingit-Haida | 442 | 49.3% |
| Turkish | 5 | 0.6% |
| Ukrainian | 5 | 0.6% |
| Welsh | 3 | 0.3% |
| Yup'ik | 9 | 1.0% | View All 46 Rows |
Immigrants in Hoonah
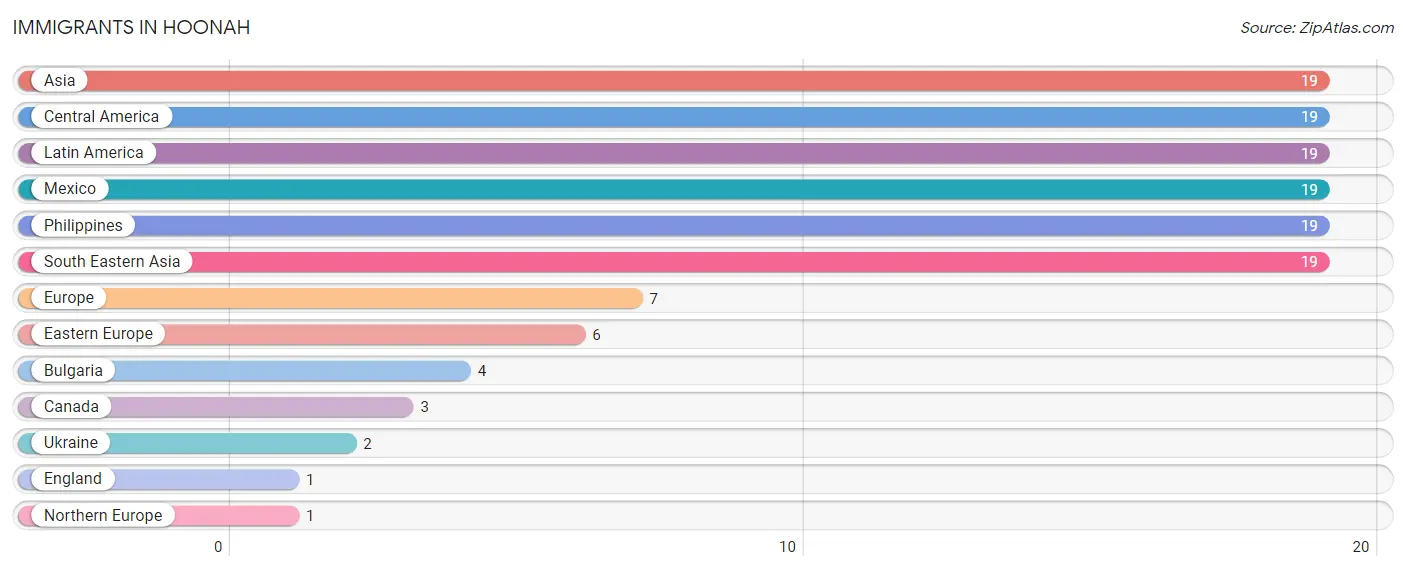
The most numerous immigrant groups reported in Hoonah came from Asia (19 | 2.1%), Central America (19 | 2.1%), Latin America (19 | 2.1%), Mexico (19 | 2.1%), and Philippines (19 | 2.1%), together accounting for 10.6% of all Hoonah residents.
| Immigration Origin | # Population | % Population |
| Asia | 19 | 2.1% |
| Bulgaria | 4 | 0.4% |
| Canada | 3 | 0.3% |
| Central America | 19 | 2.1% |
| Eastern Europe | 6 | 0.7% |
| England | 1 | 0.1% |
| Europe | 7 | 0.8% |
| Latin America | 19 | 2.1% |
| Mexico | 19 | 2.1% |
| Northern Europe | 1 | 0.1% |
| Philippines | 19 | 2.1% |
| South Eastern Asia | 19 | 2.1% |
| Ukraine | 2 | 0.2% | View All 13 Rows |
Sex and Age in Hoonah
Sex and Age in Hoonah
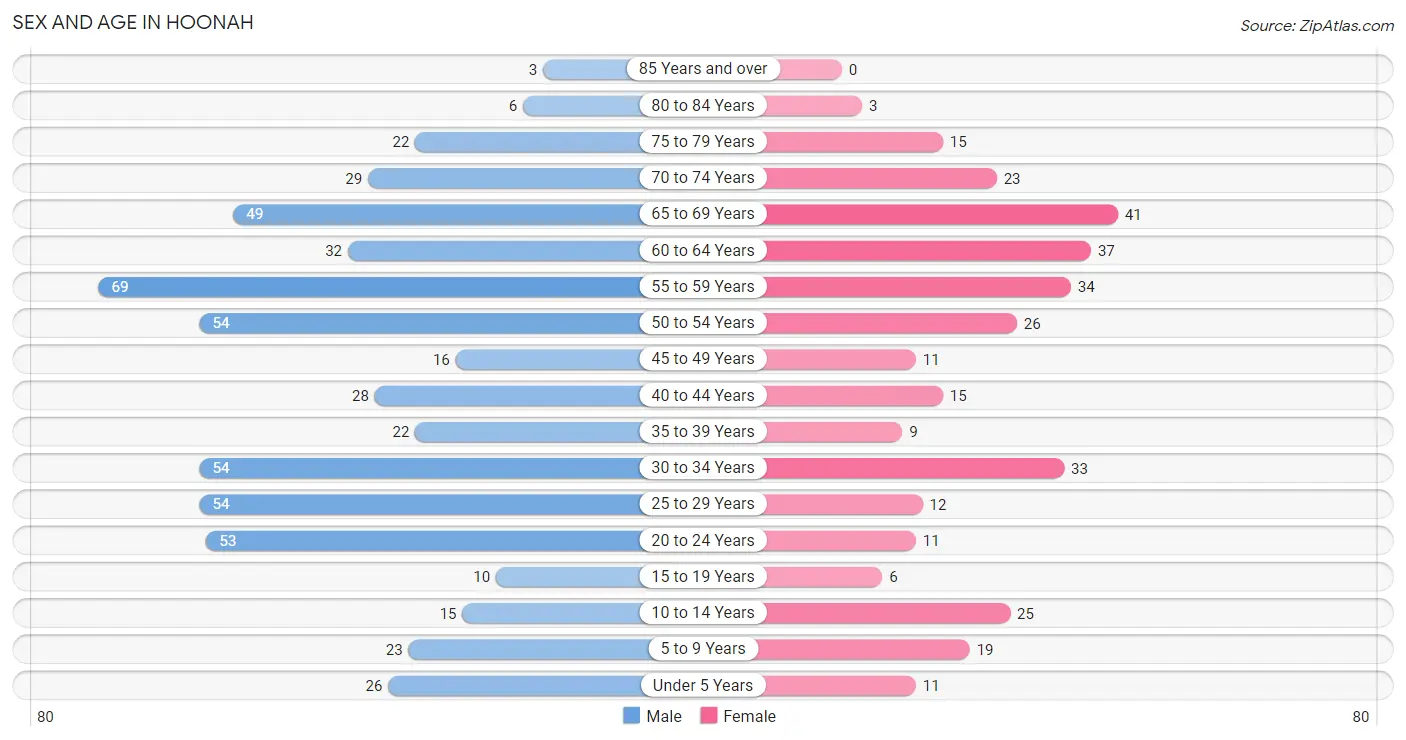
The most populous age groups in Hoonah are 55 to 59 Years (69 | 12.2%) for men and 65 to 69 Years (41 | 12.4%) for women.
| Age Bracket | Male | Female |
| Under 5 Years | 26 (4.6%) | 11 (3.3%) |
| 5 to 9 Years | 23 (4.1%) | 19 (5.7%) |
| 10 to 14 Years | 15 (2.6%) | 25 (7.5%) |
| 15 to 19 Years | 10 (1.8%) | 6 (1.8%) |
| 20 to 24 Years | 53 (9.4%) | 11 (3.3%) |
| 25 to 29 Years | 54 (9.6%) | 12 (3.6%) |
| 30 to 34 Years | 54 (9.6%) | 33 (10.0%) |
| 35 to 39 Years | 22 (3.9%) | 9 (2.7%) |
| 40 to 44 Years | 28 (5.0%) | 15 (4.5%) |
| 45 to 49 Years | 16 (2.8%) | 11 (3.3%) |
| 50 to 54 Years | 54 (9.6%) | 26 (7.9%) |
| 55 to 59 Years | 69 (12.2%) | 34 (10.3%) |
| 60 to 64 Years | 32 (5.7%) | 37 (11.2%) |
| 65 to 69 Years | 49 (8.7%) | 41 (12.4%) |
| 70 to 74 Years | 29 (5.1%) | 23 (7.0%) |
| 75 to 79 Years | 22 (3.9%) | 15 (4.5%) |
| 80 to 84 Years | 6 (1.1%) | 3 (0.9%) |
| 85 Years and over | 3 (0.5%) | 0 (0.0%) |
| Total | 565 (100.0%) | 331 (100.0%) |
Families and Households in Hoonah
Median Family Size in Hoonah
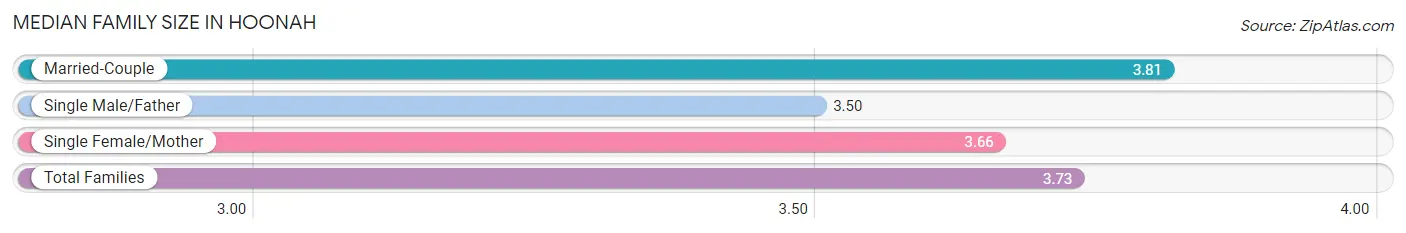
The median family size in Hoonah is 3.73 persons per family, with married-couple families (104 | 62.6%) accounting for the largest median family size of 3.81 persons per family. On the other hand, single male/father families (24 | 14.5%) represent the smallest median family size with 3.50 persons per family.
| Family Type | # Families | Family Size |
| Married-Couple | 104 (62.6%) | 3.81 |
| Single Male/Father | 24 (14.5%) | 3.50 |
| Single Female/Mother | 38 (22.9%) | 3.66 |
| Total Families | 166 (100.0%) | 3.73 |
Median Household Size in Hoonah
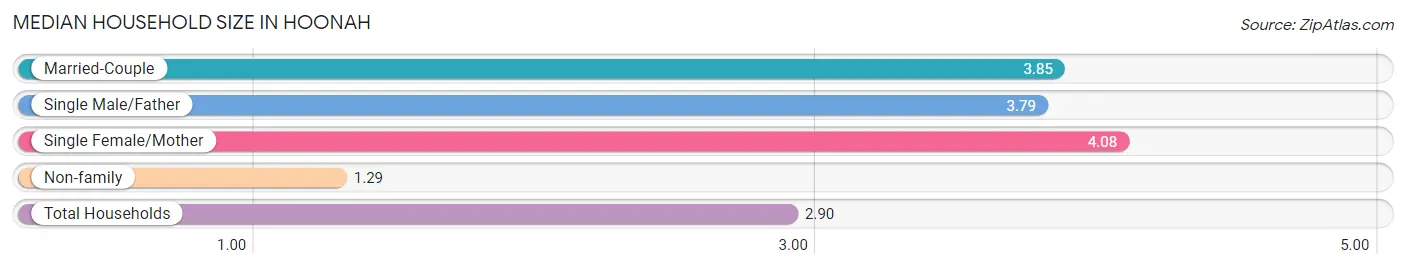
The median household size in Hoonah is 2.90 persons per household, with single female/mother households (38 | 14.1%) accounting for the largest median household size of 4.08 persons per household. non-family households (103 | 38.3%) represent the smallest median household size with 1.29 persons per household.
| Household Type | # Households | Household Size |
| Married-Couple | 104 (38.7%) | 3.85 |
| Single Male/Father | 24 (8.9%) | 3.79 |
| Single Female/Mother | 38 (14.1%) | 4.08 |
| Non-family | 103 (38.3%) | 1.29 |
| Total Households | 269 (100.0%) | 2.90 |
Household Size by Marriage Status in Hoonah
Out of a total of 269 households in Hoonah, 166 (61.7%) are family households, while 103 (38.3%) are nonfamily households. The most numerous type of family households are 2-person households, comprising 89, and the most common type of nonfamily households are 1-person households, comprising 81.
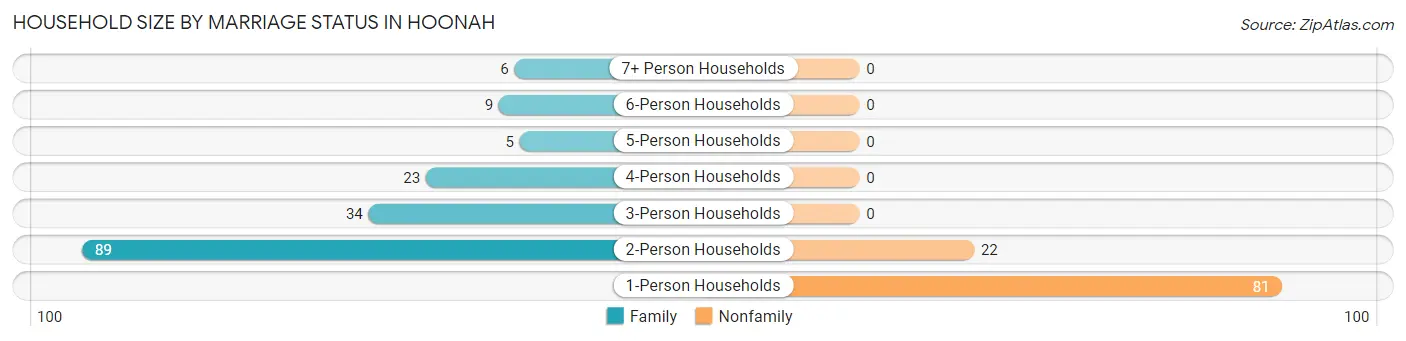
| Household Size | Family Households | Nonfamily Households |
| 1-Person Households | - | 81 (30.1%) |
| 2-Person Households | 89 (33.1%) | 22 (8.2%) |
| 3-Person Households | 34 (12.6%) | 0 (0.0%) |
| 4-Person Households | 23 (8.6%) | 0 (0.0%) |
| 5-Person Households | 5 (1.9%) | 0 (0.0%) |
| 6-Person Households | 9 (3.4%) | 0 (0.0%) |
| 7+ Person Households | 6 (2.2%) | 0 (0.0%) |
| Total | 166 (61.7%) | 103 (38.3%) |
Female Fertility in Hoonah
Fertility by Age in Hoonah
Average fertility rate in Hoonah is 29.0 births per 1,000 women. Women in the age bracket of 20 to 34 years have the highest fertility rate with 54.0 births per 1,000 women. Women in the age bracket of 20 to 34 years acount for 100.0% of all women with births.
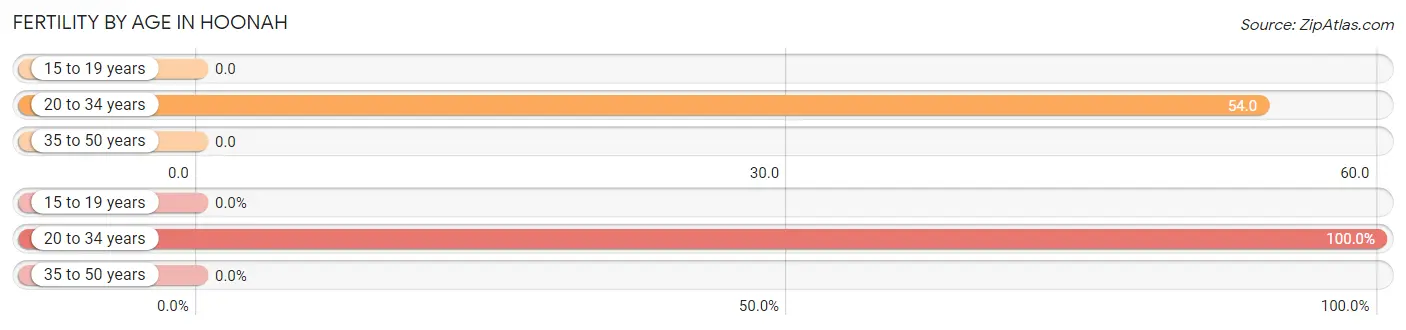
| Age Bracket | Women with Births | Births / 1,000 Women |
| 15 to 19 years | 0 (0.0%) | 0.0 |
| 20 to 34 years | 3 (100.0%) | 54.0 |
| 35 to 50 years | 0 (0.0%) | 0.0 |
| Total | 3 (100.0%) | 29.0 |
Fertility by Age by Marriage Status in Hoonah
66.7% of women with births (3) in Hoonah are married. The highest percentage of unmarried women with births falls into 20 to 34 years age bracket with 33.3% of them unmarried at the time of birth, while the lowest percentage of unmarried women with births belong to 20 to 34 years age bracket with 33.3% of them unmarried.
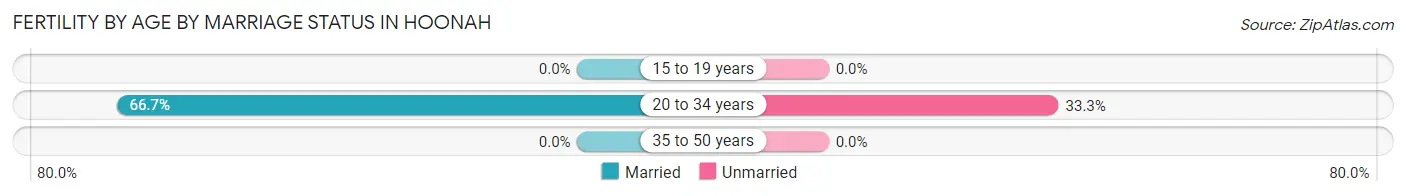
| Age Bracket | Married | Unmarried |
| 15 to 19 years | 0 (0.0%) | 0 (0.0%) |
| 20 to 34 years | 2 (66.7%) | 1 (33.3%) |
| 35 to 50 years | 0 (0.0%) | 0 (0.0%) |
| Total | 2 (66.7%) | 1 (33.3%) |
Fertility by Education in Hoonah
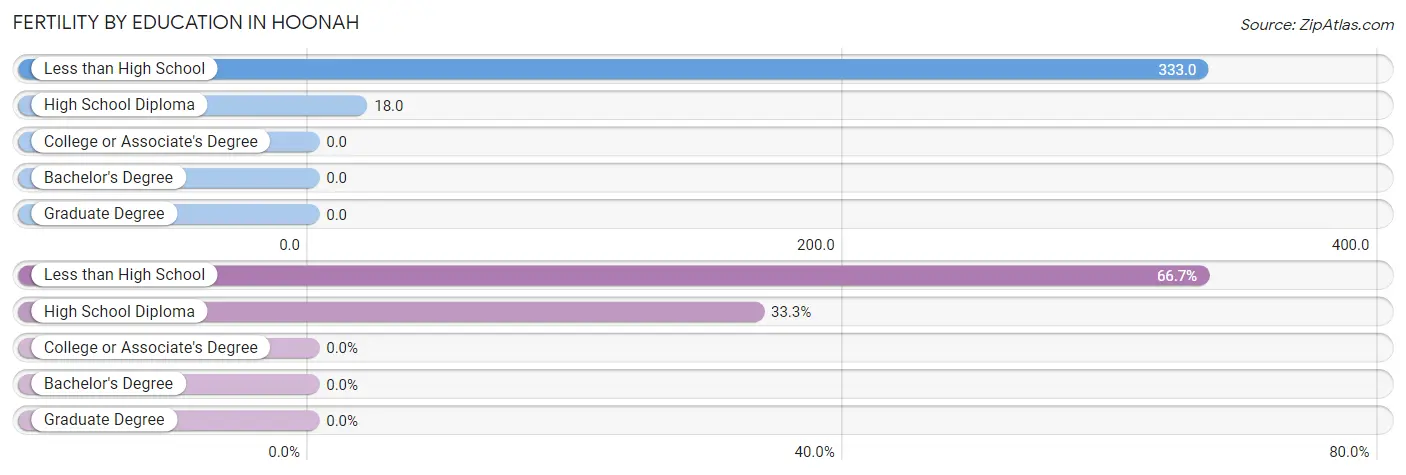
| Educational Attainment | Women with Births | Births / 1,000 Women |
| Less than High School | 2 (66.7%) | 333.0 |
| High School Diploma | 1 (33.3%) | 18.0 |
| College or Associate's Degree | 0 (0.0%) | 0.0 |
| Bachelor's Degree | 0 (0.0%) | 0.0 |
| Graduate Degree | 0 (0.0%) | 0.0 |
| Total | 3 (100.0%) | 29.0 |
Fertility by Education by Marriage Status in Hoonah
33.3% of women with births in Hoonah are unmarried. Women with the educational attainment of less than high school are most likely to be married with 100.0% of them married at childbirth, while women with the educational attainment of high school diploma are least likely to be married with 100.0% of them unmarried at childbirth.
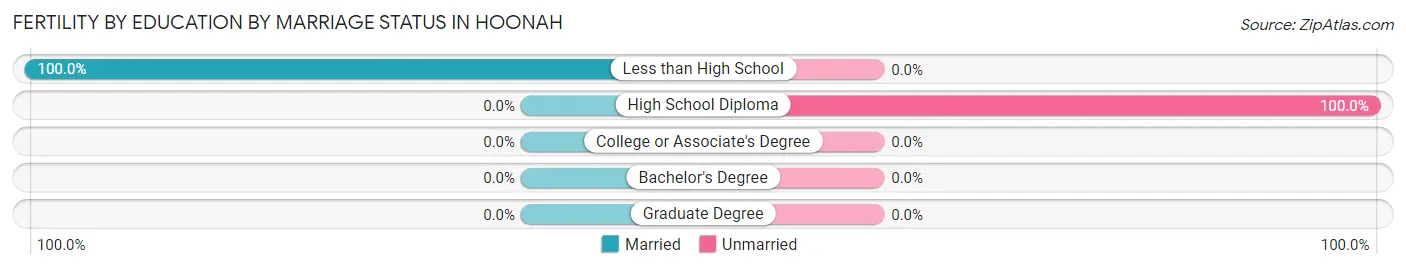
| Educational Attainment | Married | Unmarried |
| Less than High School | 2 (100.0%) | 0 (0.0%) |
| High School Diploma | 0 (0.0%) | 1 (100.0%) |
| College or Associate's Degree | 0 (0.0%) | 0 (0.0%) |
| Bachelor's Degree | 0 (0.0%) | 0 (0.0%) |
| Graduate Degree | 0 (0.0%) | 0 (0.0%) |
| Total | 2 (66.7%) | 1 (33.3%) |
Employment Characteristics in Hoonah
Employment by Class of Employer in Hoonah
Among the 423 employed individuals in Hoonah, private company employees (167 | 39.5%), local government employees (113 | 26.7%), and federal government employees (47 | 11.1%) make up the most common classes of employment.
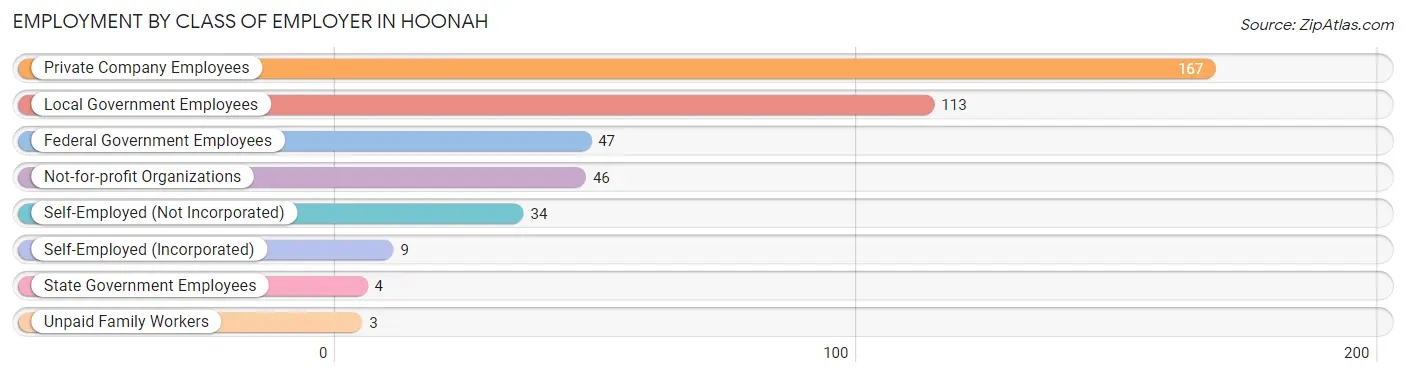
| Employer Class | # Employees | % Employees |
| Private Company Employees | 167 | 39.5% |
| Self-Employed (Incorporated) | 9 | 2.1% |
| Self-Employed (Not Incorporated) | 34 | 8.0% |
| Not-for-profit Organizations | 46 | 10.9% |
| Local Government Employees | 113 | 26.7% |
| State Government Employees | 4 | 0.9% |
| Federal Government Employees | 47 | 11.1% |
| Unpaid Family Workers | 3 | 0.7% |
| Total | 423 | 100.0% |
Employment Status by Age in Hoonah
According to the labor force statistics for Hoonah, out of the total population over 16 years of age (774), 68.9% or 533 individuals are in the labor force, with 18.6% or 99 of them unemployed. The age group with the highest labor force participation rate is 20 to 24 years, with 100.0% or 64 individuals in the labor force. Within the labor force, the 16 to 19 years age range has the highest percentage of unemployed individuals, with 50.0% or 4 of them being unemployed.
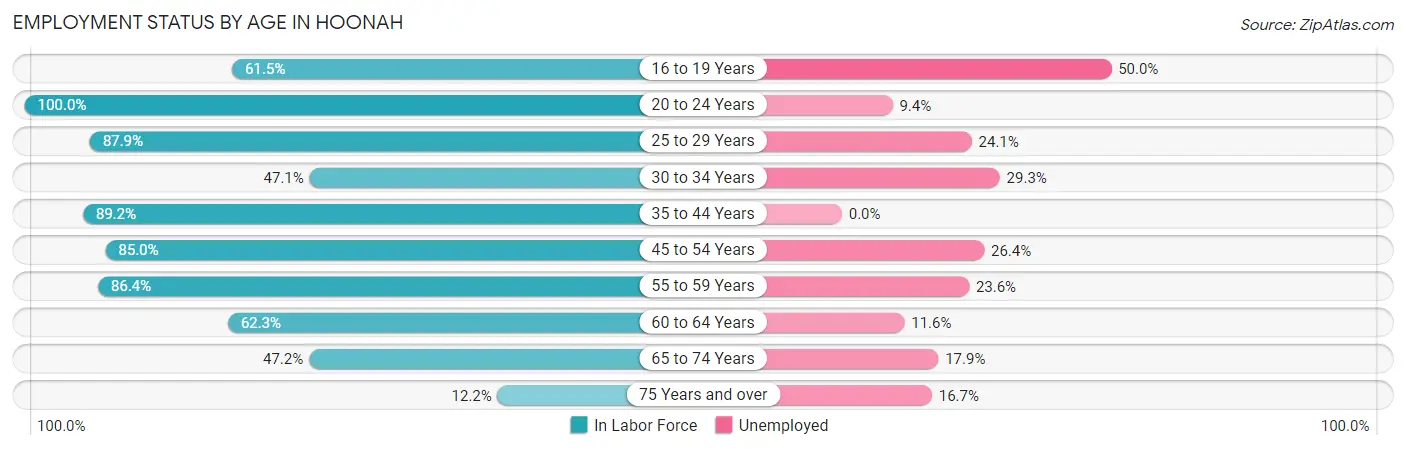
| Age Bracket | In Labor Force | Unemployed |
| 16 to 19 Years | 8 (61.5%) | 4 (50.0%) |
| 20 to 24 Years | 64 (100.0%) | 6 (9.4%) |
| 25 to 29 Years | 58 (87.9%) | 14 (24.1%) |
| 30 to 34 Years | 41 (47.1%) | 12 (29.3%) |
| 35 to 44 Years | 66 (89.2%) | 0 (0.0%) |
| 45 to 54 Years | 91 (85.0%) | 24 (26.4%) |
| 55 to 59 Years | 89 (86.4%) | 21 (23.6%) |
| 60 to 64 Years | 43 (62.3%) | 5 (11.6%) |
| 65 to 74 Years | 67 (47.2%) | 12 (17.9%) |
| 75 Years and over | 6 (12.2%) | 1 (16.7%) |
| Total | 533 (68.9%) | 99 (18.6%) |
Employment Status by Educational Attainment in Hoonah
According to labor force statistics for Hoonah, 76.7% of individuals (388) out of the total population between 25 and 64 years of age (506) are in the labor force, with 19.6% or 76 of them being unemployed. The group with the highest labor force participation rate are those with the educational attainment of bachelor's degree or higher, with 91.3% or 73 individuals in the labor force. Within the labor force, individuals with high school diploma education have the highest percentage of unemployment, with 29.2% or 49 of them being unemployed.
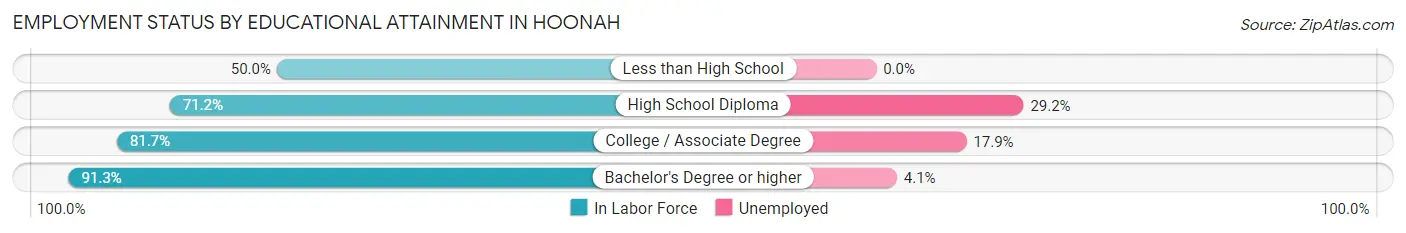
| Educational Attainment | In Labor Force | Unemployed |
| Less than High School | 13 (50.0%) | 0 (0.0%) |
| High School Diploma | 168 (71.2%) | 69 (29.2%) |
| College / Associate Degree | 134 (81.7%) | 29 (17.9%) |
| Bachelor's Degree or higher | 73 (91.3%) | 3 (4.1%) |
| Total | 388 (76.7%) | 99 (19.6%) |
Employment Occupations by Sex in Hoonah
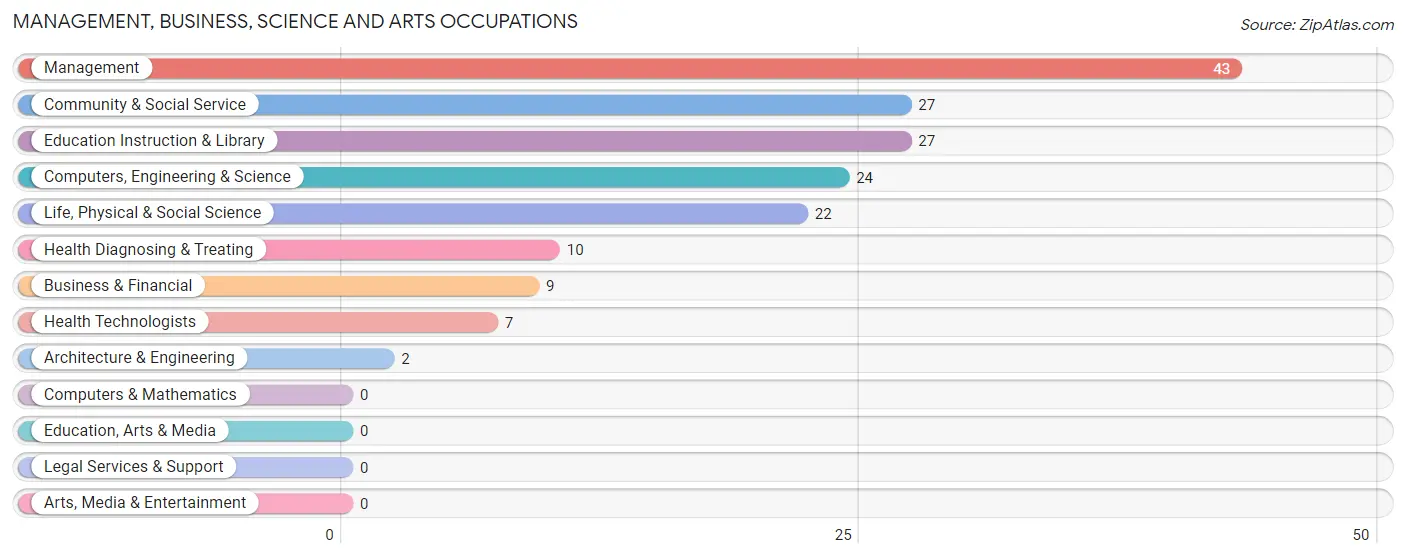
Management, Business, Science and Arts Occupations
The most common Management, Business, Science and Arts occupations in Hoonah are Management (43 | 9.9%), Community & Social Service (27 | 6.2%), Education Instruction & Library (27 | 6.2%), Computers, Engineering & Science (24 | 5.5%), and Life, Physical & Social Science (22 | 5.1%).
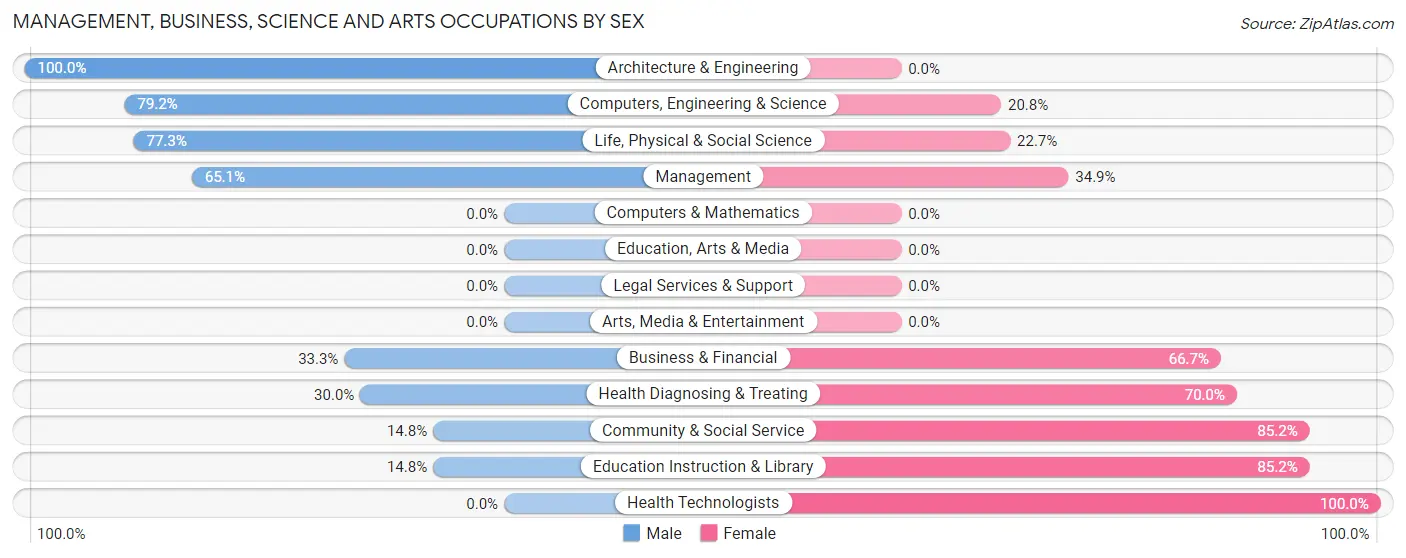
Management, Business, Science and Arts Occupations by Sex
Within the Management, Business, Science and Arts occupations in Hoonah, the most male-oriented occupations are Architecture & Engineering (100.0%), Computers, Engineering & Science (79.2%), and Life, Physical & Social Science (77.3%), while the most female-oriented occupations are Health Technologists (100.0%), Community & Social Service (85.2%), and Education Instruction & Library (85.2%).
| Occupation | Male | Female |
| Management | 28 (65.1%) | 15 (34.9%) |
| Business & Financial | 3 (33.3%) | 6 (66.7%) |
| Computers, Engineering & Science | 19 (79.2%) | 5 (20.8%) |
| Computers & Mathematics | 0 (0.0%) | 0 (0.0%) |
| Architecture & Engineering | 2 (100.0%) | 0 (0.0%) |
| Life, Physical & Social Science | 17 (77.3%) | 5 (22.7%) |
| Community & Social Service | 4 (14.8%) | 23 (85.2%) |
| Education, Arts & Media | 0 (0.0%) | 0 (0.0%) |
| Legal Services & Support | 0 (0.0%) | 0 (0.0%) |
| Education Instruction & Library | 4 (14.8%) | 23 (85.2%) |
| Arts, Media & Entertainment | 0 (0.0%) | 0 (0.0%) |
| Health Diagnosing & Treating | 3 (30.0%) | 7 (70.0%) |
| Health Technologists | 0 (0.0%) | 7 (100.0%) |
| Total (Category) | 57 (50.4%) | 56 (49.6%) |
| Total (Overall) | 280 (64.5%) | 154 (35.5%) |
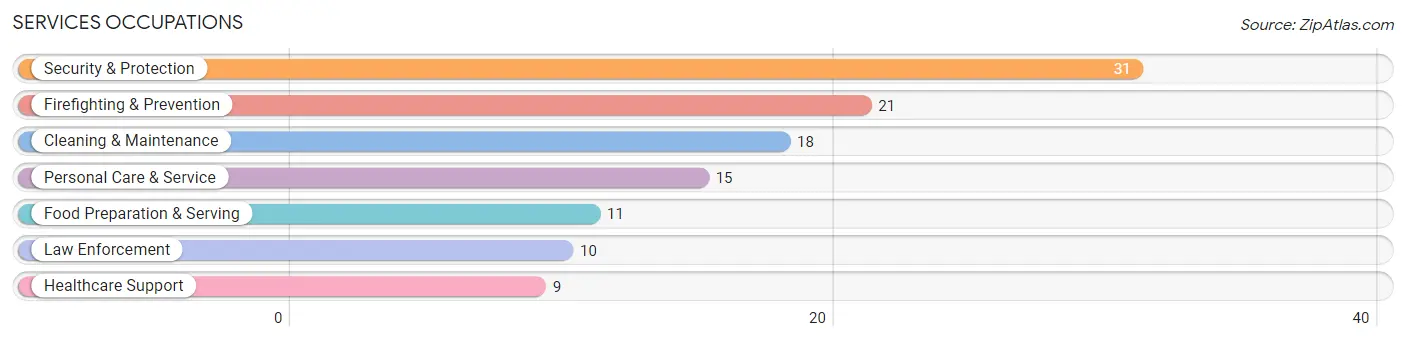
Services Occupations
The most common Services occupations in Hoonah are Security & Protection (31 | 7.1%), Firefighting & Prevention (21 | 4.8%), Cleaning & Maintenance (18 | 4.2%), Personal Care & Service (15 | 3.5%), and Food Preparation & Serving (11 | 2.5%).
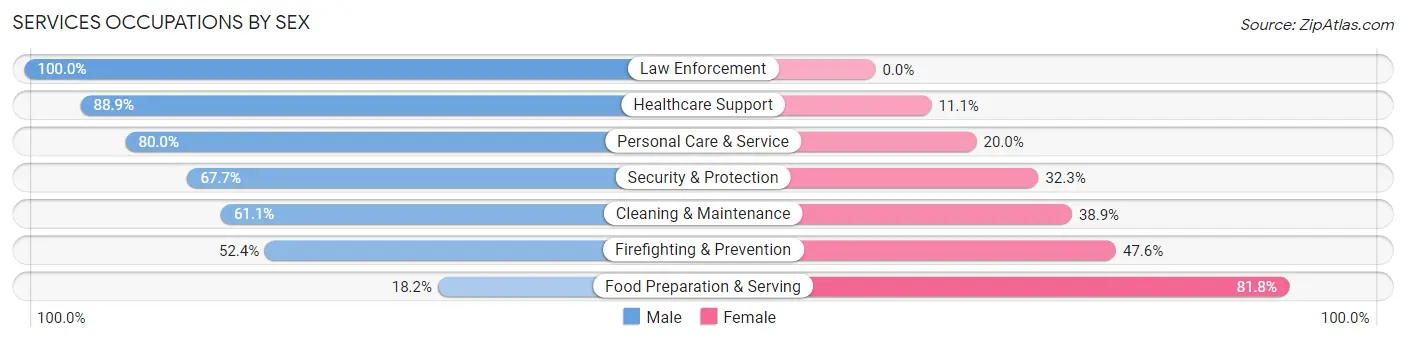
Services Occupations by Sex
Within the Services occupations in Hoonah, the most male-oriented occupations are Law Enforcement (100.0%), Healthcare Support (88.9%), and Personal Care & Service (80.0%), while the most female-oriented occupations are Food Preparation & Serving (81.8%), Firefighting & Prevention (47.6%), and Cleaning & Maintenance (38.9%).
| Occupation | Male | Female |
| Healthcare Support | 8 (88.9%) | 1 (11.1%) |
| Security & Protection | 21 (67.7%) | 10 (32.3%) |
| Firefighting & Prevention | 11 (52.4%) | 10 (47.6%) |
| Law Enforcement | 10 (100.0%) | 0 (0.0%) |
| Food Preparation & Serving | 2 (18.2%) | 9 (81.8%) |
| Cleaning & Maintenance | 11 (61.1%) | 7 (38.9%) |
| Personal Care & Service | 12 (80.0%) | 3 (20.0%) |
| Total (Category) | 54 (64.3%) | 30 (35.7%) |
| Total (Overall) | 280 (64.5%) | 154 (35.5%) |
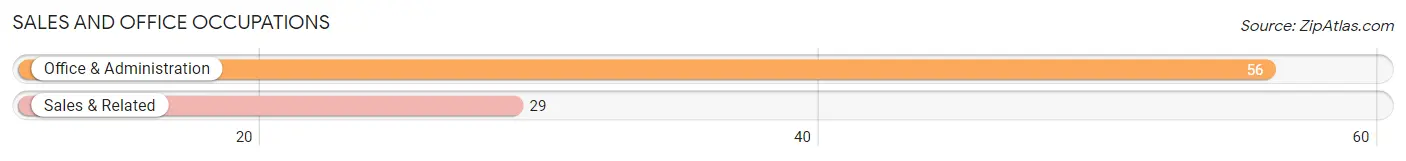
Sales and Office Occupations
The most common Sales and Office occupations in Hoonah are Office & Administration (56 | 12.9%), and Sales & Related (29 | 6.7%).
Sales and Office Occupations by Sex
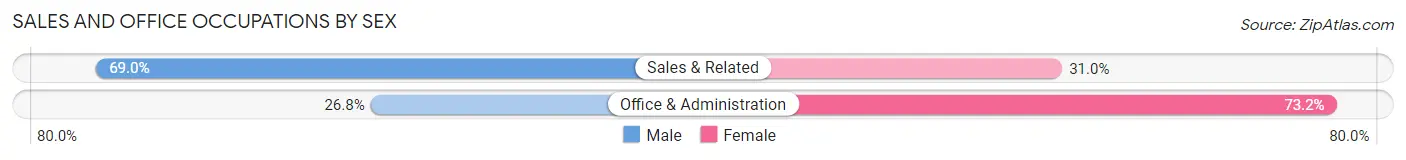
| Occupation | Male | Female |
| Sales & Related | 20 (69.0%) | 9 (31.0%) |
| Office & Administration | 15 (26.8%) | 41 (73.2%) |
| Total (Category) | 35 (41.2%) | 50 (58.8%) |
| Total (Overall) | 280 (64.5%) | 154 (35.5%) |
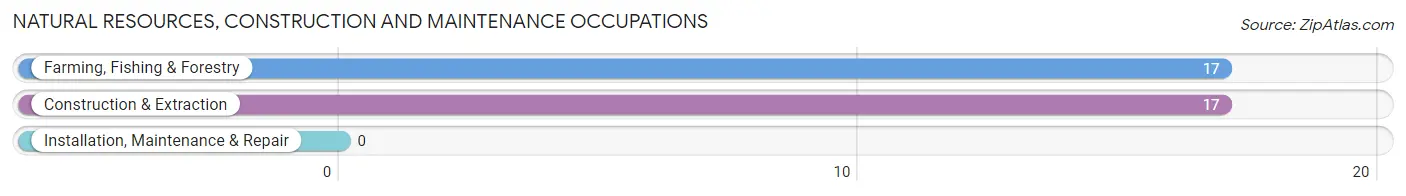
Natural Resources, Construction and Maintenance Occupations
The most common Natural Resources, Construction and Maintenance occupations in Hoonah are Farming, Fishing & Forestry (17 | 3.9%), and Construction & Extraction (17 | 3.9%).
Natural Resources, Construction and Maintenance Occupations by Sex
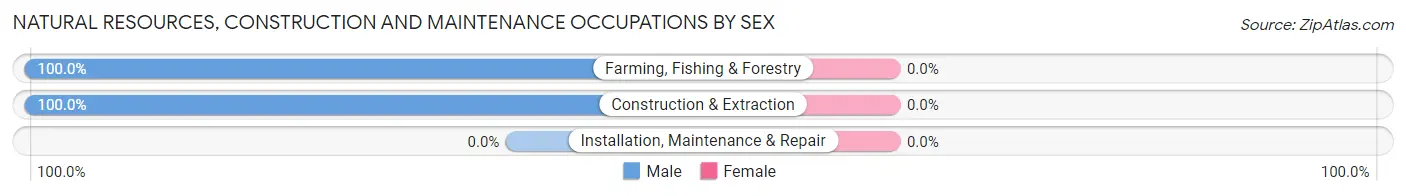
| Occupation | Male | Female |
| Farming, Fishing & Forestry | 17 (100.0%) | 0 (0.0%) |
| Construction & Extraction | 17 (100.0%) | 0 (0.0%) |
| Installation, Maintenance & Repair | 0 (0.0%) | 0 (0.0%) |
| Total (Category) | 34 (100.0%) | 0 (0.0%) |
| Total (Overall) | 280 (64.5%) | 154 (35.5%) |
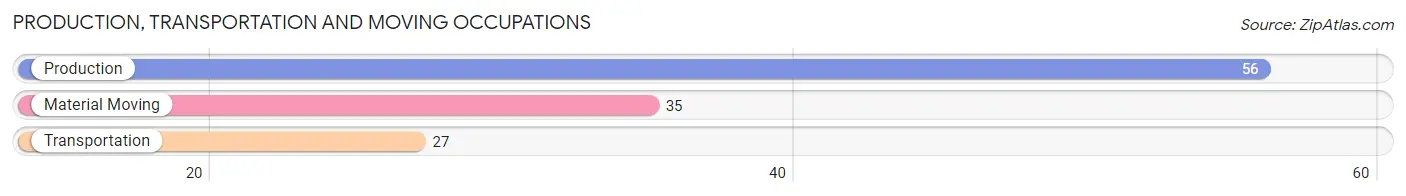
Production, Transportation and Moving Occupations
The most common Production, Transportation and Moving occupations in Hoonah are Production (56 | 12.9%), Material Moving (35 | 8.1%), and Transportation (27 | 6.2%).
Production, Transportation and Moving Occupations by Sex
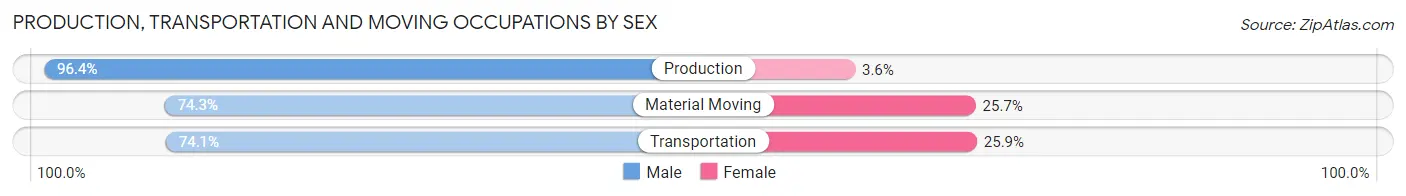
| Occupation | Male | Female |
| Production | 54 (96.4%) | 2 (3.6%) |
| Transportation | 20 (74.1%) | 7 (25.9%) |
| Material Moving | 26 (74.3%) | 9 (25.7%) |
| Total (Category) | 100 (84.8%) | 18 (15.2%) |
| Total (Overall) | 280 (64.5%) | 154 (35.5%) |
Employment Industries by Sex in Hoonah
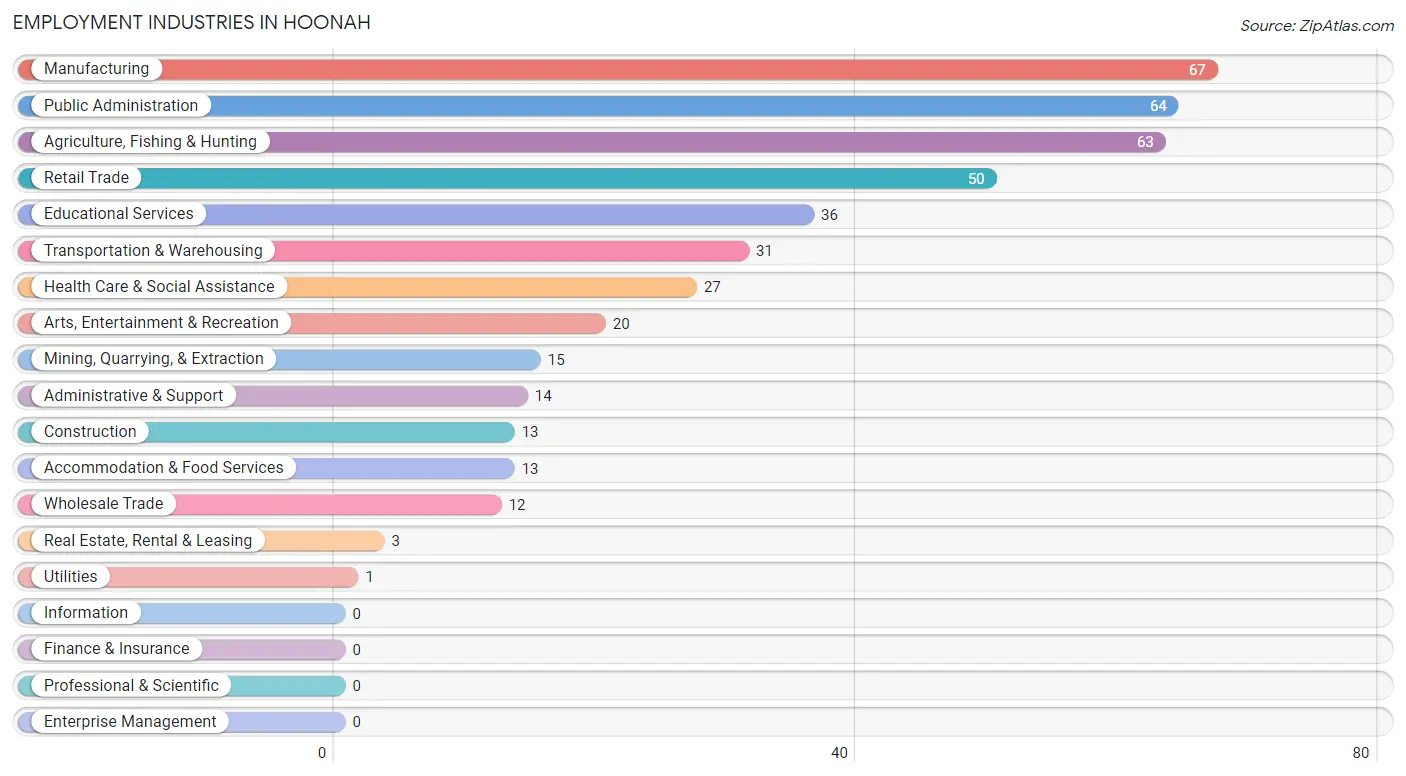
Employment Industries in Hoonah
The major employment industries in Hoonah include Manufacturing (67 | 15.4%), Public Administration (64 | 14.7%), Agriculture, Fishing & Hunting (63 | 14.5%), Retail Trade (50 | 11.5%), and Educational Services (36 | 8.3%).
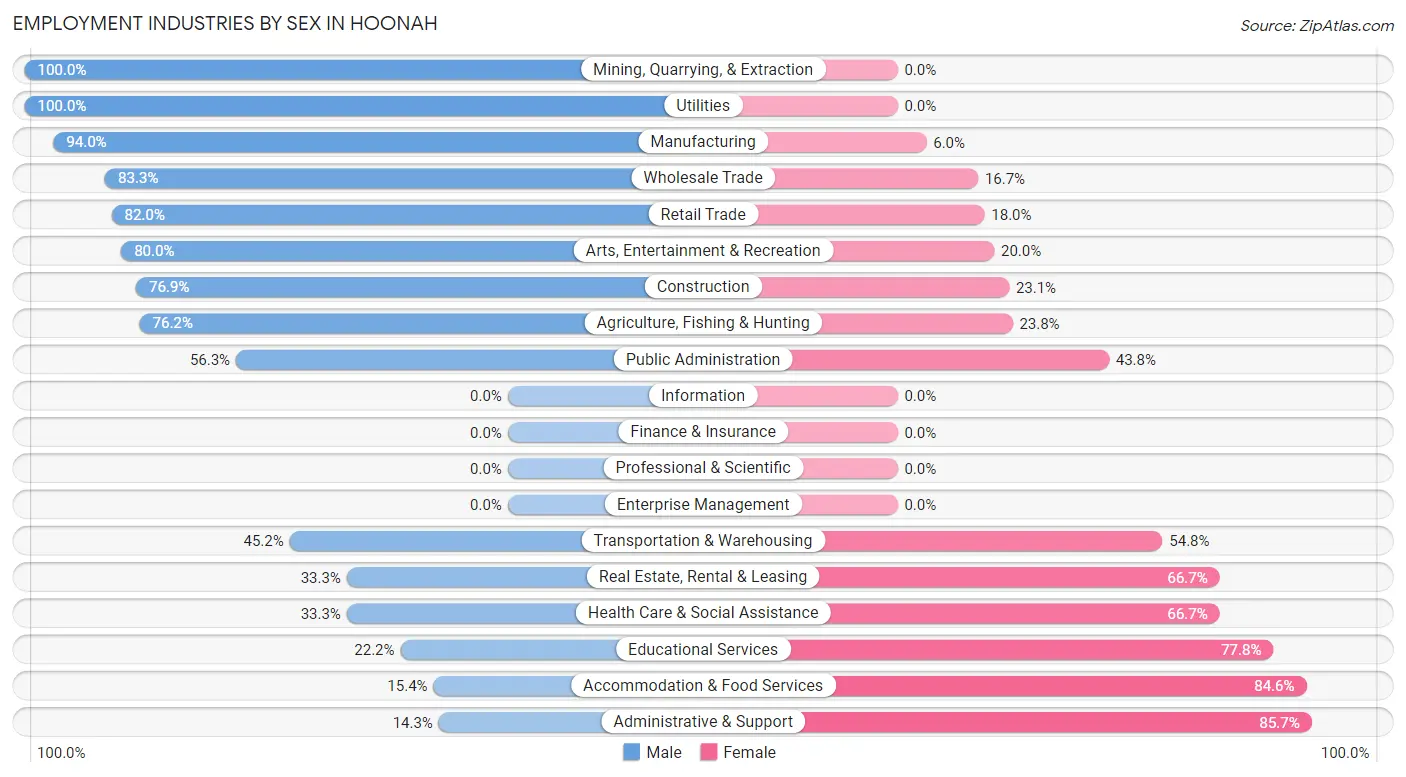
Employment Industries by Sex in Hoonah
The Hoonah industries that see more men than women are Mining, Quarrying, & Extraction (100.0%), Utilities (100.0%), and Manufacturing (94.0%), whereas the industries that tend to have a higher number of women are Administrative & Support (85.7%), Accommodation & Food Services (84.6%), and Educational Services (77.8%).
| Industry | Male | Female |
| Agriculture, Fishing & Hunting | 48 (76.2%) | 15 (23.8%) |
| Mining, Quarrying, & Extraction | 15 (100.0%) | 0 (0.0%) |
| Construction | 10 (76.9%) | 3 (23.1%) |
| Manufacturing | 63 (94.0%) | 4 (6.0%) |
| Wholesale Trade | 10 (83.3%) | 2 (16.7%) |
| Retail Trade | 41 (82.0%) | 9 (18.0%) |
| Transportation & Warehousing | 14 (45.2%) | 17 (54.8%) |
| Utilities | 1 (100.0%) | 0 (0.0%) |
| Information | 0 (0.0%) | 0 (0.0%) |
| Finance & Insurance | 0 (0.0%) | 0 (0.0%) |
| Real Estate, Rental & Leasing | 1 (33.3%) | 2 (66.7%) |
| Professional & Scientific | 0 (0.0%) | 0 (0.0%) |
| Enterprise Management | 0 (0.0%) | 0 (0.0%) |
| Administrative & Support | 2 (14.3%) | 12 (85.7%) |
| Educational Services | 8 (22.2%) | 28 (77.8%) |
| Health Care & Social Assistance | 9 (33.3%) | 18 (66.7%) |
| Arts, Entertainment & Recreation | 16 (80.0%) | 4 (20.0%) |
| Accommodation & Food Services | 2 (15.4%) | 11 (84.6%) |
| Public Administration | 36 (56.2%) | 28 (43.8%) |
| Total | 280 (64.5%) | 154 (35.5%) |
Education in Hoonah
School Enrollment in Hoonah
The most common levels of schooling among the 117 students in Hoonah are middle school (35 | 29.9%), elementary school (32 | 27.4%), and college / undergraduate (15 | 12.8%).
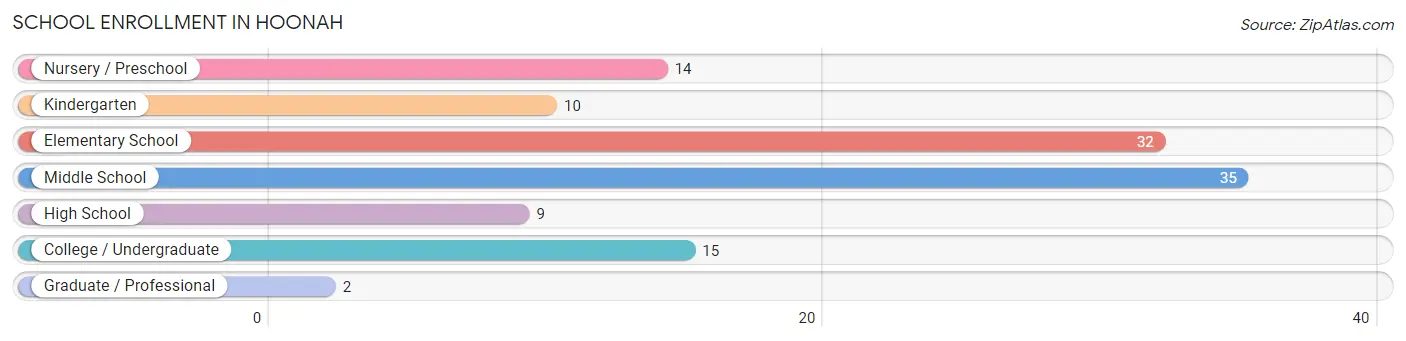
| School Level | # Students | % Students |
| Nursery / Preschool | 14 | 12.0% |
| Kindergarten | 10 | 8.6% |
| Elementary School | 32 | 27.4% |
| Middle School | 35 | 29.9% |
| High School | 9 | 7.7% |
| College / Undergraduate | 15 | 12.8% |
| Graduate / Professional | 2 | 1.7% |
| Total | 117 | 100.0% |
School Enrollment by Age by Funding Source in Hoonah
Out of a total of 117 students who are enrolled in schools in Hoonah, 23 (19.7%) attend a private institution, while the remaining 94 (80.3%) are enrolled in public schools. The age group of 3 to 4 year olds has the highest likelihood of being enrolled in private schools, with 4 (30.8% in the age bracket) enrolled. Conversely, the age group of 15 to 17 year olds has the lowest likelihood of being enrolled in a private school, with 5 (100.0% in the age bracket) attending a public institution.
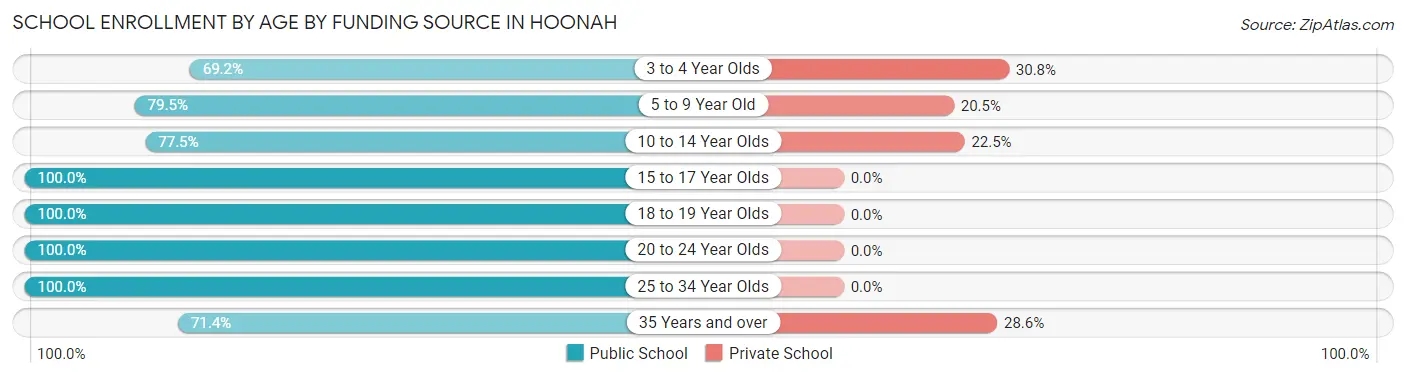
| Age Bracket | Public School | Private School |
| 3 to 4 Year Olds | 9 (69.2%) | 4 (30.8%) |
| 5 to 9 Year Old | 31 (79.5%) | 8 (20.5%) |
| 10 to 14 Year Olds | 31 (77.5%) | 9 (22.5%) |
| 15 to 17 Year Olds | 5 (100.0%) | 0 (0.0%) |
| 18 to 19 Year Olds | 7 (100.0%) | 0 (0.0%) |
| 20 to 24 Year Olds | 4 (100.0%) | 0 (0.0%) |
| 25 to 34 Year Olds | 2 (100.0%) | 0 (0.0%) |
| 35 Years and over | 5 (71.4%) | 2 (28.6%) |
| Total | 94 (80.3%) | 23 (19.7%) |
Educational Attainment by Field of Study in Hoonah
Bio, nature & agricultural (58 | 39.5%), education (35 | 23.8%), business (18 | 12.2%), science & technology (10 | 6.8%), and social sciences (9 | 6.1%) are the most common fields of study among 147 individuals in Hoonah who have obtained a bachelor's degree or higher.
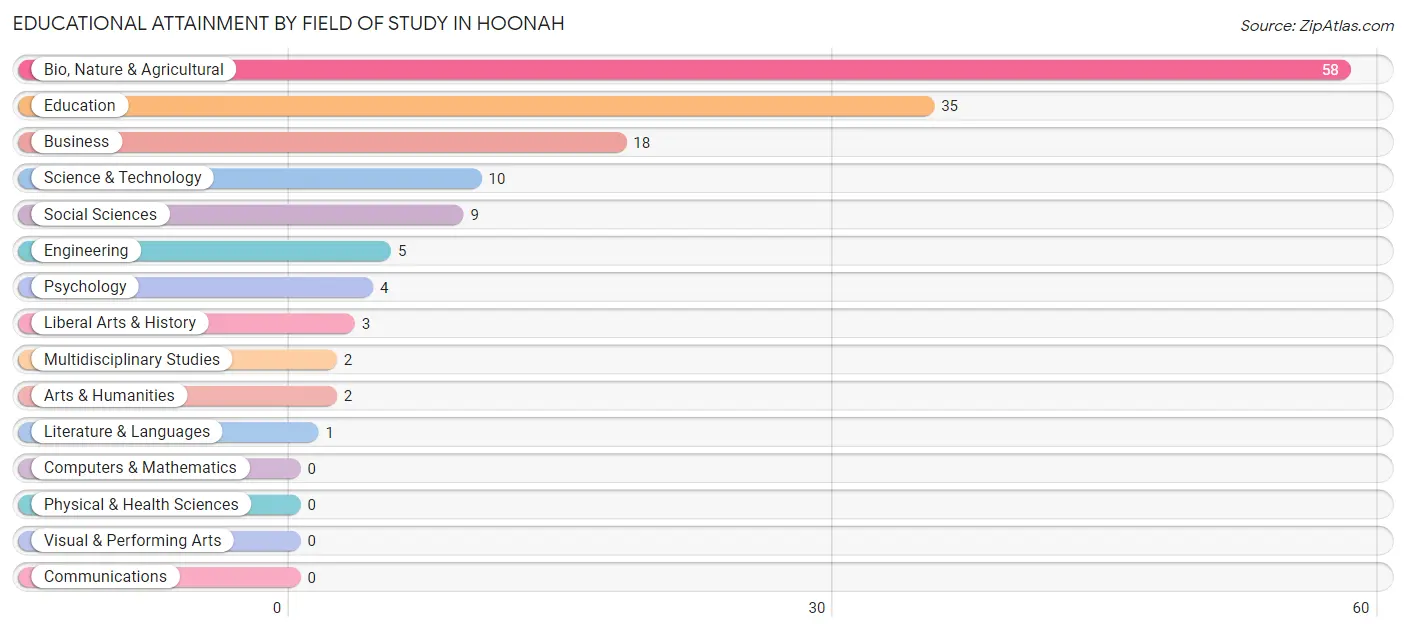
| Field of Study | # Graduates | % Graduates |
| Computers & Mathematics | 0 | 0.0% |
| Bio, Nature & Agricultural | 58 | 39.5% |
| Physical & Health Sciences | 0 | 0.0% |
| Psychology | 4 | 2.7% |
| Social Sciences | 9 | 6.1% |
| Engineering | 5 | 3.4% |
| Multidisciplinary Studies | 2 | 1.4% |
| Science & Technology | 10 | 6.8% |
| Business | 18 | 12.2% |
| Education | 35 | 23.8% |
| Literature & Languages | 1 | 0.7% |
| Liberal Arts & History | 3 | 2.0% |
| Visual & Performing Arts | 0 | 0.0% |
| Communications | 0 | 0.0% |
| Arts & Humanities | 2 | 1.4% |
| Total | 147 | 100.0% |
Transportation & Commute in Hoonah
Vehicle Availability by Sex in Hoonah
The most prevalent vehicle ownership categories in Hoonah are males with 2 vehicles (63, accounting for 36.2%) and females with 2 vehicles (73, making up 44.4%).
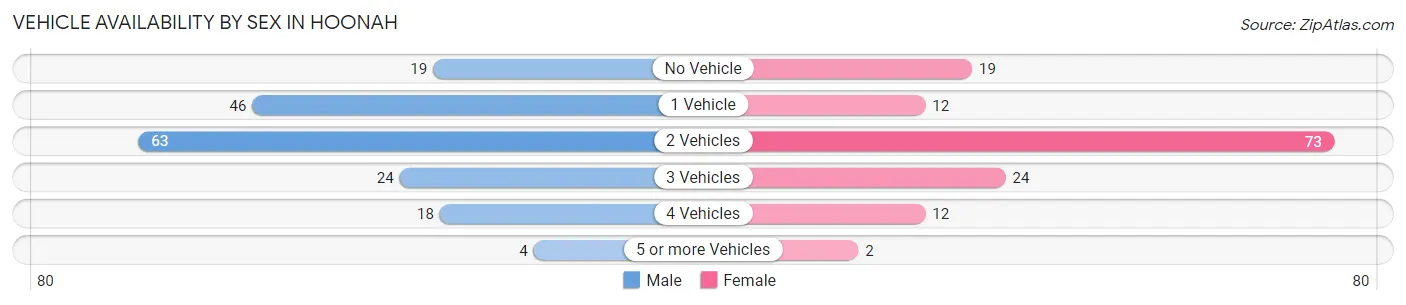
| Vehicles Available | Male | Female |
| No Vehicle | 19 (10.9%) | 19 (13.4%) |
| 1 Vehicle | 46 (26.4%) | 12 (8.5%) |
| 2 Vehicles | 63 (36.2%) | 73 (51.4%) |
| 3 Vehicles | 24 (13.8%) | 24 (16.9%) |
| 4 Vehicles | 18 (10.3%) | 12 (8.5%) |
| 5 or more Vehicles | 4 (2.3%) | 2 (1.4%) |
| Total | 174 (100.0%) | 142 (100.0%) |
Commute Time in Hoonah
The most frequently occuring commute durations in Hoonah are 5 to 9 minutes (160 commuters, 39.0%), less than 5 minutes (133 commuters, 32.4%), and 10 to 14 minutes (52 commuters, 12.7%).
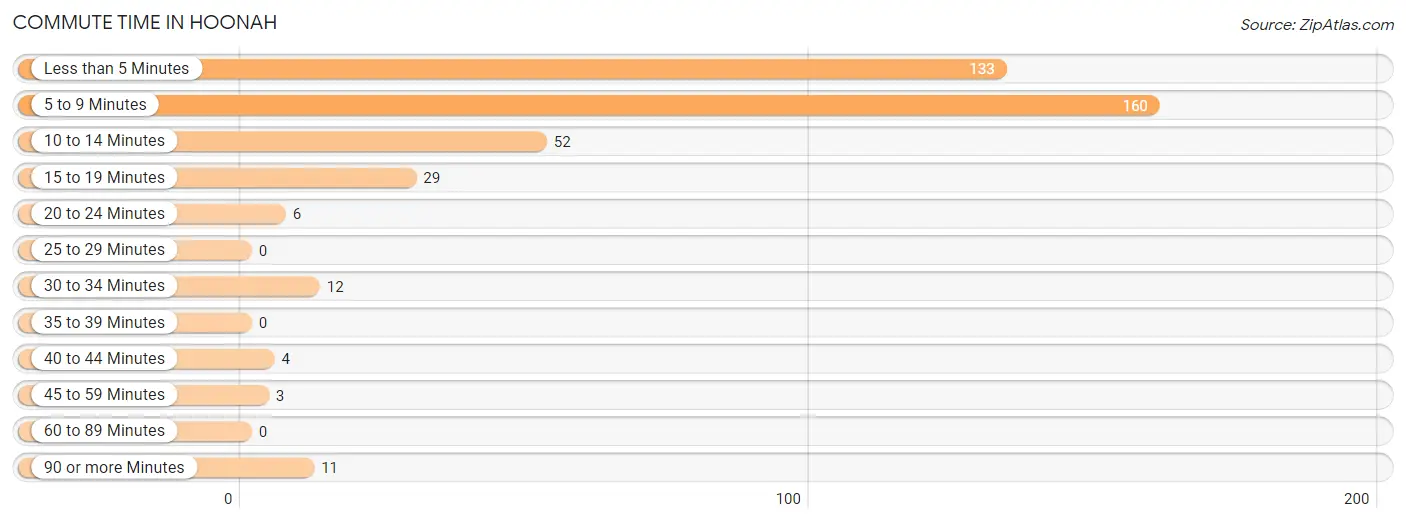
| Commute Time | # Commuters | % Commuters |
| Less than 5 Minutes | 133 | 32.4% |
| 5 to 9 Minutes | 160 | 39.0% |
| 10 to 14 Minutes | 52 | 12.7% |
| 15 to 19 Minutes | 29 | 7.1% |
| 20 to 24 Minutes | 6 | 1.5% |
| 25 to 29 Minutes | 0 | 0.0% |
| 30 to 34 Minutes | 12 | 2.9% |
| 35 to 39 Minutes | 0 | 0.0% |
| 40 to 44 Minutes | 4 | 1.0% |
| 45 to 59 Minutes | 3 | 0.7% |
| 60 to 89 Minutes | 0 | 0.0% |
| 90 or more Minutes | 11 | 2.7% |
Commute Time by Sex in Hoonah
The most common commute times in Hoonah are less than 5 minutes (99 commuters, 37.5%) for males and 5 to 9 minutes (70 commuters, 47.9%) for females.
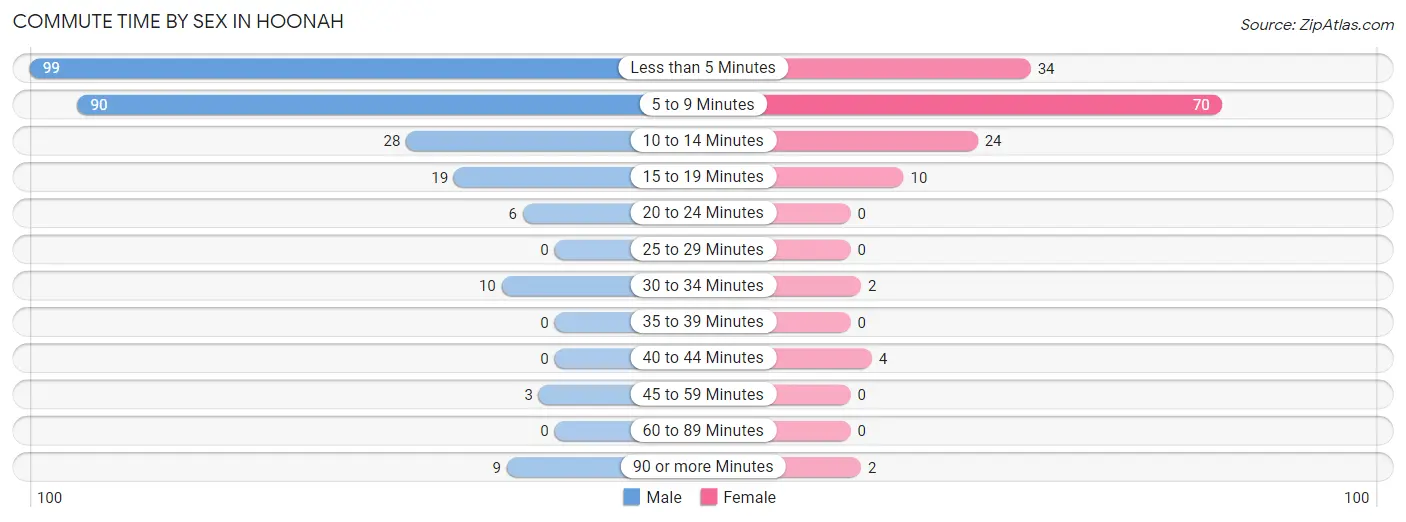
| Commute Time | Male | Female |
| Less than 5 Minutes | 99 (37.5%) | 34 (23.3%) |
| 5 to 9 Minutes | 90 (34.1%) | 70 (47.9%) |
| 10 to 14 Minutes | 28 (10.6%) | 24 (16.4%) |
| 15 to 19 Minutes | 19 (7.2%) | 10 (6.9%) |
| 20 to 24 Minutes | 6 (2.3%) | 0 (0.0%) |
| 25 to 29 Minutes | 0 (0.0%) | 0 (0.0%) |
| 30 to 34 Minutes | 10 (3.8%) | 2 (1.4%) |
| 35 to 39 Minutes | 0 (0.0%) | 0 (0.0%) |
| 40 to 44 Minutes | 0 (0.0%) | 4 (2.7%) |
| 45 to 59 Minutes | 3 (1.1%) | 0 (0.0%) |
| 60 to 89 Minutes | 0 (0.0%) | 0 (0.0%) |
| 90 or more Minutes | 9 (3.4%) | 2 (1.4%) |
Time of Departure to Work by Sex in Hoonah
The most frequent times of departure to work in Hoonah are 8:00 AM to 8:29 AM (59, 22.4%) for males and 7:30 AM to 7:59 AM (53, 36.3%) for females.
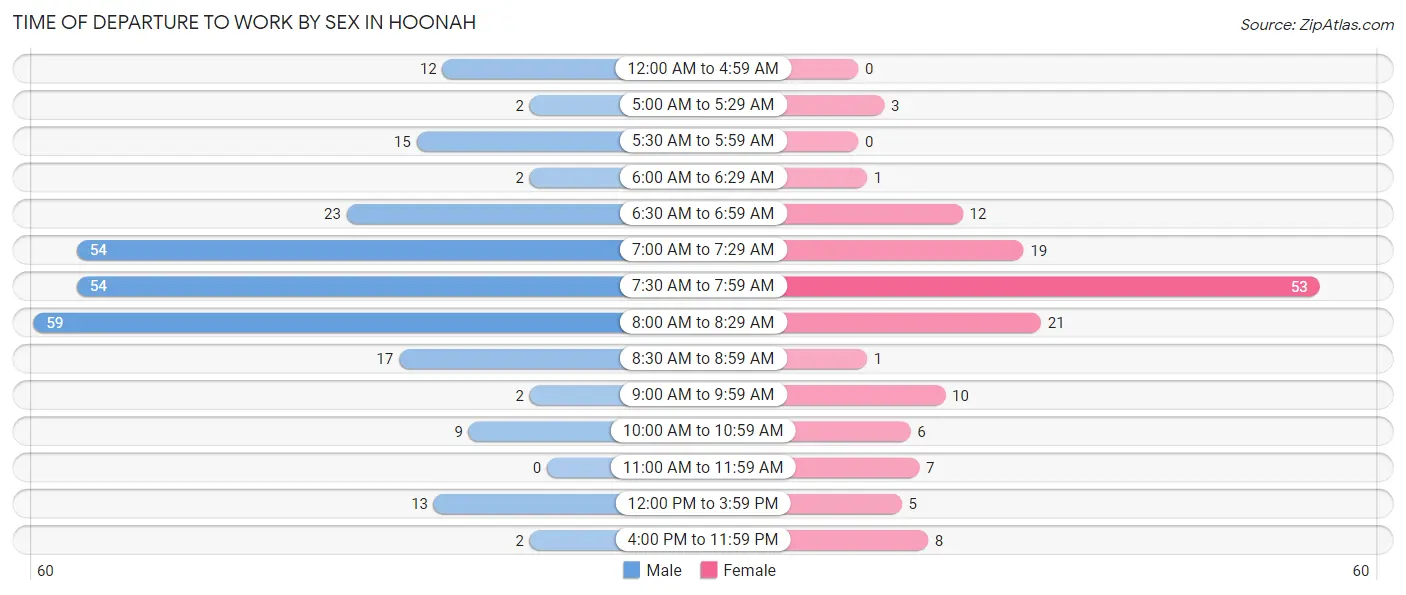
| Time of Departure | Male | Female |
| 12:00 AM to 4:59 AM | 12 (4.5%) | 0 (0.0%) |
| 5:00 AM to 5:29 AM | 2 (0.8%) | 3 (2.1%) |
| 5:30 AM to 5:59 AM | 15 (5.7%) | 0 (0.0%) |
| 6:00 AM to 6:29 AM | 2 (0.8%) | 1 (0.7%) |
| 6:30 AM to 6:59 AM | 23 (8.7%) | 12 (8.2%) |
| 7:00 AM to 7:29 AM | 54 (20.4%) | 19 (13.0%) |
| 7:30 AM to 7:59 AM | 54 (20.4%) | 53 (36.3%) |
| 8:00 AM to 8:29 AM | 59 (22.4%) | 21 (14.4%) |
| 8:30 AM to 8:59 AM | 17 (6.4%) | 1 (0.7%) |
| 9:00 AM to 9:59 AM | 2 (0.8%) | 10 (6.9%) |
| 10:00 AM to 10:59 AM | 9 (3.4%) | 6 (4.1%) |
| 11:00 AM to 11:59 AM | 0 (0.0%) | 7 (4.8%) |
| 12:00 PM to 3:59 PM | 13 (4.9%) | 5 (3.4%) |
| 4:00 PM to 11:59 PM | 2 (0.8%) | 8 (5.5%) |
| Total | 264 (100.0%) | 146 (100.0%) |
Housing Occupancy in Hoonah
Occupancy by Ownership in Hoonah
Of the total 269 dwellings in Hoonah, owner-occupied units account for 191 (71.0%), while renter-occupied units make up 78 (29.0%).
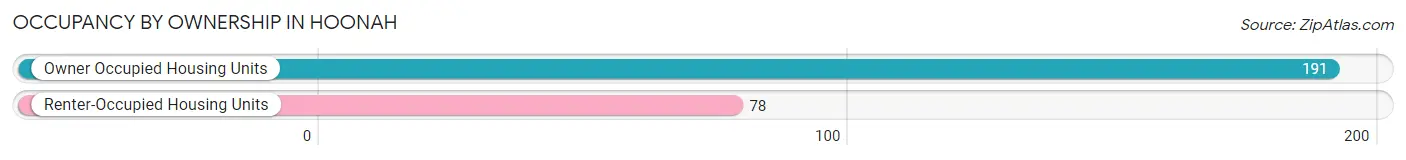
| Occupancy | # Housing Units | % Housing Units |
| Owner Occupied Housing Units | 191 | 71.0% |
| Renter-Occupied Housing Units | 78 | 29.0% |
| Total Occupied Housing Units | 269 | 100.0% |
Occupancy by Household Size in Hoonah
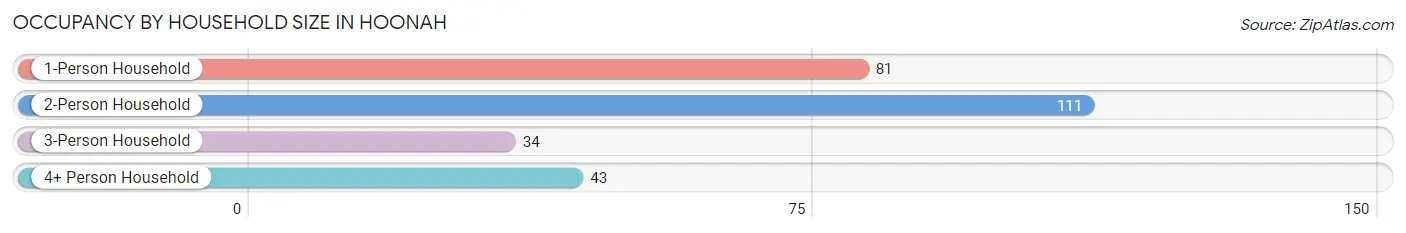
| Household Size | # Housing Units | % Housing Units |
| 1-Person Household | 81 | 30.1% |
| 2-Person Household | 111 | 41.3% |
| 3-Person Household | 34 | 12.6% |
| 4+ Person Household | 43 | 16.0% |
| Total Housing Units | 269 | 100.0% |
Occupancy by Ownership by Household Size in Hoonah
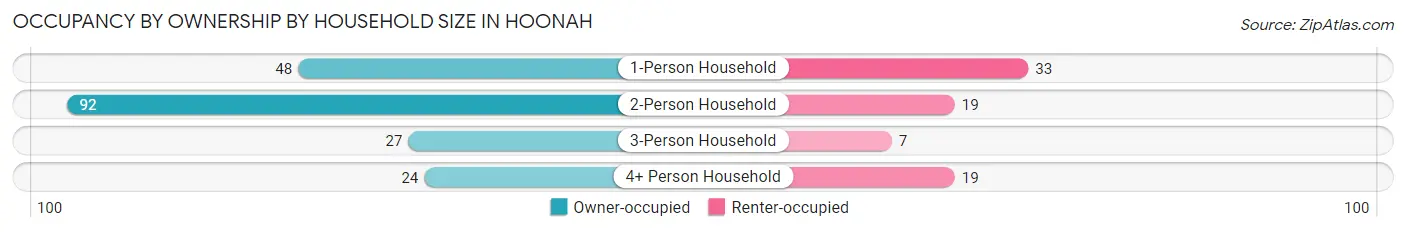
| Household Size | Owner-occupied | Renter-occupied |
| 1-Person Household | 48 (59.3%) | 33 (40.7%) |
| 2-Person Household | 92 (82.9%) | 19 (17.1%) |
| 3-Person Household | 27 (79.4%) | 7 (20.6%) |
| 4+ Person Household | 24 (55.8%) | 19 (44.2%) |
| Total Housing Units | 191 (71.0%) | 78 (29.0%) |
Occupancy by Educational Attainment in Hoonah
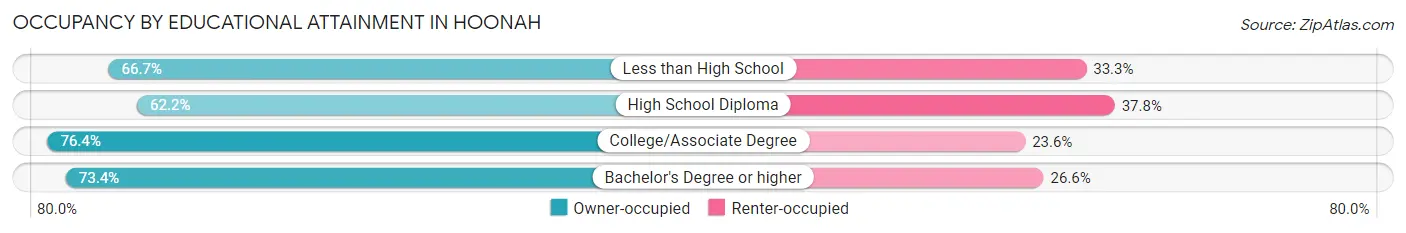
| Household Size | Owner-occupied | Renter-occupied |
| Less than High School | 14 (66.7%) | 7 (33.3%) |
| High School Diploma | 46 (62.2%) | 28 (37.8%) |
| College/Associate Degree | 84 (76.4%) | 26 (23.6%) |
| Bachelor's Degree or higher | 47 (73.4%) | 17 (26.6%) |
Occupancy by Age of Householder in Hoonah
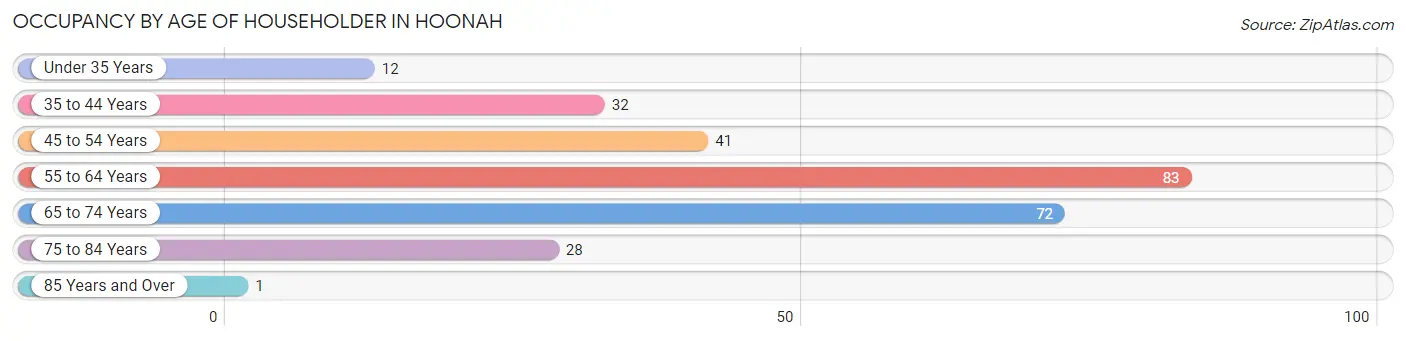
| Age Bracket | # Households | % Households |
| Under 35 Years | 12 | 4.5% |
| 35 to 44 Years | 32 | 11.9% |
| 45 to 54 Years | 41 | 15.2% |
| 55 to 64 Years | 83 | 30.9% |
| 65 to 74 Years | 72 | 26.8% |
| 75 to 84 Years | 28 | 10.4% |
| 85 Years and Over | 1 | 0.4% |
| Total | 269 | 100.0% |
Housing Finances in Hoonah
Median Income by Occupancy in Hoonah
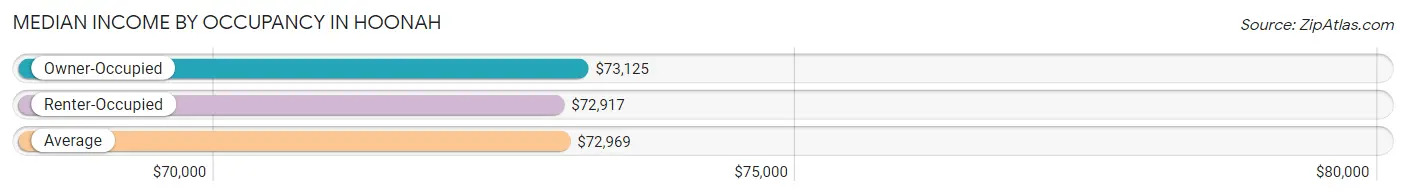
| Occupancy Type | # Households | Median Income |
| Owner-Occupied | 191 (71.0%) | $73,125 |
| Renter-Occupied | 78 (29.0%) | $72,917 |
| Average | 269 (100.0%) | $72,969 |
Occupancy by Householder Income Bracket in Hoonah
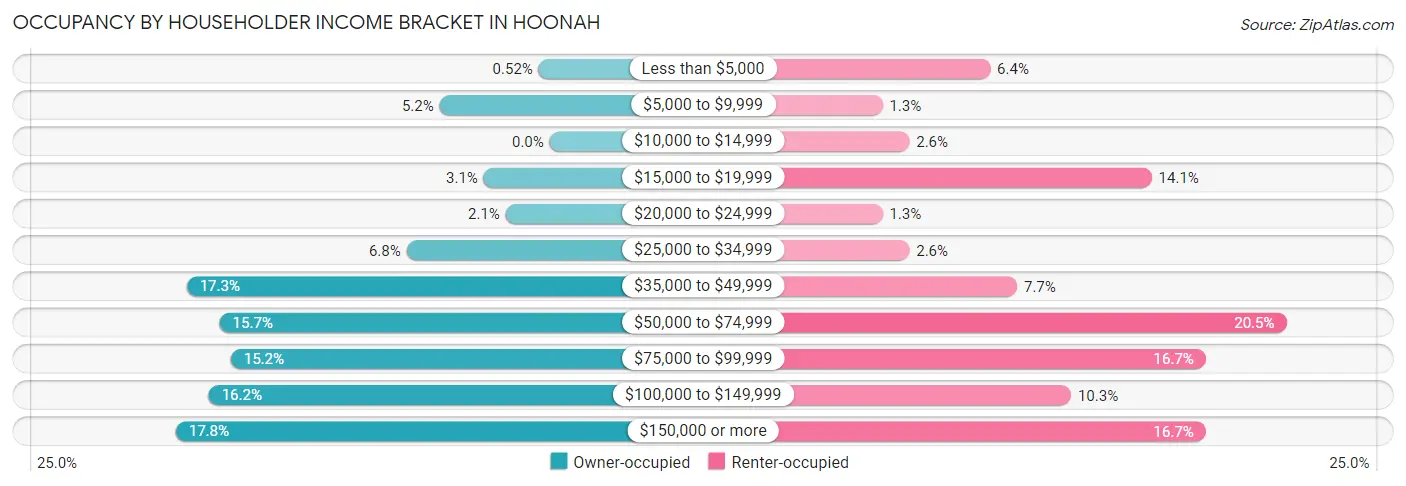
| Income Bracket | Owner-occupied | Renter-occupied |
| Less than $5,000 | 1 (0.5%) | 5 (6.4%) |
| $5,000 to $9,999 | 10 (5.2%) | 1 (1.3%) |
| $10,000 to $14,999 | 0 (0.0%) | 2 (2.6%) |
| $15,000 to $19,999 | 6 (3.1%) | 11 (14.1%) |
| $20,000 to $24,999 | 4 (2.1%) | 1 (1.3%) |
| $25,000 to $34,999 | 13 (6.8%) | 2 (2.6%) |
| $35,000 to $49,999 | 33 (17.3%) | 6 (7.7%) |
| $50,000 to $74,999 | 30 (15.7%) | 16 (20.5%) |
| $75,000 to $99,999 | 29 (15.2%) | 13 (16.7%) |
| $100,000 to $149,999 | 31 (16.2%) | 8 (10.3%) |
| $150,000 or more | 34 (17.8%) | 13 (16.7%) |
| Total | 191 (100.0%) | 78 (100.0%) |
Monthly Housing Cost Tiers in Hoonah
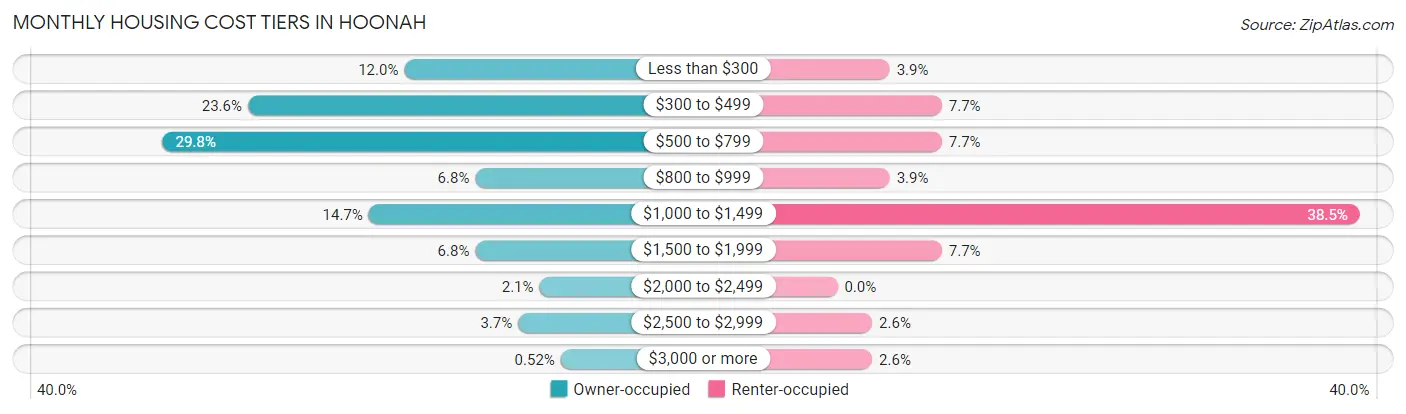
| Monthly Cost | Owner-occupied | Renter-occupied |
| Less than $300 | 23 (12.0%) | 3 (3.8%) |
| $300 to $499 | 45 (23.6%) | 6 (7.7%) |
| $500 to $799 | 57 (29.8%) | 6 (7.7%) |
| $800 to $999 | 13 (6.8%) | 3 (3.8%) |
| $1,000 to $1,499 | 28 (14.7%) | 30 (38.5%) |
| $1,500 to $1,999 | 13 (6.8%) | 6 (7.7%) |
| $2,000 to $2,499 | 4 (2.1%) | 0 (0.0%) |
| $2,500 to $2,999 | 7 (3.7%) | 2 (2.6%) |
| $3,000 or more | 1 (0.5%) | 2 (2.6%) |
| Total | 191 (100.0%) | 78 (100.0%) |
Physical Housing Characteristics in Hoonah
Housing Structures in Hoonah
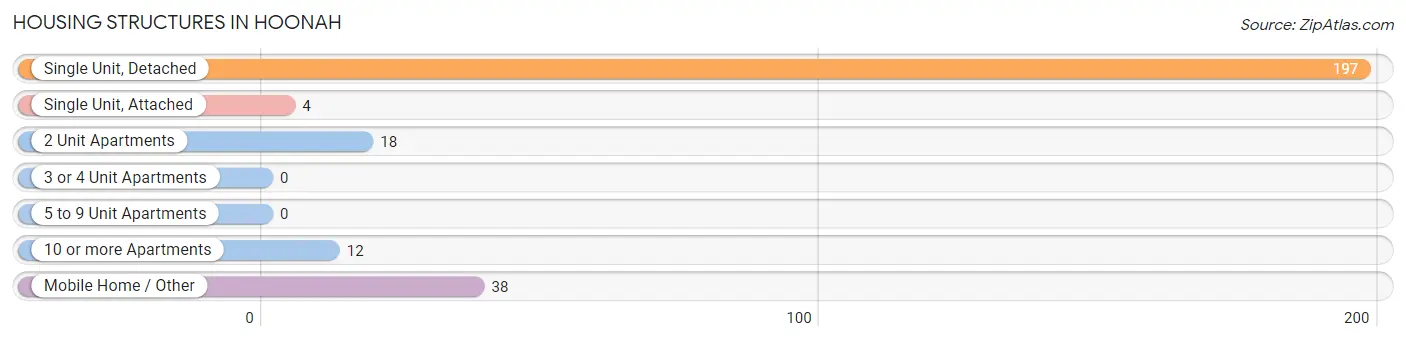
| Structure Type | # Housing Units | % Housing Units |
| Single Unit, Detached | 197 | 73.2% |
| Single Unit, Attached | 4 | 1.5% |
| 2 Unit Apartments | 18 | 6.7% |
| 3 or 4 Unit Apartments | 0 | 0.0% |
| 5 to 9 Unit Apartments | 0 | 0.0% |
| 10 or more Apartments | 12 | 4.5% |
| Mobile Home / Other | 38 | 14.1% |
| Total | 269 | 100.0% |
Housing Structures by Occupancy in Hoonah
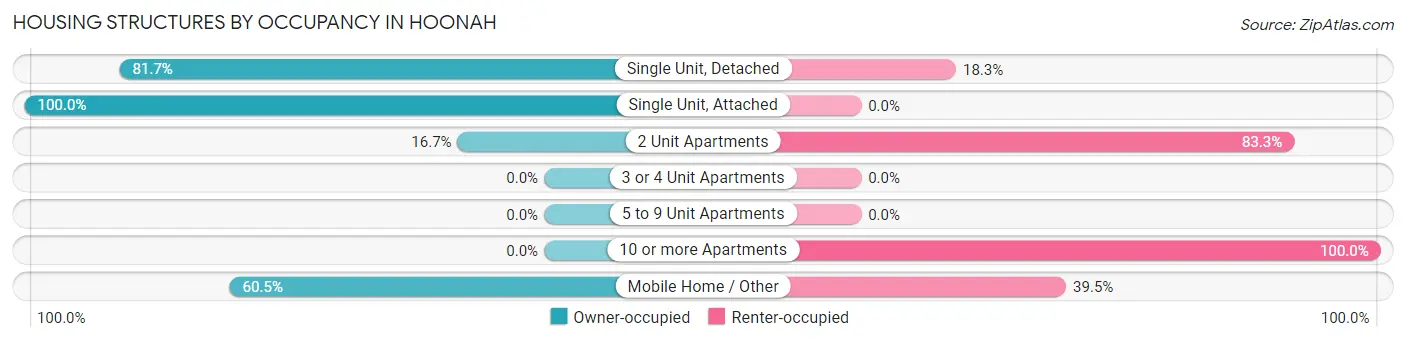
| Structure Type | Owner-occupied | Renter-occupied |
| Single Unit, Detached | 161 (81.7%) | 36 (18.3%) |
| Single Unit, Attached | 4 (100.0%) | 0 (0.0%) |
| 2 Unit Apartments | 3 (16.7%) | 15 (83.3%) |
| 3 or 4 Unit Apartments | 0 (0.0%) | 0 (0.0%) |
| 5 to 9 Unit Apartments | 0 (0.0%) | 0 (0.0%) |
| 10 or more Apartments | 0 (0.0%) | 12 (100.0%) |
| Mobile Home / Other | 23 (60.5%) | 15 (39.5%) |
| Total | 191 (71.0%) | 78 (29.0%) |
Housing Structures by Number of Rooms in Hoonah
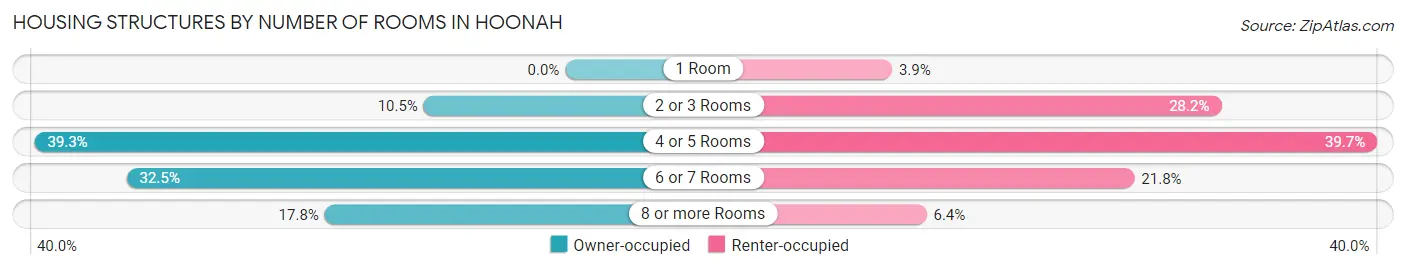
| Number of Rooms | Owner-occupied | Renter-occupied |
| 1 Room | 0 (0.0%) | 3 (3.8%) |
| 2 or 3 Rooms | 20 (10.5%) | 22 (28.2%) |
| 4 or 5 Rooms | 75 (39.3%) | 31 (39.7%) |
| 6 or 7 Rooms | 62 (32.5%) | 17 (21.8%) |
| 8 or more Rooms | 34 (17.8%) | 5 (6.4%) |
| Total | 191 (100.0%) | 78 (100.0%) |
Housing Structure by Heating Type in Hoonah
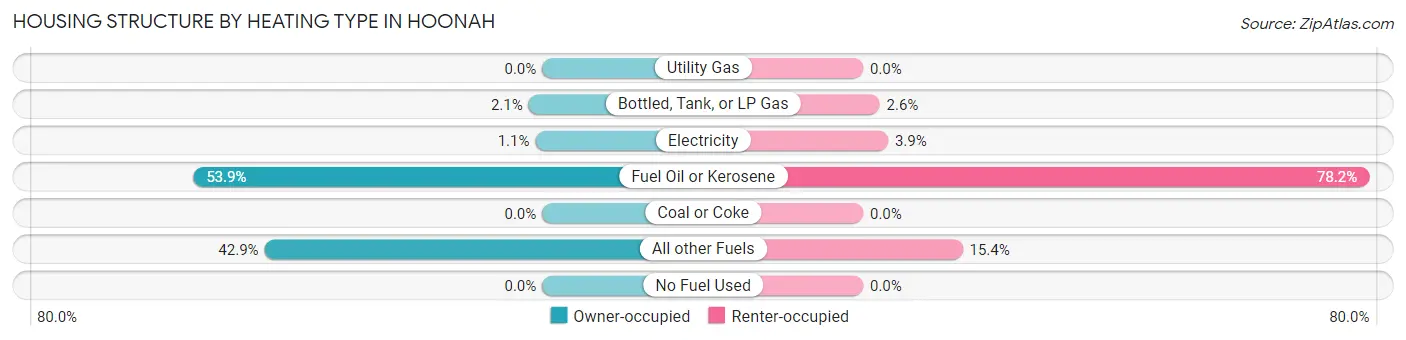
| Heating Type | Owner-occupied | Renter-occupied |
| Utility Gas | 0 (0.0%) | 0 (0.0%) |
| Bottled, Tank, or LP Gas | 4 (2.1%) | 2 (2.6%) |
| Electricity | 2 (1.1%) | 3 (3.8%) |
| Fuel Oil or Kerosene | 103 (53.9%) | 61 (78.2%) |
| Coal or Coke | 0 (0.0%) | 0 (0.0%) |
| All other Fuels | 82 (42.9%) | 12 (15.4%) |
| No Fuel Used | 0 (0.0%) | 0 (0.0%) |
| Total | 191 (100.0%) | 78 (100.0%) |
Household Vehicle Usage in Hoonah
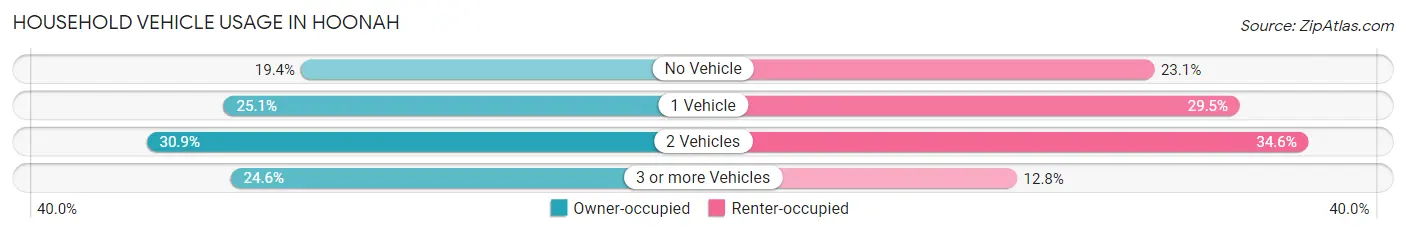
| Vehicles per Household | Owner-occupied | Renter-occupied |
| No Vehicle | 37 (19.4%) | 18 (23.1%) |
| 1 Vehicle | 48 (25.1%) | 23 (29.5%) |
| 2 Vehicles | 59 (30.9%) | 27 (34.6%) |
| 3 or more Vehicles | 47 (24.6%) | 10 (12.8%) |
| Total | 191 (100.0%) | 78 (100.0%) |
Real Estate & Mortgages in Hoonah
Real Estate and Mortgage Overview in Hoonah
| Characteristic | Without Mortgage | With Mortgage |
| Housing Units | 138 | 53 |
| Median Property Value | $227,400 | $342,500 |
| Median Household Income | $66,875 | $5 |
| Monthly Housing Costs | $508 | $1 |
| Real Estate Taxes | - | - |
Property Value by Mortgage Status in Hoonah
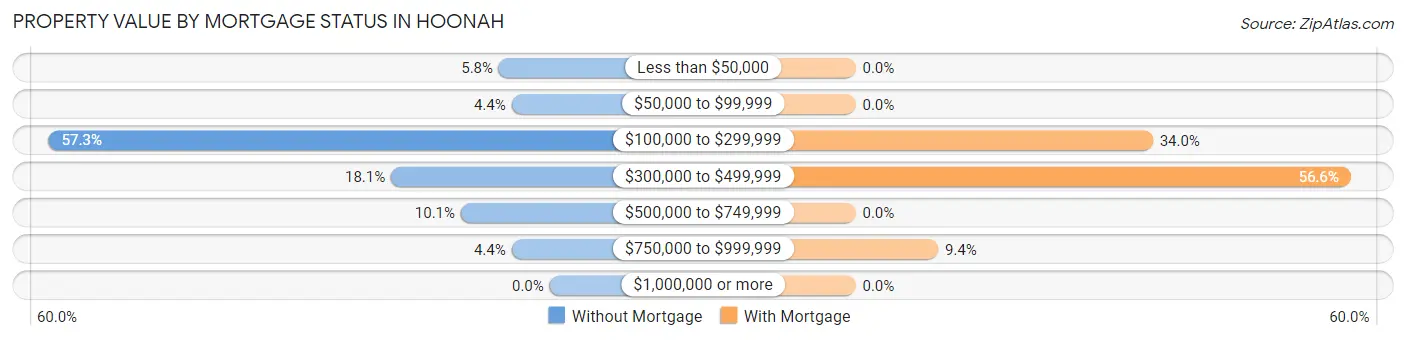
| Property Value | Without Mortgage | With Mortgage |
| Less than $50,000 | 8 (5.8%) | 0 (0.0%) |
| $50,000 to $99,999 | 6 (4.3%) | 0 (0.0%) |
| $100,000 to $299,999 | 79 (57.3%) | 18 (34.0%) |
| $300,000 to $499,999 | 25 (18.1%) | 30 (56.6%) |
| $500,000 to $749,999 | 14 (10.1%) | 0 (0.0%) |
| $750,000 to $999,999 | 6 (4.3%) | 5 (9.4%) |
| $1,000,000 or more | 0 (0.0%) | 0 (0.0%) |
| Total | 138 (100.0%) | 53 (100.0%) |
Household Income by Mortgage Status in Hoonah
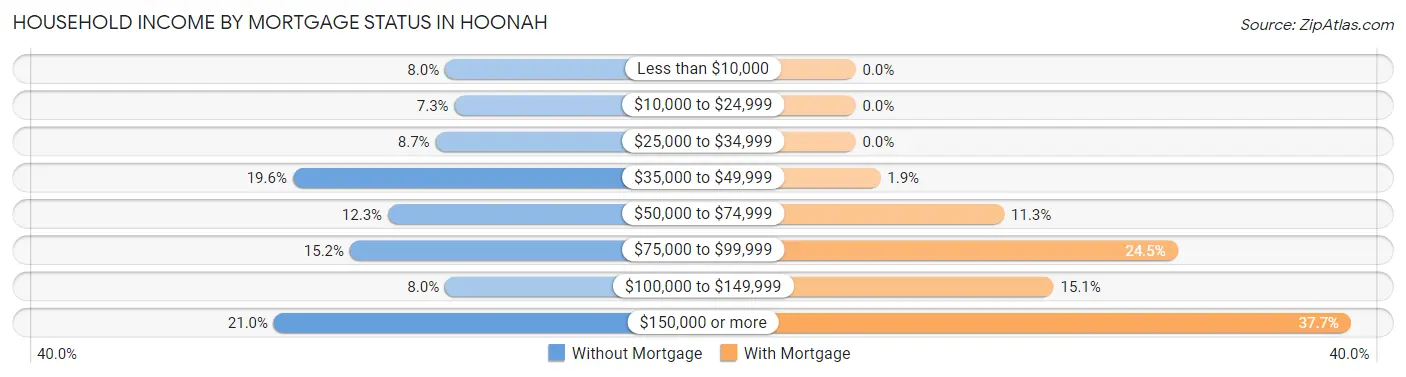
| Household Income | Without Mortgage | With Mortgage |
| Less than $10,000 | 11 (8.0%) | 0 (0.0%) |
| $10,000 to $24,999 | 10 (7.2%) | 0 (0.0%) |
| $25,000 to $34,999 | 12 (8.7%) | 0 (0.0%) |
| $35,000 to $49,999 | 27 (19.6%) | 1 (1.9%) |
| $50,000 to $74,999 | 17 (12.3%) | 6 (11.3%) |
| $75,000 to $99,999 | 21 (15.2%) | 13 (24.5%) |
| $100,000 to $149,999 | 11 (8.0%) | 8 (15.1%) |
| $150,000 or more | 29 (21.0%) | 20 (37.7%) |
| Total | 138 (100.0%) | 53 (100.0%) |
Property Value to Household Income Ratio in Hoonah
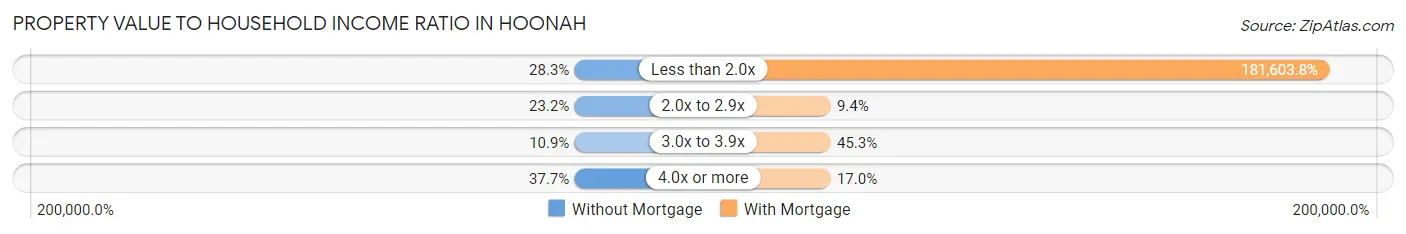
| Value-to-Income Ratio | Without Mortgage | With Mortgage |
| Less than 2.0x | 39 (28.3%) | 96,250 (181,603.8%) |
| 2.0x to 2.9x | 32 (23.2%) | 5 (9.4%) |
| 3.0x to 3.9x | 15 (10.9%) | 24 (45.3%) |
| 4.0x or more | 52 (37.7%) | 9 (17.0%) |
| Total | 138 (100.0%) | 53 (100.0%) |
Real Estate Taxes by Mortgage Status in Hoonah
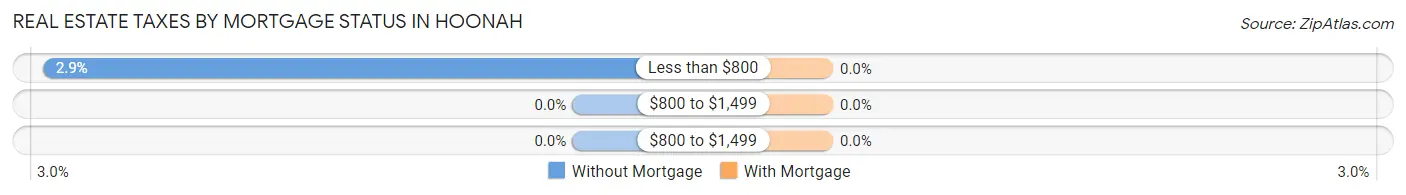
| Property Taxes | Without Mortgage | With Mortgage |
| Less than $800 | 4 (2.9%) | 0 (0.0%) |
| $800 to $1,499 | 0 (0.0%) | 0 (0.0%) |
| $800 to $1,499 | 0 (0.0%) | 0 (0.0%) |
| Total | 138 (100.0%) | 53 (100.0%) |
Health & Disability in Hoonah
Health Insurance Coverage by Age in Hoonah
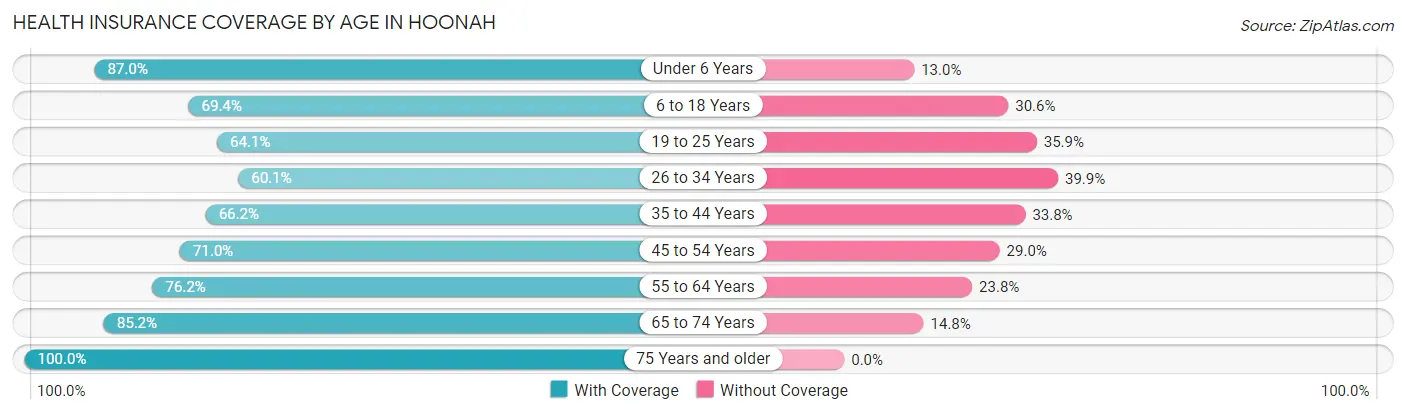
| Age Bracket | With Coverage | Without Coverage |
| Under 6 Years | 40 (87.0%) | 6 (13.0%) |
| 6 to 18 Years | 59 (69.4%) | 26 (30.6%) |
| 19 to 25 Years | 50 (64.1%) | 28 (35.9%) |
| 26 to 34 Years | 86 (60.1%) | 57 (39.9%) |
| 35 to 44 Years | 49 (66.2%) | 25 (33.8%) |
| 45 to 54 Years | 76 (71.0%) | 31 (29.0%) |
| 55 to 64 Years | 131 (76.2%) | 41 (23.8%) |
| 65 to 74 Years | 121 (85.2%) | 21 (14.8%) |
| 75 Years and older | 49 (100.0%) | 0 (0.0%) |
| Total | 661 (73.8%) | 235 (26.2%) |
Health Insurance Coverage by Citizenship Status in Hoonah
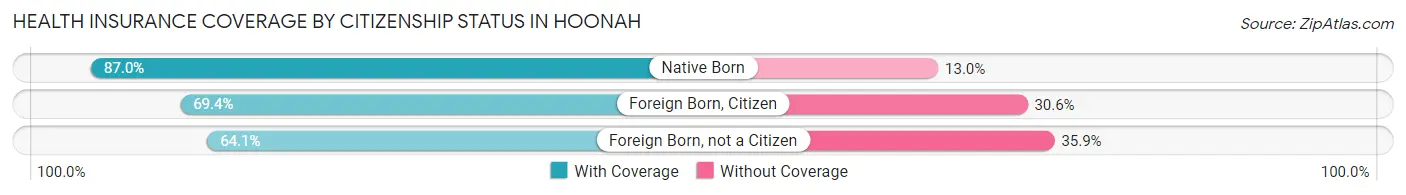
| Citizenship Status | With Coverage | Without Coverage |
| Native Born | 40 (87.0%) | 6 (13.0%) |
| Foreign Born, Citizen | 59 (69.4%) | 26 (30.6%) |
| Foreign Born, not a Citizen | 50 (64.1%) | 28 (35.9%) |
Health Insurance Coverage by Household Income in Hoonah
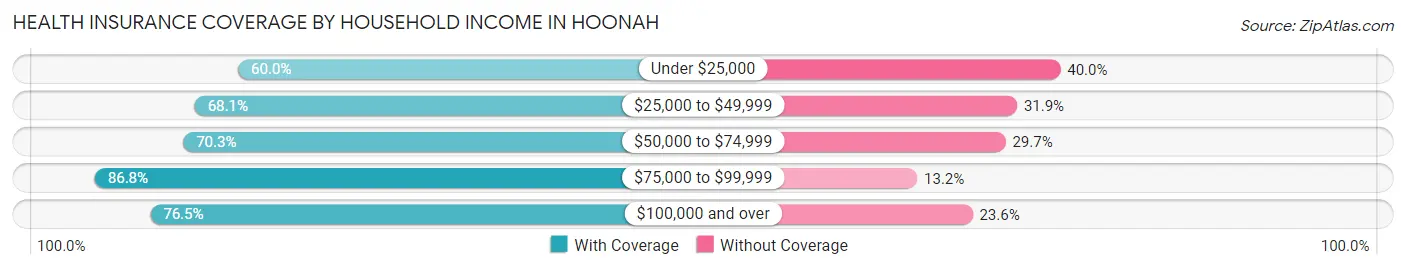
| Household Income | With Coverage | Without Coverage |
| Under $25,000 | 30 (60.0%) | 20 (40.0%) |
| $25,000 to $49,999 | 94 (68.1%) | 44 (31.9%) |
| $50,000 to $74,999 | 104 (70.3%) | 44 (29.7%) |
| $75,000 to $99,999 | 145 (86.8%) | 22 (13.2%) |
| $100,000 and over | 211 (76.4%) | 65 (23.5%) |
Public vs Private Health Insurance Coverage by Age in Hoonah
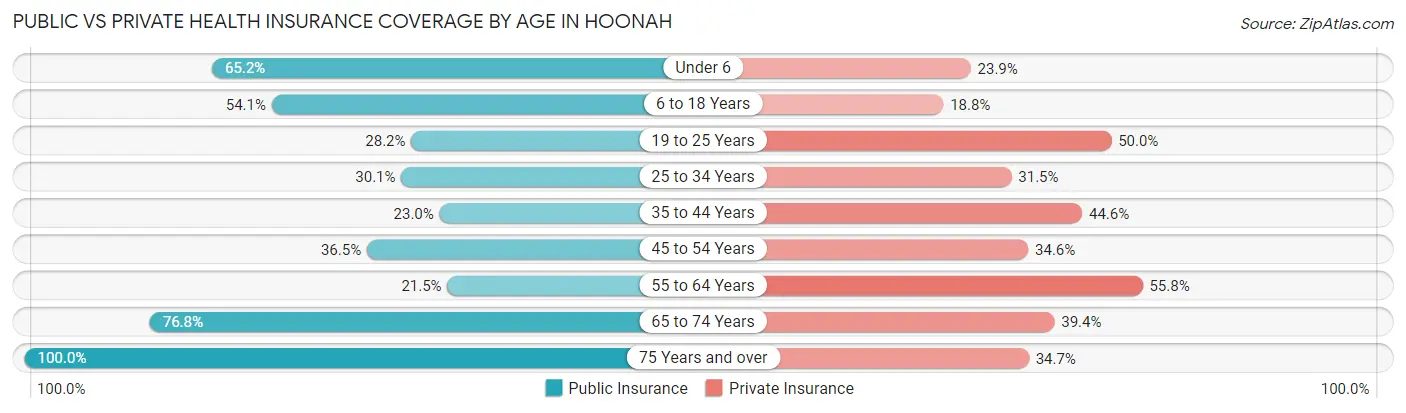
| Age Bracket | Public Insurance | Private Insurance |
| Under 6 | 30 (65.2%) | 11 (23.9%) |
| 6 to 18 Years | 46 (54.1%) | 16 (18.8%) |
| 19 to 25 Years | 22 (28.2%) | 39 (50.0%) |
| 25 to 34 Years | 43 (30.1%) | 45 (31.5%) |
| 35 to 44 Years | 17 (23.0%) | 33 (44.6%) |
| 45 to 54 Years | 39 (36.4%) | 37 (34.6%) |
| 55 to 64 Years | 37 (21.5%) | 96 (55.8%) |
| 65 to 74 Years | 109 (76.8%) | 56 (39.4%) |
| 75 Years and over | 49 (100.0%) | 17 (34.7%) |
| Total | 392 (43.8%) | 350 (39.1%) |
Disability Status by Sex by Age in Hoonah
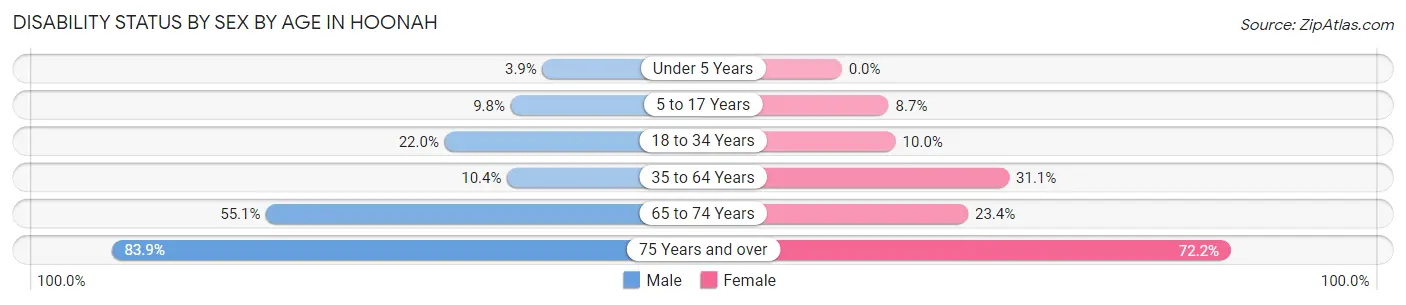
| Age Bracket | Male | Female |
| Under 5 Years | 1 (3.8%) | 0 (0.0%) |
| 5 to 17 Years | 4 (9.8%) | 4 (8.7%) |
| 18 to 34 Years | 37 (22.0%) | 6 (10.0%) |
| 35 to 64 Years | 23 (10.4%) | 41 (31.1%) |
| 65 to 74 Years | 43 (55.1%) | 15 (23.4%) |
| 75 Years and over | 26 (83.9%) | 13 (72.2%) |
Disability Class by Sex by Age in Hoonah
Disability Class: Hearing Difficulty
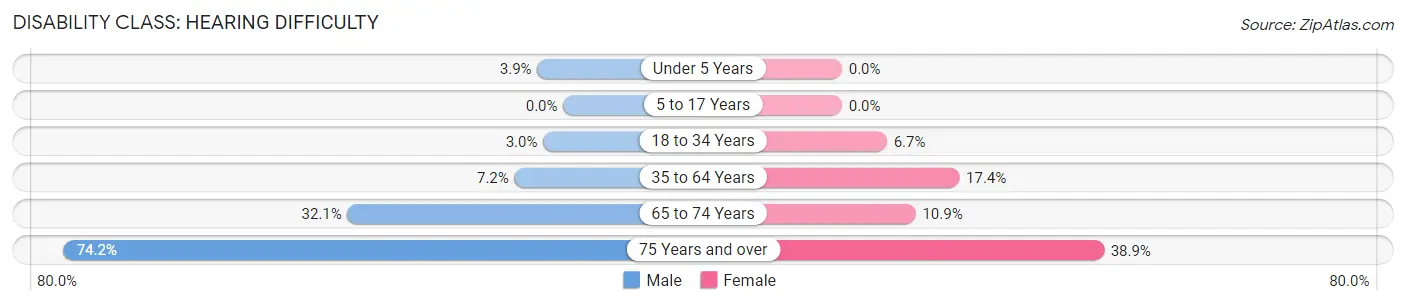
| Age Bracket | Male | Female |
| Under 5 Years | 1 (3.8%) | 0 (0.0%) |
| 5 to 17 Years | 0 (0.0%) | 0 (0.0%) |
| 18 to 34 Years | 5 (3.0%) | 4 (6.7%) |
| 35 to 64 Years | 16 (7.2%) | 23 (17.4%) |
| 65 to 74 Years | 25 (32.1%) | 7 (10.9%) |
| 75 Years and over | 23 (74.2%) | 7 (38.9%) |
Disability Class: Vision Difficulty
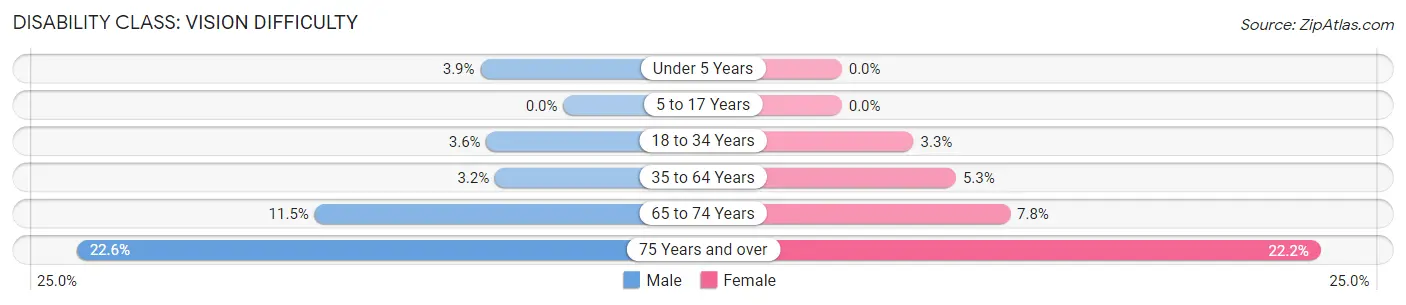
| Age Bracket | Male | Female |
| Under 5 Years | 1 (3.8%) | 0 (0.0%) |
| 5 to 17 Years | 0 (0.0%) | 0 (0.0%) |
| 18 to 34 Years | 6 (3.6%) | 2 (3.3%) |
| 35 to 64 Years | 7 (3.2%) | 7 (5.3%) |
| 65 to 74 Years | 9 (11.5%) | 5 (7.8%) |
| 75 Years and over | 7 (22.6%) | 4 (22.2%) |
Disability Class: Cognitive Difficulty
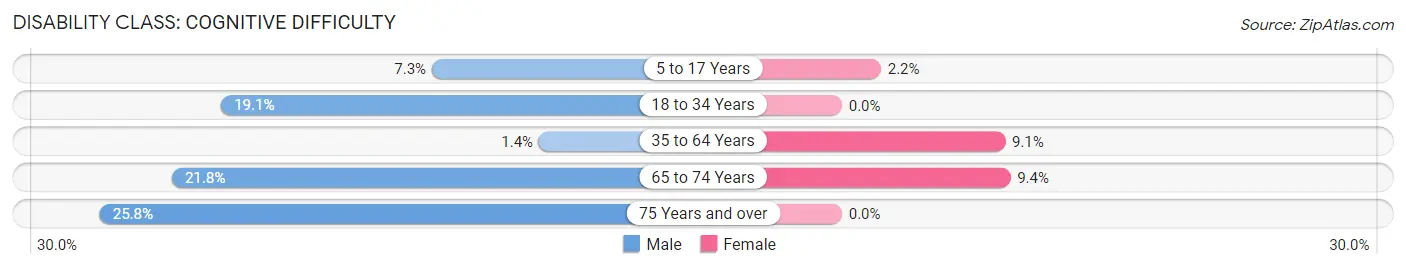
| Age Bracket | Male | Female |
| 5 to 17 Years | 3 (7.3%) | 1 (2.2%) |
| 18 to 34 Years | 32 (19.1%) | 0 (0.0%) |
| 35 to 64 Years | 3 (1.4%) | 12 (9.1%) |
| 65 to 74 Years | 17 (21.8%) | 6 (9.4%) |
| 75 Years and over | 8 (25.8%) | 0 (0.0%) |
Disability Class: Ambulatory Difficulty
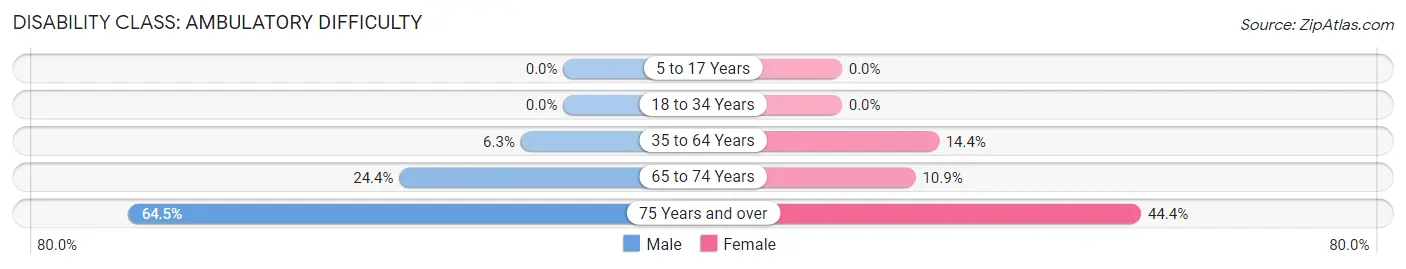
| Age Bracket | Male | Female |
| 5 to 17 Years | 0 (0.0%) | 0 (0.0%) |
| 18 to 34 Years | 0 (0.0%) | 0 (0.0%) |
| 35 to 64 Years | 14 (6.3%) | 19 (14.4%) |
| 65 to 74 Years | 19 (24.4%) | 7 (10.9%) |
| 75 Years and over | 20 (64.5%) | 8 (44.4%) |
Disability Class: Self-Care Difficulty
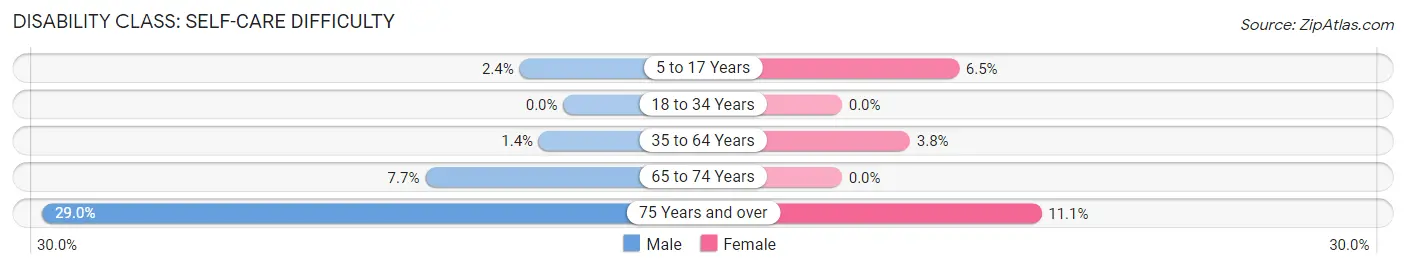
| Age Bracket | Male | Female |
| 5 to 17 Years | 1 (2.4%) | 3 (6.5%) |
| 18 to 34 Years | 0 (0.0%) | 0 (0.0%) |
| 35 to 64 Years | 3 (1.4%) | 5 (3.8%) |
| 65 to 74 Years | 6 (7.7%) | 0 (0.0%) |
| 75 Years and over | 9 (29.0%) | 2 (11.1%) |
Technology Access in Hoonah
Computing Device Access in Hoonah
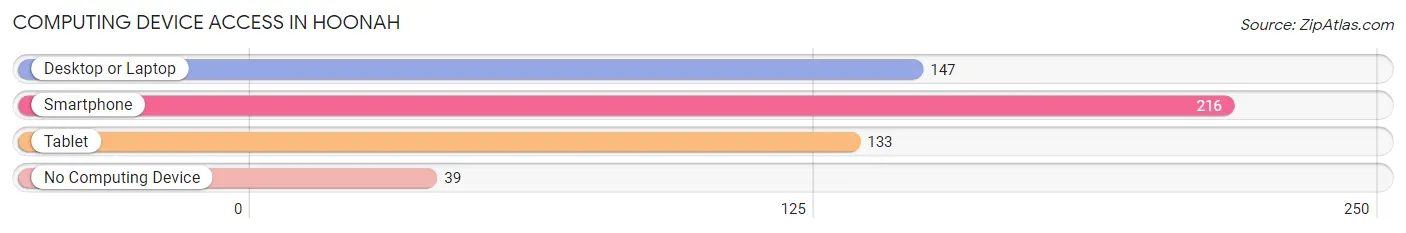
| Device Type | # Households | % Households |
| Desktop or Laptop | 147 | 54.6% |
| Smartphone | 216 | 80.3% |
| Tablet | 133 | 49.4% |
| No Computing Device | 39 | 14.5% |
| Total | 269 | 100.0% |
Internet Access in Hoonah
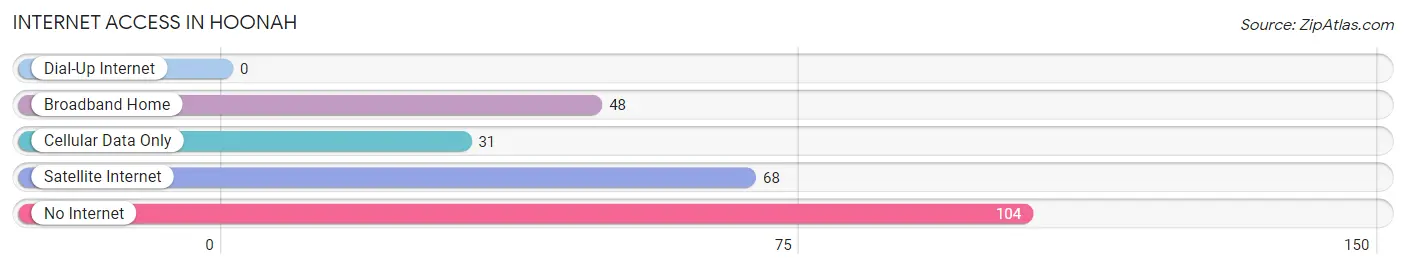
| Internet Type | # Households | % Households |
| Dial-Up Internet | 0 | 0.0% |
| Broadband Home | 48 | 17.8% |
| Cellular Data Only | 31 | 11.5% |
| Satellite Internet | 68 | 25.3% |
| No Internet | 104 | 38.7% |
| Total | 269 | 100.0% |
Hoonah Summary
Hoonah, Alaska is a small city located on the western coast of Chichagof Island in the Alexander Archipelago of Southeast Alaska. It is the only incorporated city in the Hoonah-Angoon Census Area and is home to the Tlingit people. The city has a population of 862 people as of the 2010 census, making it the smallest incorporated city in the state.
History
The Tlingit people have lived in the area for thousands of years, and the city of Hoonah was established in the late 19th century. The city was originally known as Xunaa, which means “sheltered bay” in the Tlingit language. The city was renamed Hoonah in 1881 by the U.S. Coast and Geodetic Survey, after the Tlingit word for “place of refuge.”
The city was a major fishing and trading center for the Tlingit people, and it was also a popular destination for gold prospectors during the Klondike Gold Rush of the late 19th century. In the early 20th century, the city was a major port for the Alaska Packers Association, which operated a cannery in the city.
Geography
Hoonah is located on the western coast of Chichagof Island, in the Alexander Archipelago of Southeast Alaska. The city is situated on the Icy Strait, which separates Chichagof Island from the mainland of Alaska. The city is surrounded by the Tongass National Forest, and is located approximately 40 miles southwest of Juneau, the state capital.
The city has a total area of 4.3 square miles, of which 4.2 square miles is land and 0.1 square miles is water. The city is located at an elevation of 40 feet above sea level.
Economy
The economy of Hoonah is largely based on fishing and tourism. The city is home to several seafood processing plants, which process salmon, halibut, and other fish caught in the waters of the Icy Strait. The city is also a popular destination for sport fishing, and is home to several charter fishing companies.
The city is also home to several tourist attractions, including the Icy Strait Point, a cruise ship port and tourist destination. The city is also home to the Hoonah Indian Association, which operates a cultural center and museum.
Demographics
As of the 2010 census, the population of Hoonah was 862 people, with a population density of 201.3 people per square mile. The racial makeup of the city was 79.2% White, 0.2% African American, 11.2% Native American, 0.2% Asian, 0.2% Pacific Islander, 0.2% from other races, and 8.8% from two or more races.
The median income for a household in the city was $45,000, and the median income for a family was $50,000. The per capita income for the city was $20,000. About 11.2% of the population was below the poverty line.
Common Questions
What is Per Capita Income in Hoonah?
Per Capita income in Hoonah is $37,151.
What is the Median Family Income in Hoonah?
Median Family Income in Hoonah is $86,389.
What is the Median Household income in Hoonah?
Median Household Income in Hoonah is $72,969.
What is Income or Wage Gap in Hoonah?
Income or Wage Gap in Hoonah is 7.0%.
Women in Hoonah earn 93.0 cents for every dollar earned by a man.
What is Inequality or Gini Index in Hoonah?
Inequality or Gini Index in Hoonah is 0.42.
What is the Total Population of Hoonah?
Total Population of Hoonah is 896.
What is the Total Male Population of Hoonah?
Total Male Population of Hoonah is 565.
What is the Total Female Population of Hoonah?
Total Female Population of Hoonah is 331.
What is the Ratio of Males per 100 Females in Hoonah?
There are 170.69 Males per 100 Females in Hoonah.
What is the Ratio of Females per 100 Males in Hoonah?
There are 58.58 Females per 100 Males in Hoonah.
What is the Median Population Age in Hoonah?
Median Population Age in Hoonah is 47.0 Years.
What is the Average Family Size in Hoonah
Average Family Size in Hoonah is 3.7 People.
What is the Average Household Size in Hoonah
Average Household Size in Hoonah is 2.9 People.
How Large is the Labor Force in Hoonah?
There are 533 People in the Labor Forcein in Hoonah.
What is the Percentage of People in the Labor Force in Hoonah?
68.9% of People are in the Labor Force in Hoonah.
What is the Unemployment Rate in Hoonah?
Unemployment Rate in Hoonah is 18.6%.