Metlakatla, AK Map & Demographics
Metlakatla Map
Metlakatla Overview
$29,379
PER CAPITA INCOME
$95,556
AVG FAMILY INCOME
$78,750
AVG HOUSEHOLD INCOME
14.9%
WAGE / INCOME GAP [ % ]
85.1¢/ $1
WAGE / INCOME GAP [ $ ]
0.37
INEQUALITY / GINI INDEX
1,437
TOTAL POPULATION
798
MALE POPULATION
639
FEMALE POPULATION
124.88
MALES / 100 FEMALES
80.08
FEMALES / 100 MALES
38.6
MEDIAN AGE
3.5
AVG FAMILY SIZE
3.2
AVG HOUSEHOLD SIZE
684
LABOR FORCE [ PEOPLE ]
60.7%
PERCENT IN LABOR FORCE
12.0%
UNEMPLOYMENT RATE
Metlakatla Zip Codes
Metlakatla Area Codes
Income in Metlakatla
Income Overview in Metlakatla
Per Capita Income in Metlakatla is $29,379, while median incomes of families and households are $95,556 and $78,750 respectively.
| Characteristic | Number | Measure |
| Per Capita Income | 1,437 | $29,379 |
| Median Family Income | 354 | $95,556 |
| Mean Family Income | 354 | $96,198 |
| Median Household Income | 443 | $78,750 |
| Mean Household Income | 443 | $86,483 |
| Income Deficit | 354 | $0 |
| Wage / Income Gap (%) | 1,437 | 14.95% |
| Wage / Income Gap ($) | 1,437 | 85.05¢ per $1 |
| Gini / Inequality Index | 1,437 | 0.37 |
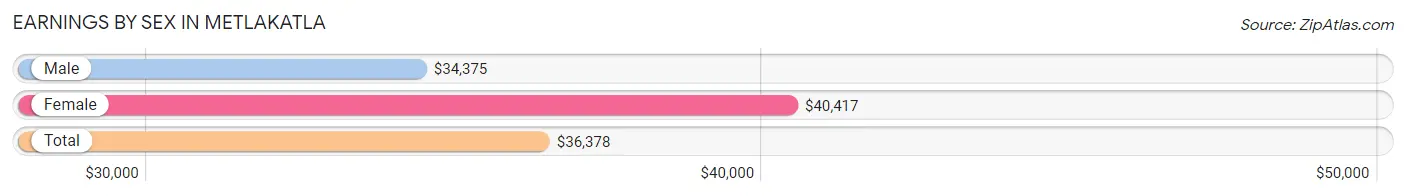
Earnings by Sex in Metlakatla
Average Earnings in Metlakatla are $36,378, $34,375 for men and $40,417 for women, a difference of 14.9%.
| Sex | Number | Average Earnings |
| Male | 428 (57.5%) | $34,375 |
| Female | 317 (42.5%) | $40,417 |
| Total | 745 (100.0%) | $36,378 |
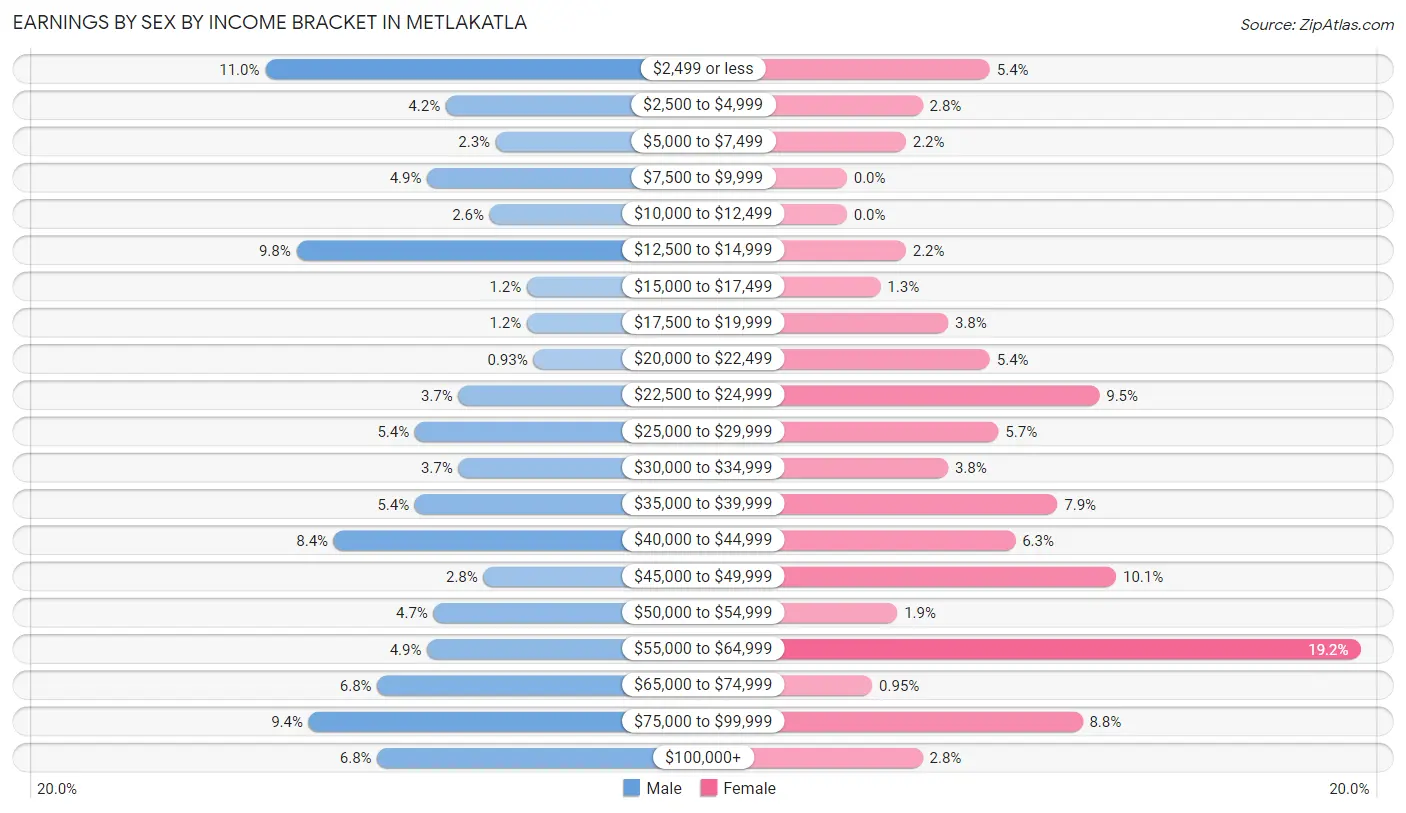
Earnings by Sex by Income Bracket in Metlakatla
The most common earnings brackets in Metlakatla are $2,499 or less for men (47 | 11.0%) and $55,000 to $64,999 for women (61 | 19.2%).
| Income | Male | Female |
| $2,499 or less | 47 (11.0%) | 17 (5.4%) |
| $2,500 to $4,999 | 18 (4.2%) | 9 (2.8%) |
| $5,000 to $7,499 | 10 (2.3%) | 7 (2.2%) |
| $7,500 to $9,999 | 21 (4.9%) | 0 (0.0%) |
| $10,000 to $12,499 | 11 (2.6%) | 0 (0.0%) |
| $12,500 to $14,999 | 42 (9.8%) | 7 (2.2%) |
| $15,000 to $17,499 | 5 (1.2%) | 4 (1.3%) |
| $17,500 to $19,999 | 5 (1.2%) | 12 (3.8%) |
| $20,000 to $22,499 | 4 (0.9%) | 17 (5.4%) |
| $22,500 to $24,999 | 16 (3.7%) | 30 (9.5%) |
| $25,000 to $29,999 | 23 (5.4%) | 18 (5.7%) |
| $30,000 to $34,999 | 16 (3.7%) | 12 (3.8%) |
| $35,000 to $39,999 | 23 (5.4%) | 25 (7.9%) |
| $40,000 to $44,999 | 36 (8.4%) | 20 (6.3%) |
| $45,000 to $49,999 | 12 (2.8%) | 32 (10.1%) |
| $50,000 to $54,999 | 20 (4.7%) | 6 (1.9%) |
| $55,000 to $64,999 | 21 (4.9%) | 61 (19.2%) |
| $65,000 to $74,999 | 29 (6.8%) | 3 (0.9%) |
| $75,000 to $99,999 | 40 (9.3%) | 28 (8.8%) |
| $100,000+ | 29 (6.8%) | 9 (2.8%) |
| Total | 428 (100.0%) | 317 (100.0%) |
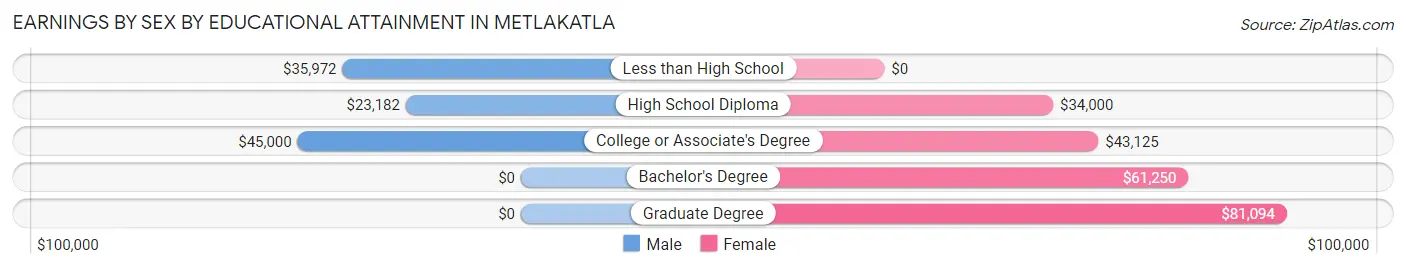
Earnings by Sex by Educational Attainment in Metlakatla
Average earnings in Metlakatla are $36,685 for men and $45,667 for women, a difference of 19.7%. Men with an educational attainment of college or associate's degree enjoy the highest average annual earnings of $45,000, while those with high school diploma education earn the least with $23,182. Women with an educational attainment of graduate degree earn the most with the average annual earnings of $81,094, while those with high school diploma education have the smallest earnings of $34,000.
| Educational Attainment | Male Income | Female Income |
| Less than High School | $35,972 | $0 |
| High School Diploma | $23,182 | $34,000 |
| College or Associate's Degree | $45,000 | $43,125 |
| Bachelor's Degree | - | - |
| Graduate Degree | - | - |
| Total | $36,685 | $45,667 |
Family Income in Metlakatla
Family Income Brackets in Metlakatla
According to the Metlakatla family income data, there are 96 families falling into the $100,000 to $149,999 income range, which is the most common income bracket and makes up 27.1% of all families.
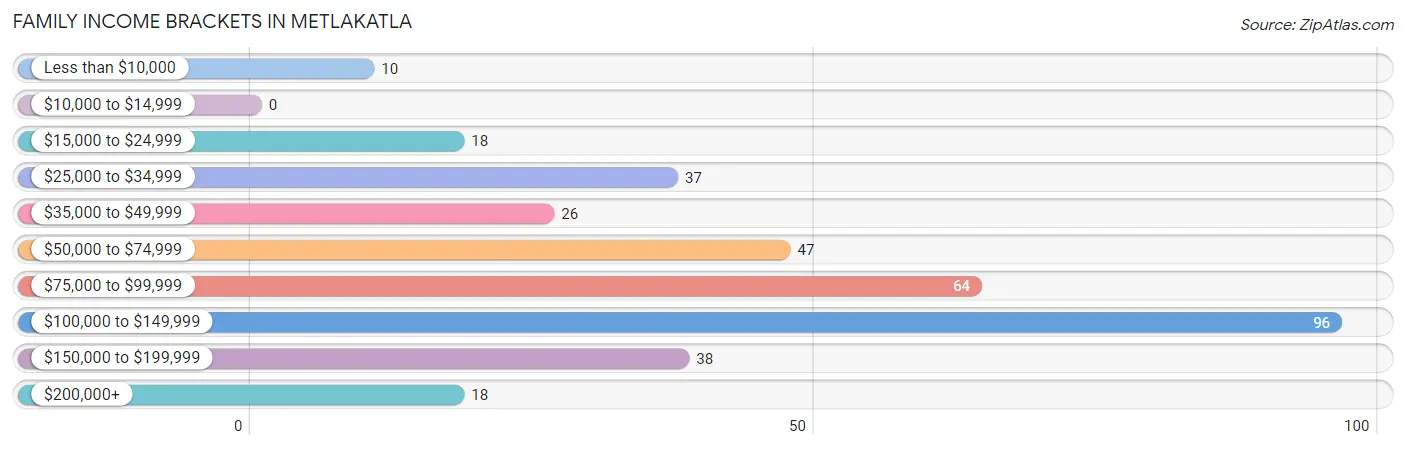
| Income Bracket | # Families | % Families |
| Less than $10,000 | 10 | 2.8% |
| $10,000 to $14,999 | 0 | 0.0% |
| $15,000 to $24,999 | 18 | 5.1% |
| $25,000 to $34,999 | 37 | 10.5% |
| $35,000 to $49,999 | 26 | 7.3% |
| $50,000 to $74,999 | 47 | 13.3% |
| $75,000 to $99,999 | 64 | 18.1% |
| $100,000 to $149,999 | 96 | 27.1% |
| $150,000 to $199,999 | 38 | 10.7% |
| $200,000+ | 18 | 5.1% |
Family Income by Famaliy Size in Metlakatla
5-person families (54 | 15.2%) account for the highest median family income in Metlakatla with $136,500 per family, while 2-person families (143 | 40.4%) have the highest median income of $48,920 per family member.
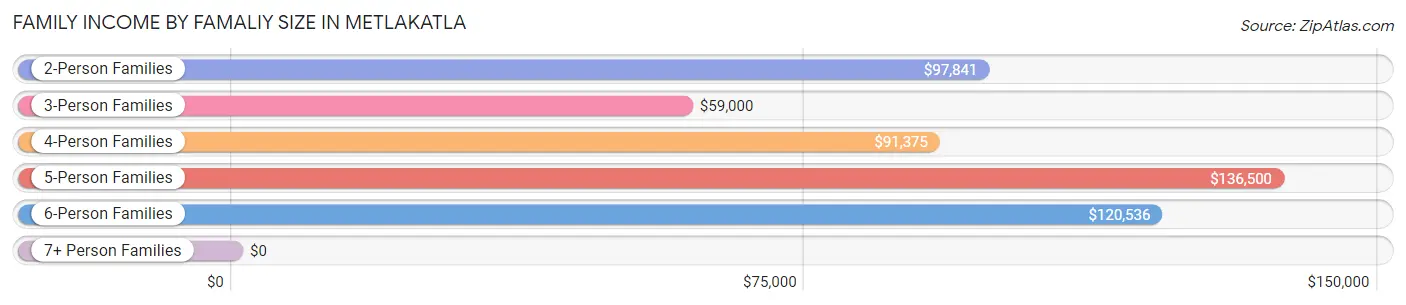
| Income Bracket | # Families | Median Income |
| 2-Person Families | 143 (40.4%) | $97,841 |
| 3-Person Families | 72 (20.3%) | $59,000 |
| 4-Person Families | 45 (12.7%) | $91,375 |
| 5-Person Families | 54 (15.2%) | $136,500 |
| 6-Person Families | 25 (7.1%) | $120,536 |
| 7+ Person Families | 15 (4.2%) | $0 |
| Total | 354 (100.0%) | $95,556 |
Family Income by Number of Earners in Metlakatla
The median family income in Metlakatla is $95,556, with families comprising 2 earners (166) having the highest median family income of $123,750, while families with no earners (39) have the lowest median family income of $26,250, accounting for 46.9% and 11.0% of families, respectively.
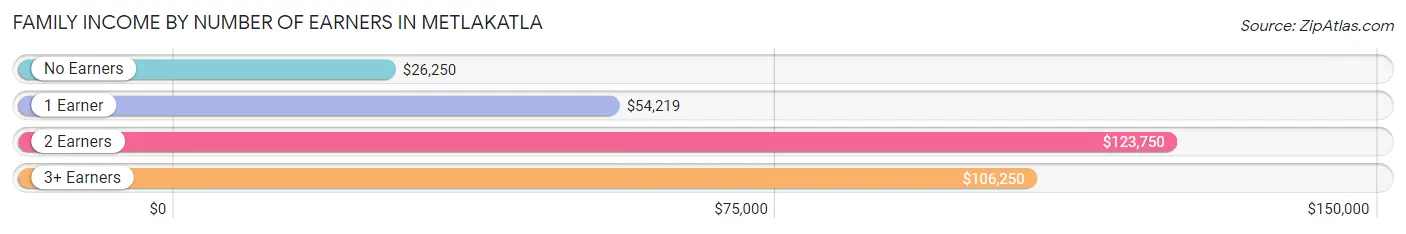
| Number of Earners | # Families | Median Income |
| No Earners | 39 (11.0%) | $26,250 |
| 1 Earner | 101 (28.5%) | $54,219 |
| 2 Earners | 166 (46.9%) | $123,750 |
| 3+ Earners | 48 (13.6%) | $106,250 |
| Total | 354 (100.0%) | $95,556 |
Household Income in Metlakatla
Household Income Brackets in Metlakatla
With 103 households falling in the category, the $100,000 to $149,999 income range is the most frequent in Metlakatla, accounting for 23.3% of all households. In contrast, only 6 households (1.3%) fall into the $10,000 to $14,999 income bracket, making it the least populous group.
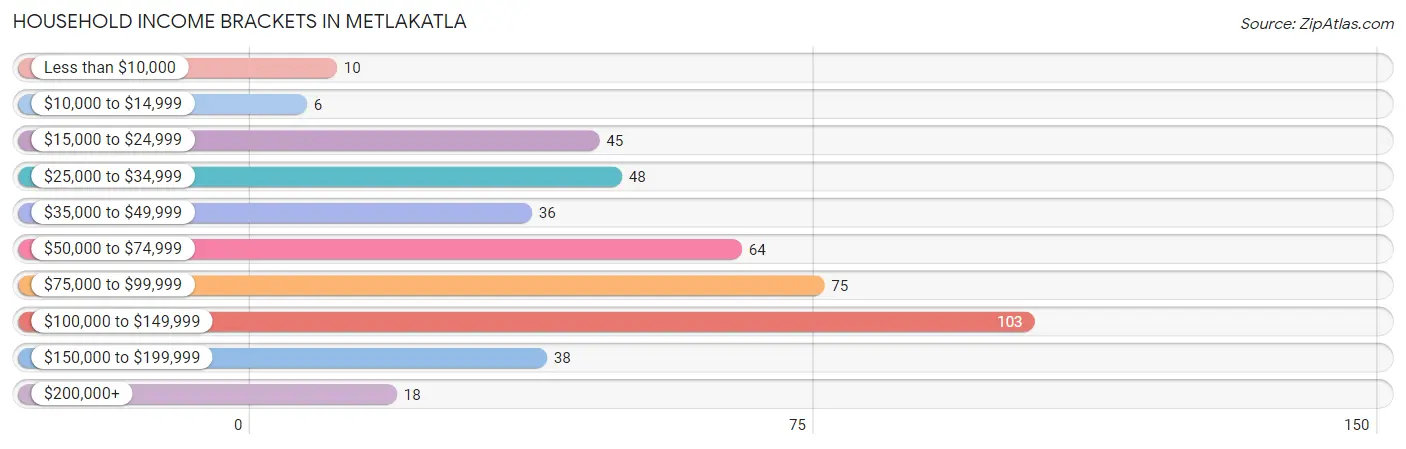
| Income Bracket | # Households | % Households |
| Less than $10,000 | 10 | 2.3% |
| $10,000 to $14,999 | 6 | 1.4% |
| $15,000 to $24,999 | 45 | 10.2% |
| $25,000 to $34,999 | 48 | 10.8% |
| $35,000 to $49,999 | 36 | 8.1% |
| $50,000 to $74,999 | 64 | 14.4% |
| $75,000 to $99,999 | 75 | 16.9% |
| $100,000 to $149,999 | 103 | 23.3% |
| $150,000 to $199,999 | 38 | 8.6% |
| $200,000+ | 18 | 4.1% |
Household Income by Householder Age in Metlakatla
The median household income in Metlakatla is $78,750, with the highest median household income of $112,917 found in the 25 to 44 years age bracket for the primary householder. A total of 115 households (26.0%) fall into this category. Meanwhile, the 15 to 24 years age bracket for the primary householder has the lowest median household income of $0, with 7 households (1.6%) in this group.
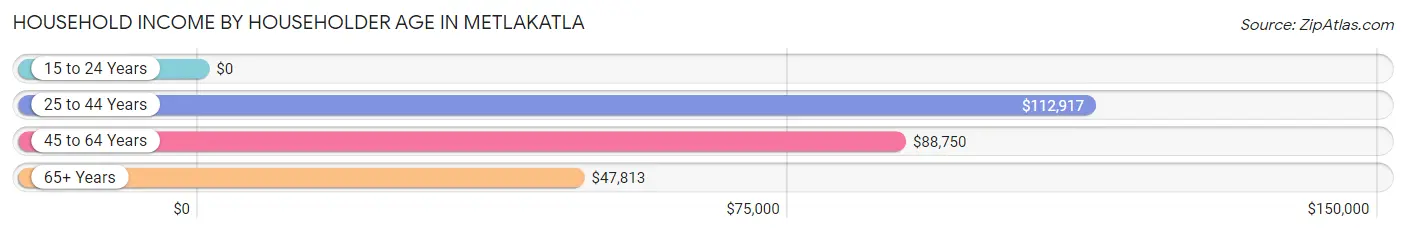
| Income Bracket | # Households | Median Income |
| 15 to 24 Years | 7 (1.6%) | $0 |
| 25 to 44 Years | 115 (26.0%) | $112,917 |
| 45 to 64 Years | 200 (45.2%) | $88,750 |
| 65+ Years | 121 (27.3%) | $47,813 |
| Total | 443 (100.0%) | $78,750 |
Poverty in Metlakatla
Income Below Poverty by Sex and Age in Metlakatla
With 16.3% poverty level for males and 12.5% for females among the residents of Metlakatla, 15 year old males and 45 to 54 year old females are the most vulnerable to poverty, with 5 males (100.0%) and 25 females (32.9%) in their respective age groups living below the poverty level.
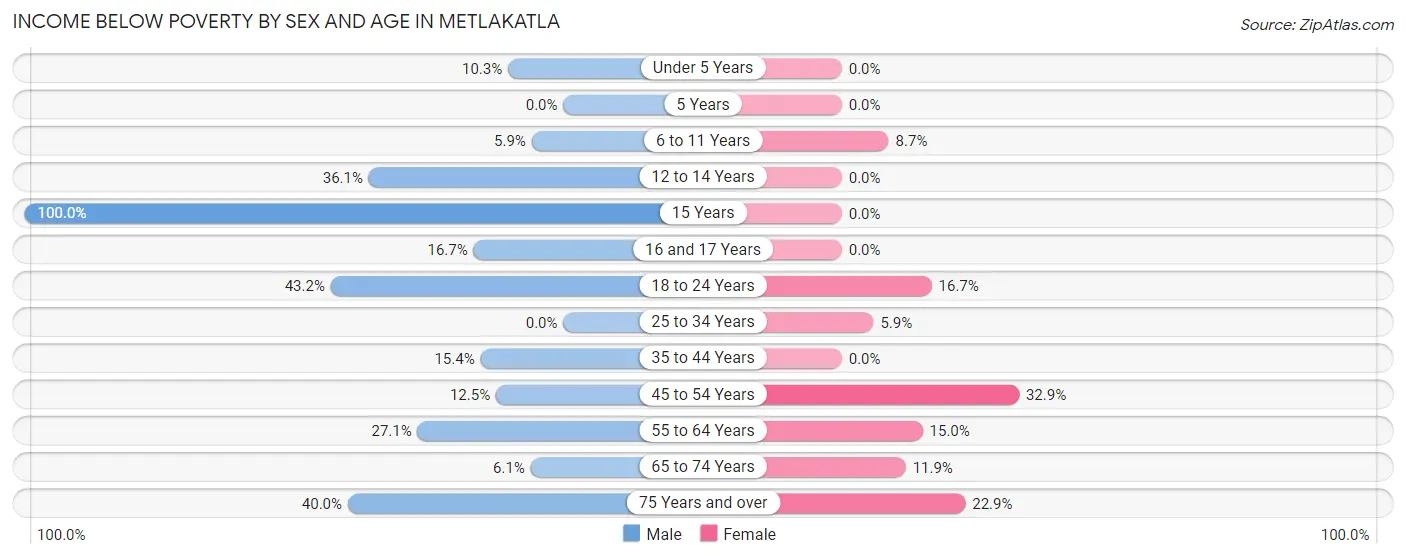
| Age Bracket | Male | Female |
| Under 5 Years | 4 (10.3%) | 0 (0.0%) |
| 5 Years | 0 (0.0%) | 0 (0.0%) |
| 6 to 11 Years | 4 (5.9%) | 4 (8.7%) |
| 12 to 14 Years | 13 (36.1%) | 0 (0.0%) |
| 15 Years | 5 (100.0%) | 0 (0.0%) |
| 16 and 17 Years | 7 (16.7%) | 0 (0.0%) |
| 18 to 24 Years | 19 (43.2%) | 12 (16.7%) |
| 25 to 34 Years | 0 (0.0%) | 4 (5.9%) |
| 35 to 44 Years | 18 (15.4%) | 0 (0.0%) |
| 45 to 54 Years | 10 (12.5%) | 25 (32.9%) |
| 55 to 64 Years | 36 (27.1%) | 15 (15.0%) |
| 65 to 74 Years | 6 (6.1%) | 7 (11.9%) |
| 75 Years and over | 8 (40.0%) | 11 (22.9%) |
| Total | 130 (16.3%) | 78 (12.5%) |
Income Above Poverty by Sex and Age in Metlakatla
According to the poverty statistics in Metlakatla, males aged 5 years and females aged under 5 years are the age groups that are most secure financially, with 100.0% of males and 100.0% of females in these age groups living above the poverty line.
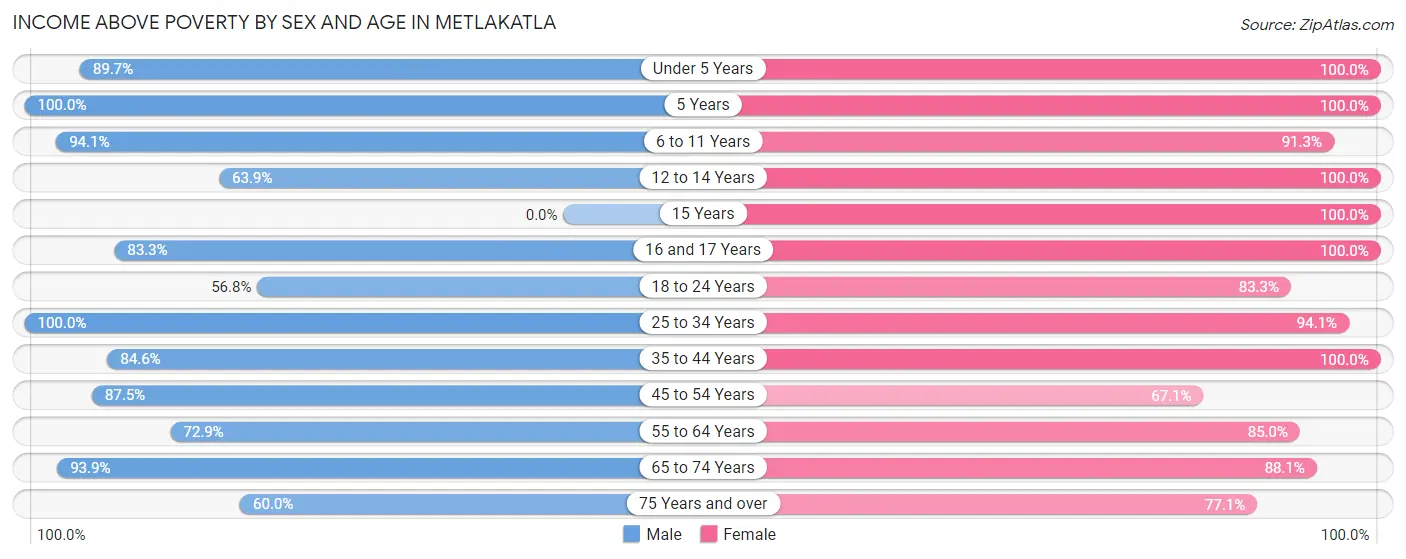
| Age Bracket | Male | Female |
| Under 5 Years | 35 (89.7%) | 26 (100.0%) |
| 5 Years | 9 (100.0%) | 15 (100.0%) |
| 6 to 11 Years | 64 (94.1%) | 42 (91.3%) |
| 12 to 14 Years | 23 (63.9%) | 35 (100.0%) |
| 15 Years | 0 (0.0%) | 14 (100.0%) |
| 16 and 17 Years | 35 (83.3%) | 6 (100.0%) |
| 18 to 24 Years | 25 (56.8%) | 60 (83.3%) |
| 25 to 34 Years | 105 (100.0%) | 64 (94.1%) |
| 35 to 44 Years | 99 (84.6%) | 57 (100.0%) |
| 45 to 54 Years | 70 (87.5%) | 51 (67.1%) |
| 55 to 64 Years | 97 (72.9%) | 85 (85.0%) |
| 65 to 74 Years | 93 (93.9%) | 52 (88.1%) |
| 75 Years and over | 12 (60.0%) | 37 (77.1%) |
| Total | 667 (83.7%) | 544 (87.5%) |
Income Below Poverty Among Married-Couple Families in Metlakatla
The poverty statistics for married-couple families in Metlakatla show that 10.2% or 26 of the total 256 families live below the poverty line. Families with 1 or 2 children have the highest poverty rate of 22.6%, comprising of 14 families. On the other hand, families with 3 or 4 children have the lowest poverty rate of 0.0%, which includes 0 families.
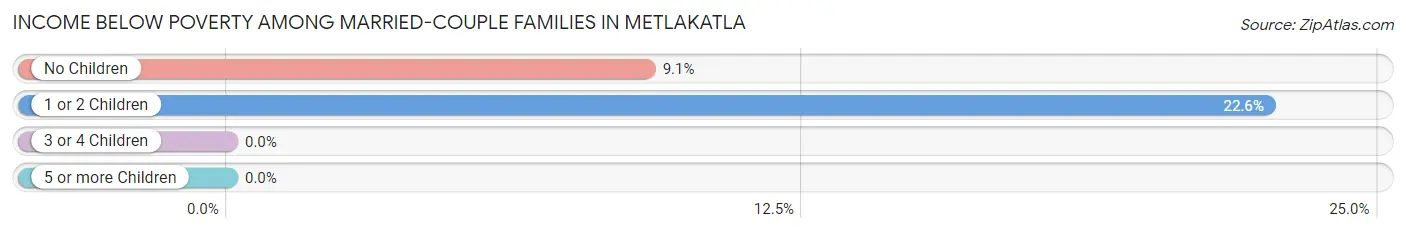
| Children | Above Poverty | Below Poverty |
| No Children | 120 (90.9%) | 12 (9.1%) |
| 1 or 2 Children | 48 (77.4%) | 14 (22.6%) |
| 3 or 4 Children | 62 (100.0%) | 0 (0.0%) |
| 5 or more Children | 0 (0.0%) | 0 (0.0%) |
| Total | 230 (89.8%) | 26 (10.2%) |
Income Below Poverty Among Single-Parent Households in Metlakatla
According to the poverty data in Metlakatla, 12.5% or 6 single-father households and 8.0% or 4 single-mother households are living below the poverty line. Among single-father households, those with no children have the highest poverty rate, with 6 households (31.6%) experiencing poverty. Likewise, among single-mother households, those with 3 or 4 children have the highest poverty rate, with 4 households (100.0%) falling below the poverty line.
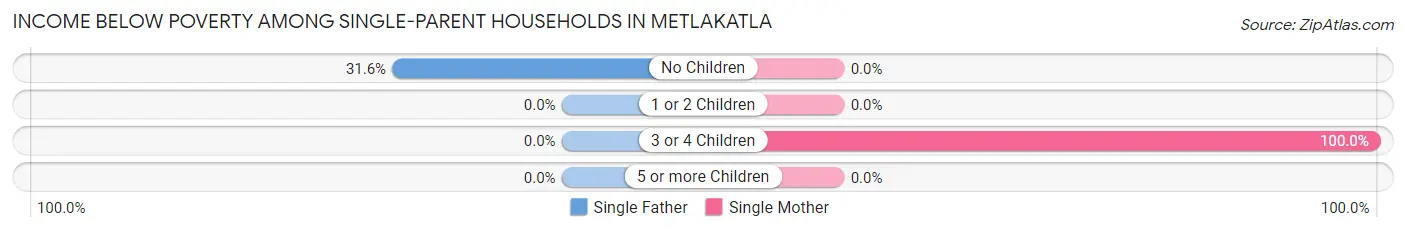
| Children | Single Father | Single Mother |
| No Children | 6 (31.6%) | 0 (0.0%) |
| 1 or 2 Children | 0 (0.0%) | 0 (0.0%) |
| 3 or 4 Children | 0 (0.0%) | 4 (100.0%) |
| 5 or more Children | 0 (0.0%) | 0 (0.0%) |
| Total | 6 (12.5%) | 4 (8.0%) |
Income Below Poverty Among Married-Couple vs Single-Parent Households in Metlakatla
The poverty data for Metlakatla shows that 26 of the married-couple family households (10.2%) and 10 of the single-parent households (10.2%) are living below the poverty level. Within the married-couple family households, those with 1 or 2 children have the highest poverty rate, with 14 households (22.6%) falling below the poverty line. Among the single-parent households, those with 3 or 4 children have the highest poverty rate, with 4 household (36.4%) living below poverty.
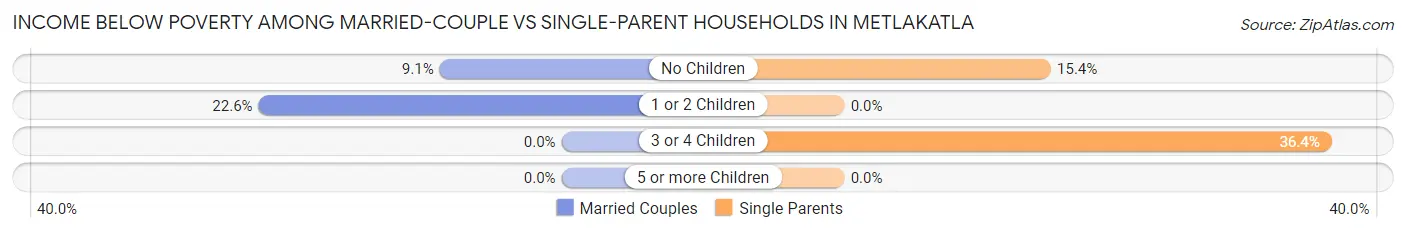
| Children | Married-Couple Families | Single-Parent Households |
| No Children | 12 (9.1%) | 6 (15.4%) |
| 1 or 2 Children | 14 (22.6%) | 0 (0.0%) |
| 3 or 4 Children | 0 (0.0%) | 4 (36.4%) |
| 5 or more Children | 0 (0.0%) | 0 (0.0%) |
| Total | 26 (10.2%) | 10 (10.2%) |
Race in Metlakatla
The most populous races in Metlakatla are Native / Alaskan (1,232 | 85.7%), White / Caucasian (108 | 7.5%), and Two or more Races (68 | 4.7%).
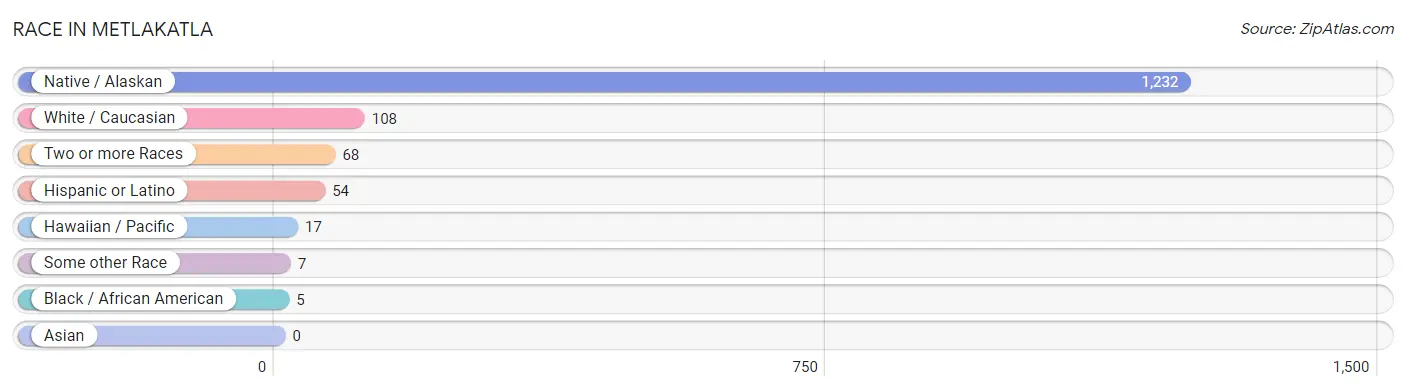
| Race | # Population | % Population |
| Asian | 0 | 0.0% |
| Black / African American | 5 | 0.4% |
| Hawaiian / Pacific | 17 | 1.2% |
| Hispanic or Latino | 54 | 3.8% |
| Native / Alaskan | 1,232 | 85.7% |
| White / Caucasian | 108 | 7.5% |
| Two or more Races | 68 | 4.7% |
| Some other Race | 7 | 0.5% |
| Total | 1,437 | 100.0% |
Ancestry in Metlakatla
The most populous ancestries reported in Metlakatla are Tsimshian (1,090 | 75.8%), Tlingit-Haida (147 | 10.2%), Alaska Native (130 | 9.0%), Mexican (49 | 3.4%), and English (48 | 3.3%), together accounting for 101.9% of all Metlakatla residents.
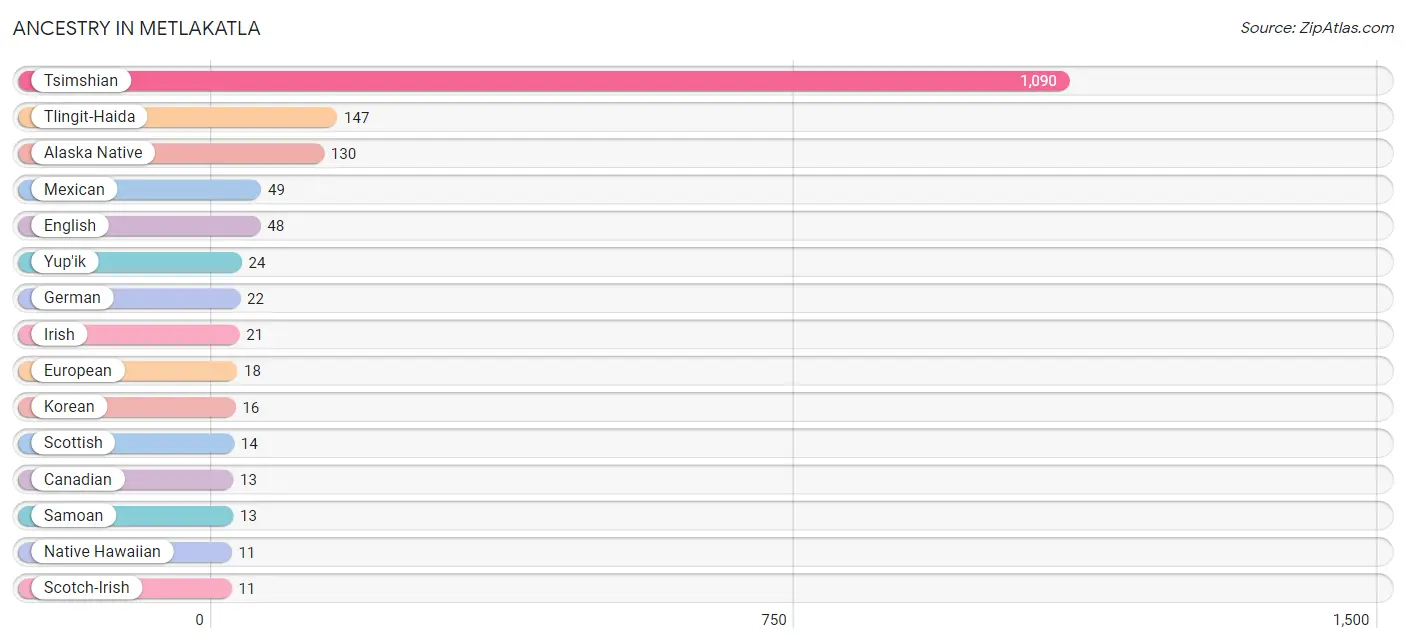
| Ancestry | # Population | % Population |
| African | 5 | 0.4% |
| Alaska Native | 130 | 9.0% |
| Aleut | 4 | 0.3% |
| Blackfeet | 5 | 0.4% |
| Canadian | 13 | 0.9% |
| Cherokee | 6 | 0.4% |
| Czech | 4 | 0.3% |
| English | 48 | 3.3% |
| European | 18 | 1.3% |
| French American Indian | 5 | 0.4% |
| German | 22 | 1.5% |
| Irish | 21 | 1.5% |
| Italian | 5 | 0.4% |
| Korean | 16 | 1.1% |
| Mexican | 49 | 3.4% |
| Native Hawaiian | 11 | 0.8% |
| Navajo | 3 | 0.2% |
| Northern European | 4 | 0.3% |
| Norwegian | 5 | 0.4% |
| Pueblo | 5 | 0.4% |
| Samoan | 13 | 0.9% |
| Scotch-Irish | 11 | 0.8% |
| Scottish | 14 | 1.0% |
| South American | 5 | 0.4% |
| Subsaharan African | 5 | 0.4% |
| Tlingit-Haida | 147 | 10.2% |
| Tsimshian | 1,090 | 75.8% |
| Yup'ik | 24 | 1.7% | View All 28 Rows |
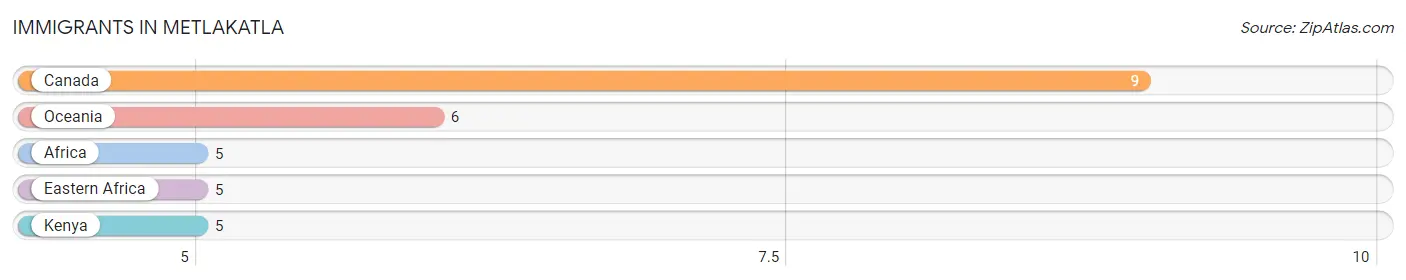
Immigrants in Metlakatla
The most numerous immigrant groups reported in Metlakatla came from Canada (9 | 0.6%), Oceania (6 | 0.4%), Africa (5 | 0.4%), Eastern Africa (5 | 0.4%), and Kenya (5 | 0.4%), together accounting for 2.1% of all Metlakatla residents.
| Immigration Origin | # Population | % Population |
| Africa | 5 | 0.4% |
| Canada | 9 | 0.6% |
| Eastern Africa | 5 | 0.4% |
| Kenya | 5 | 0.4% |
| Oceania | 6 | 0.4% | View All 5 Rows |
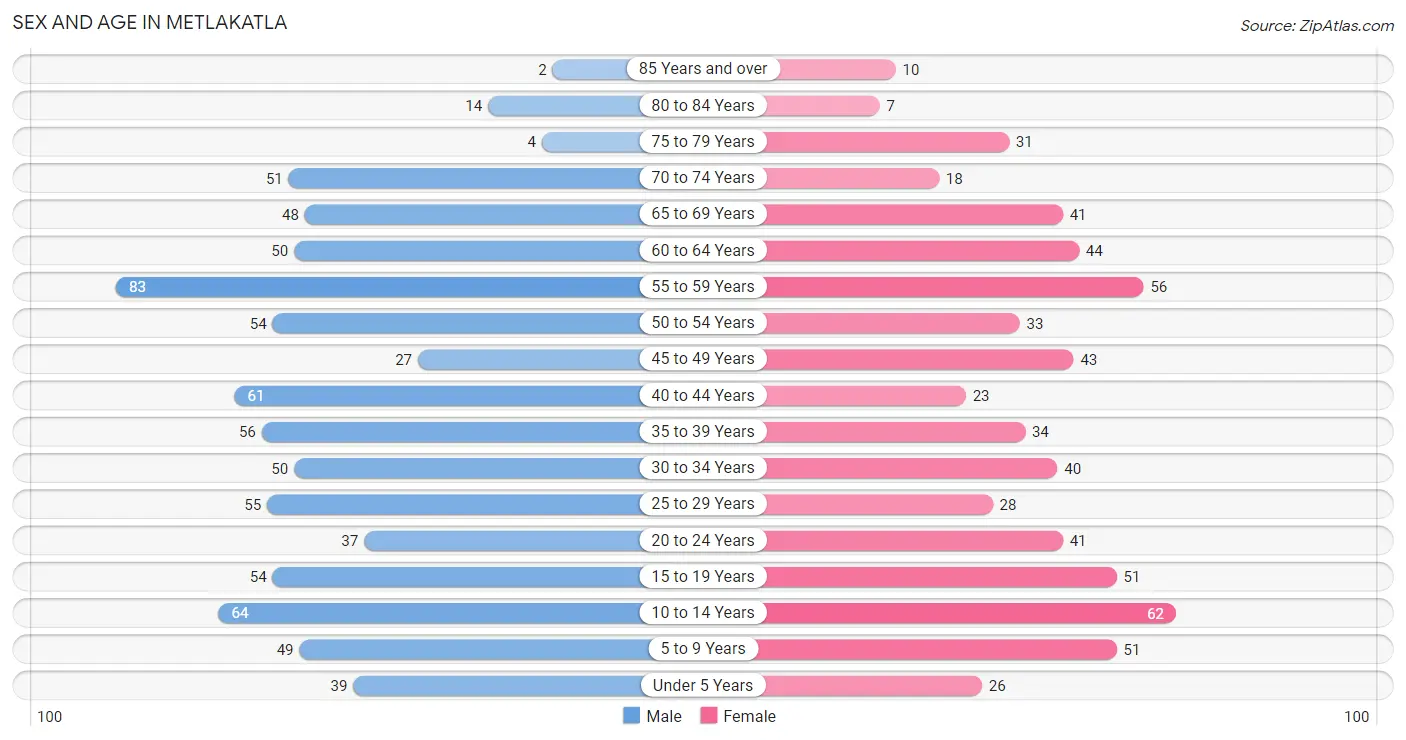
Sex and Age in Metlakatla
Sex and Age in Metlakatla
The most populous age groups in Metlakatla are 55 to 59 Years (83 | 10.4%) for men and 10 to 14 Years (62 | 9.7%) for women.
| Age Bracket | Male | Female |
| Under 5 Years | 39 (4.9%) | 26 (4.1%) |
| 5 to 9 Years | 49 (6.1%) | 51 (8.0%) |
| 10 to 14 Years | 64 (8.0%) | 62 (9.7%) |
| 15 to 19 Years | 54 (6.8%) | 51 (8.0%) |
| 20 to 24 Years | 37 (4.6%) | 41 (6.4%) |
| 25 to 29 Years | 55 (6.9%) | 28 (4.4%) |
| 30 to 34 Years | 50 (6.3%) | 40 (6.3%) |
| 35 to 39 Years | 56 (7.0%) | 34 (5.3%) |
| 40 to 44 Years | 61 (7.6%) | 23 (3.6%) |
| 45 to 49 Years | 27 (3.4%) | 43 (6.7%) |
| 50 to 54 Years | 54 (6.8%) | 33 (5.2%) |
| 55 to 59 Years | 83 (10.4%) | 56 (8.8%) |
| 60 to 64 Years | 50 (6.3%) | 44 (6.9%) |
| 65 to 69 Years | 48 (6.0%) | 41 (6.4%) |
| 70 to 74 Years | 51 (6.4%) | 18 (2.8%) |
| 75 to 79 Years | 4 (0.5%) | 31 (4.9%) |
| 80 to 84 Years | 14 (1.8%) | 7 (1.1%) |
| 85 Years and over | 2 (0.3%) | 10 (1.6%) |
| Total | 798 (100.0%) | 639 (100.0%) |
Families and Households in Metlakatla
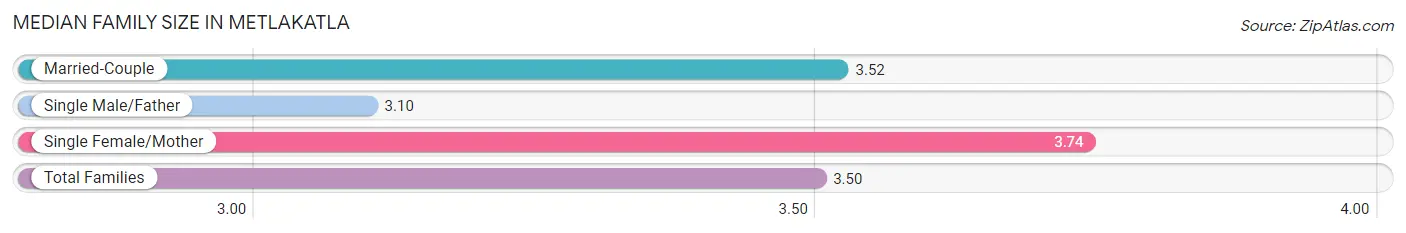
Median Family Size in Metlakatla
The median family size in Metlakatla is 3.50 persons per family, with single female/mother families (50 | 14.1%) accounting for the largest median family size of 3.74 persons per family. On the other hand, single male/father families (48 | 13.6%) represent the smallest median family size with 3.10 persons per family.
| Family Type | # Families | Family Size |
| Married-Couple | 256 (72.3%) | 3.52 |
| Single Male/Father | 48 (13.6%) | 3.10 |
| Single Female/Mother | 50 (14.1%) | 3.74 |
| Total Families | 354 (100.0%) | 3.50 |
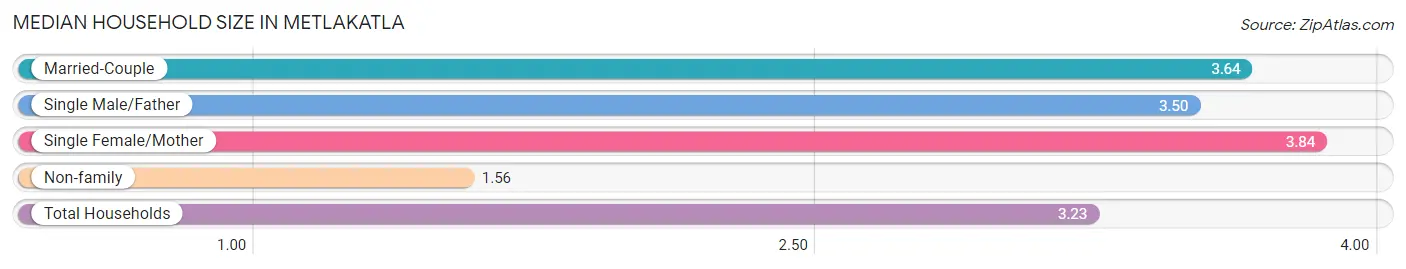
Median Household Size in Metlakatla
The median household size in Metlakatla is 3.23 persons per household, with single female/mother households (50 | 11.3%) accounting for the largest median household size of 3.84 persons per household. non-family households (89 | 20.1%) represent the smallest median household size with 1.56 persons per household.
| Household Type | # Households | Household Size |
| Married-Couple | 256 (57.8%) | 3.64 |
| Single Male/Father | 48 (10.8%) | 3.50 |
| Single Female/Mother | 50 (11.3%) | 3.84 |
| Non-family | 89 (20.1%) | 1.56 |
| Total Households | 443 (100.0%) | 3.23 |
Household Size by Marriage Status in Metlakatla
Out of a total of 443 households in Metlakatla, 354 (79.9%) are family households, while 89 (20.1%) are nonfamily households. The most numerous type of family households are 2-person households, comprising 133, and the most common type of nonfamily households are 1-person households, comprising 62.
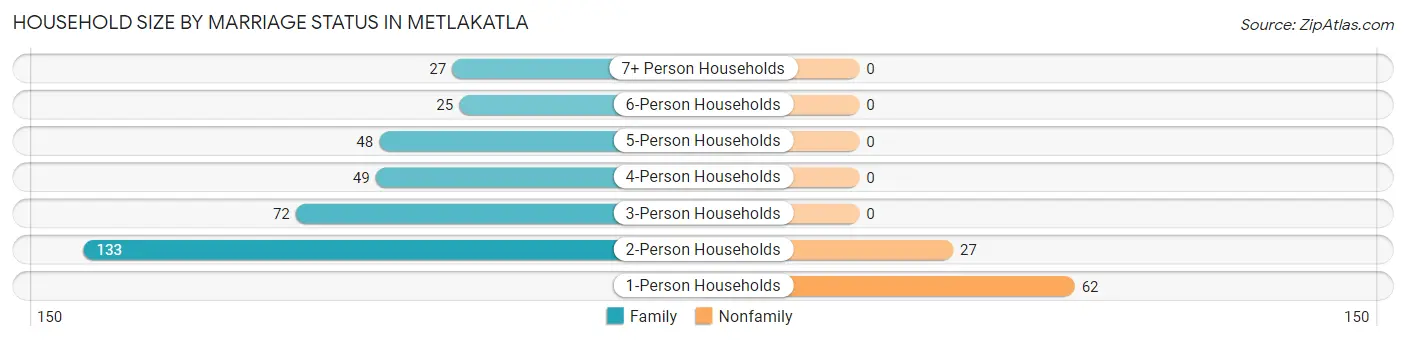
| Household Size | Family Households | Nonfamily Households |
| 1-Person Households | - | 62 (14.0%) |
| 2-Person Households | 133 (30.0%) | 27 (6.1%) |
| 3-Person Households | 72 (16.3%) | 0 (0.0%) |
| 4-Person Households | 49 (11.1%) | 0 (0.0%) |
| 5-Person Households | 48 (10.8%) | 0 (0.0%) |
| 6-Person Households | 25 (5.6%) | 0 (0.0%) |
| 7+ Person Households | 27 (6.1%) | 0 (0.0%) |
| Total | 354 (79.9%) | 89 (20.1%) |
Female Fertility in Metlakatla
Fertility by Age in Metlakatla
Average fertility rate in Metlakatla is 35.0 births per 1,000 women. Women in the age bracket of 20 to 34 years have the highest fertility rate with 46.0 births per 1,000 women. Women in the age bracket of 20 to 34 years acount for 55.6% of all women with births.
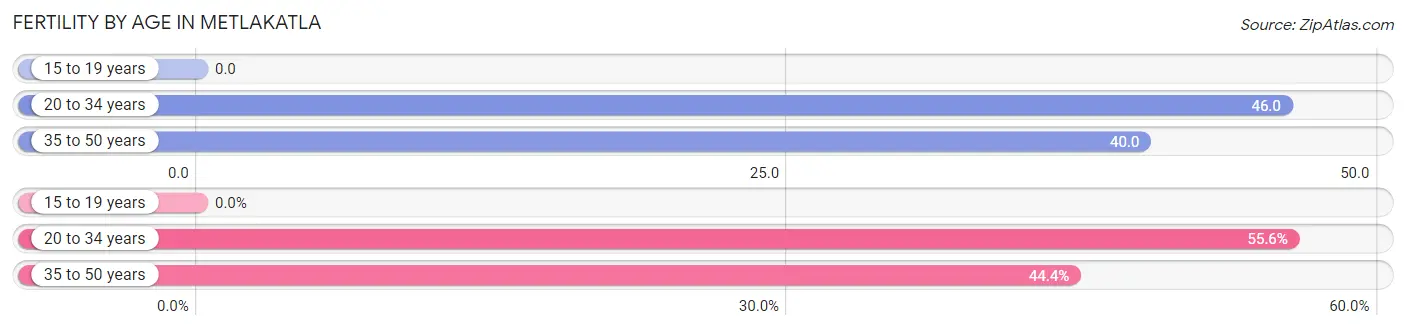
| Age Bracket | Women with Births | Births / 1,000 Women |
| 15 to 19 years | 0 (0.0%) | 0.0 |
| 20 to 34 years | 5 (55.6%) | 46.0 |
| 35 to 50 years | 4 (44.4%) | 40.0 |
| Total | 9 (100.0%) | 35.0 |
Fertility by Age by Marriage Status in Metlakatla
44.4% of women with births (9) in Metlakatla are married. The highest percentage of unmarried women with births falls into 20 to 34 years age bracket with 100.0% of them unmarried at the time of birth, while the lowest percentage of unmarried women with births belong to 35 to 50 years age bracket with 0.0% of them unmarried.
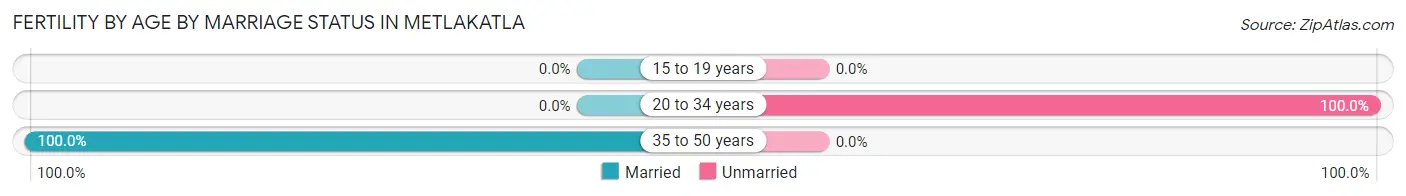
| Age Bracket | Married | Unmarried |
| 15 to 19 years | 0 (0.0%) | 0 (0.0%) |
| 20 to 34 years | 0 (0.0%) | 5 (100.0%) |
| 35 to 50 years | 4 (100.0%) | 0 (0.0%) |
| Total | 4 (44.4%) | 5 (55.6%) |
Fertility by Education in Metlakatla
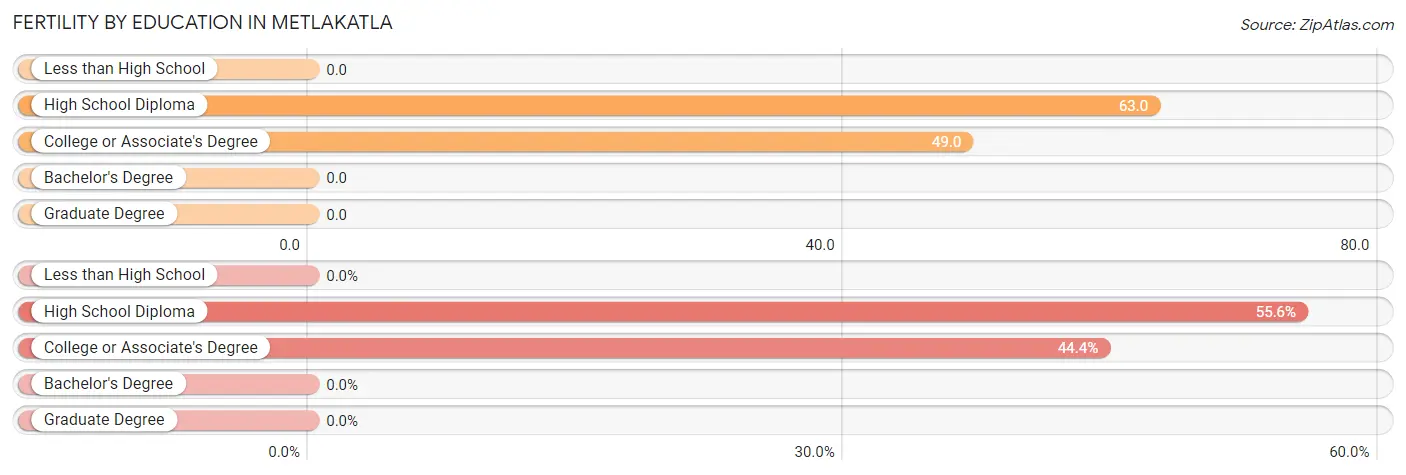
| Educational Attainment | Women with Births | Births / 1,000 Women |
| Less than High School | 0 (0.0%) | 0.0 |
| High School Diploma | 5 (55.6%) | 63.0 |
| College or Associate's Degree | 4 (44.4%) | 49.0 |
| Bachelor's Degree | 0 (0.0%) | 0.0 |
| Graduate Degree | 0 (0.0%) | 0.0 |
| Total | 9 (100.0%) | 35.0 |
Fertility by Education by Marriage Status in Metlakatla
55.6% of women with births in Metlakatla are unmarried. Women with the educational attainment of college or associate's degree are most likely to be married with 100.0% of them married at childbirth, while women with the educational attainment of high school diploma are least likely to be married with 100.0% of them unmarried at childbirth.
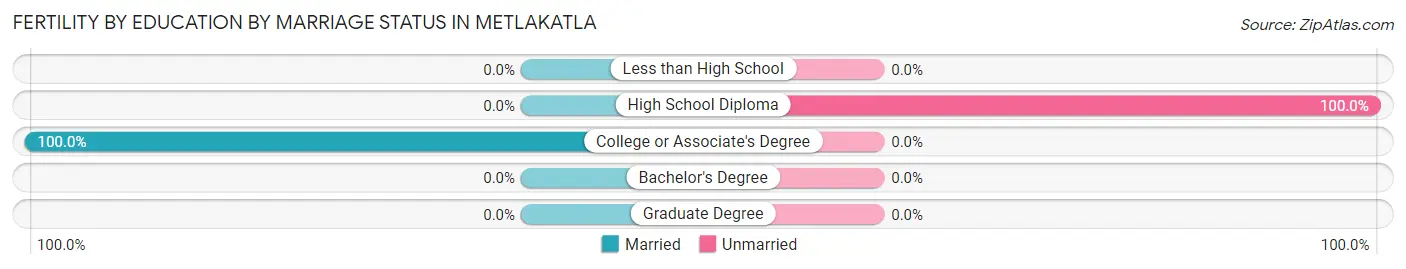
| Educational Attainment | Married | Unmarried |
| Less than High School | 0 (0.0%) | 0 (0.0%) |
| High School Diploma | 0 (0.0%) | 5 (100.0%) |
| College or Associate's Degree | 4 (100.0%) | 0 (0.0%) |
| Bachelor's Degree | 0 (0.0%) | 0 (0.0%) |
| Graduate Degree | 0 (0.0%) | 0 (0.0%) |
| Total | 4 (44.4%) | 5 (55.6%) |
Employment Characteristics in Metlakatla
Employment by Class of Employer in Metlakatla
Among the 569 employed individuals in Metlakatla, local government employees (272 | 47.8%), not-for-profit organizations (79 | 13.9%), and private company employees (75 | 13.2%) make up the most common classes of employment.
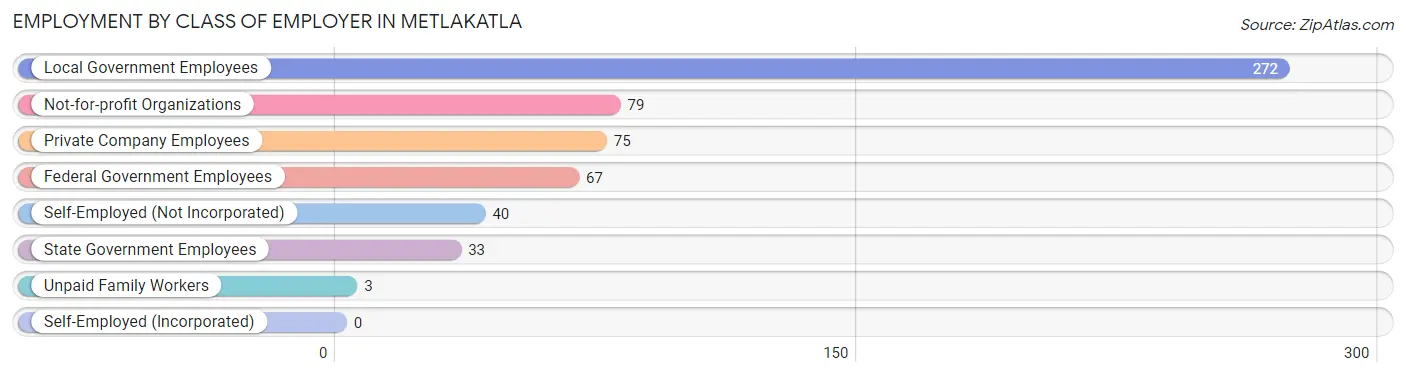
| Employer Class | # Employees | % Employees |
| Private Company Employees | 75 | 13.2% |
| Self-Employed (Incorporated) | 0 | 0.0% |
| Self-Employed (Not Incorporated) | 40 | 7.0% |
| Not-for-profit Organizations | 79 | 13.9% |
| Local Government Employees | 272 | 47.8% |
| State Government Employees | 33 | 5.8% |
| Federal Government Employees | 67 | 11.8% |
| Unpaid Family Workers | 3 | 0.5% |
| Total | 569 | 100.0% |
Employment Status by Age in Metlakatla
According to the labor force statistics for Metlakatla, out of the total population over 16 years of age (1,127), 60.7% or 684 individuals are in the labor force, with 12.0% or 82 of them unemployed. The age group with the highest labor force participation rate is 25 to 29 years, with 100.0% or 83 individuals in the labor force. Within the labor force, the 20 to 24 years age range has the highest percentage of unemployed individuals, with 37.5% or 18 of them being unemployed.
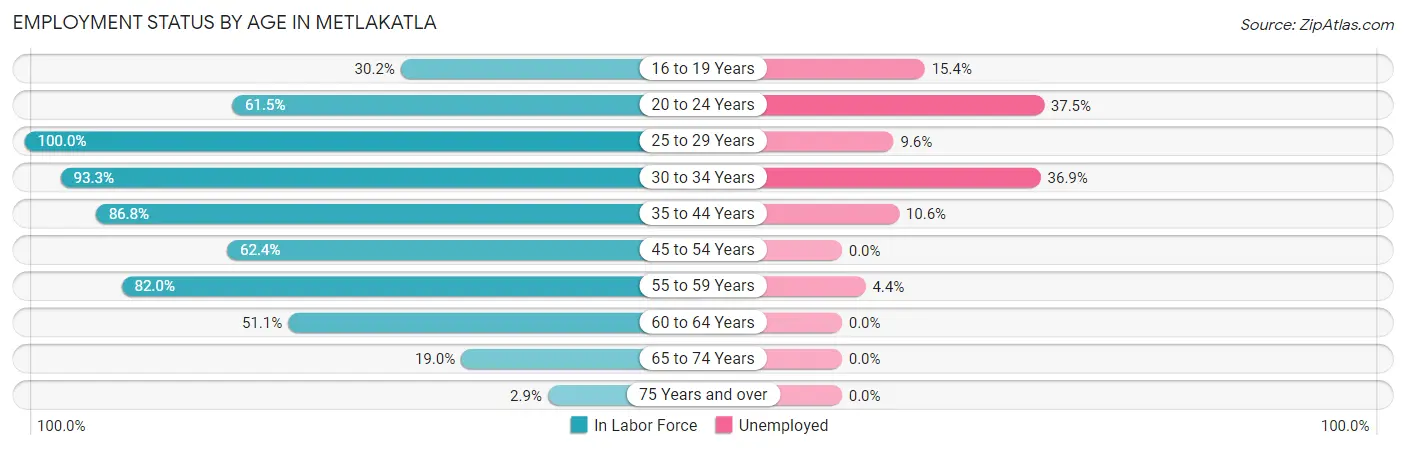
| Age Bracket | In Labor Force | Unemployed |
| 16 to 19 Years | 26 (30.2%) | 4 (15.4%) |
| 20 to 24 Years | 48 (61.5%) | 18 (37.5%) |
| 25 to 29 Years | 83 (100.0%) | 8 (9.6%) |
| 30 to 34 Years | 84 (93.3%) | 31 (36.9%) |
| 35 to 44 Years | 151 (86.8%) | 16 (10.6%) |
| 45 to 54 Years | 98 (62.4%) | 0 (0.0%) |
| 55 to 59 Years | 114 (82.0%) | 5 (4.4%) |
| 60 to 64 Years | 48 (51.1%) | 0 (0.0%) |
| 65 to 74 Years | 30 (19.0%) | 0 (0.0%) |
| 75 Years and over | 2 (2.9%) | 0 (0.0%) |
| Total | 684 (60.7%) | 82 (12.0%) |
Employment Status by Educational Attainment in Metlakatla
According to labor force statistics for Metlakatla, 78.4% of individuals (578) out of the total population between 25 and 64 years of age (737) are in the labor force, with 10.4% or 60 of them being unemployed. The group with the highest labor force participation rate are those with the educational attainment of bachelor's degree or higher, with 87.0% or 67 individuals in the labor force. Within the labor force, individuals with less than high school education have the highest percentage of unemployment, with 29.7% or 11 of them being unemployed.
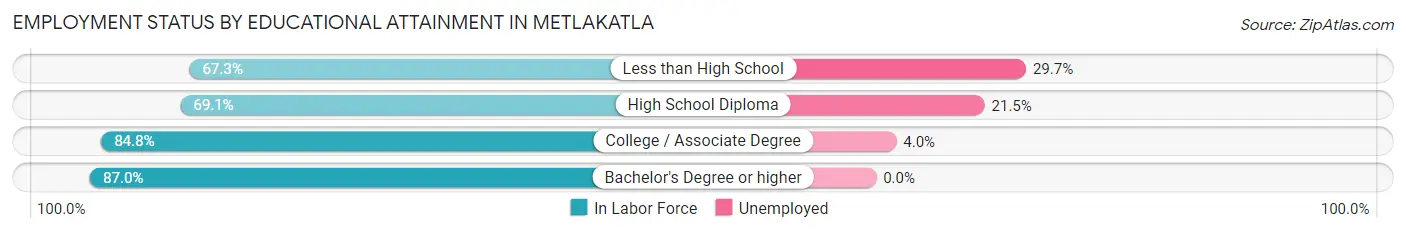
| Educational Attainment | In Labor Force | Unemployed |
| Less than High School | 37 (67.3%) | 16 (29.7%) |
| High School Diploma | 172 (69.1%) | 54 (21.5%) |
| College / Associate Degree | 302 (84.8%) | 14 (4.0%) |
| Bachelor's Degree or higher | 67 (87.0%) | 0 (0.0%) |
| Total | 578 (78.4%) | 77 (10.4%) |
Employment Occupations by Sex in Metlakatla
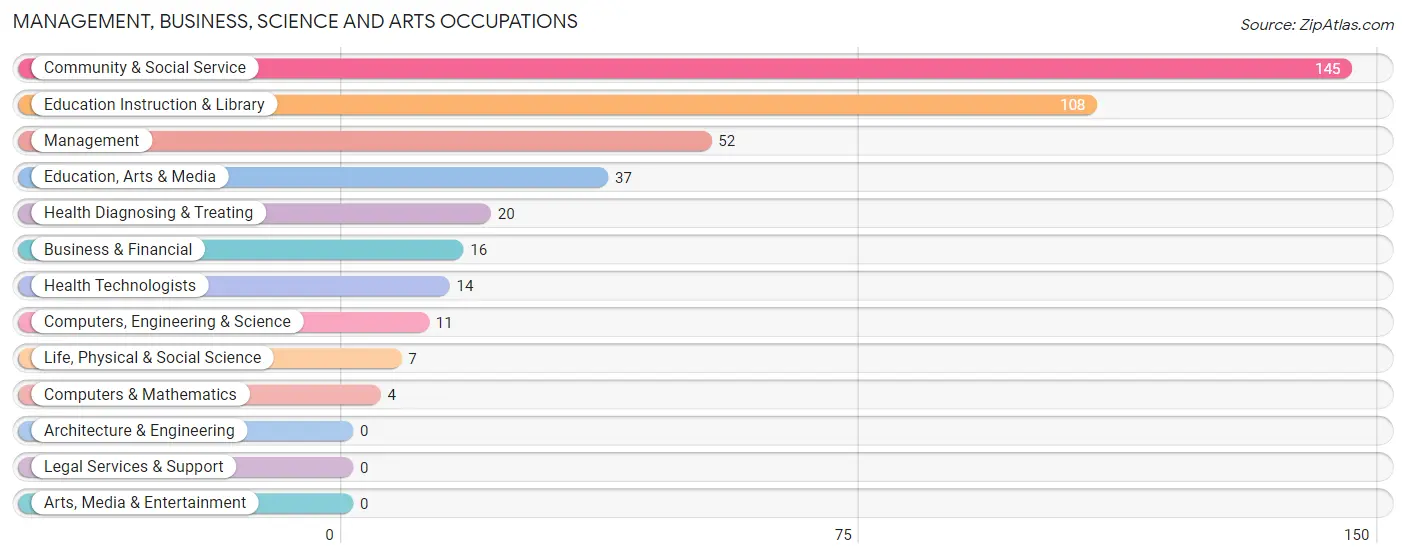
Management, Business, Science and Arts Occupations
The most common Management, Business, Science and Arts occupations in Metlakatla are Community & Social Service (145 | 24.1%), Education Instruction & Library (108 | 17.9%), Management (52 | 8.6%), Education, Arts & Media (37 | 6.1%), and Health Diagnosing & Treating (20 | 3.3%).
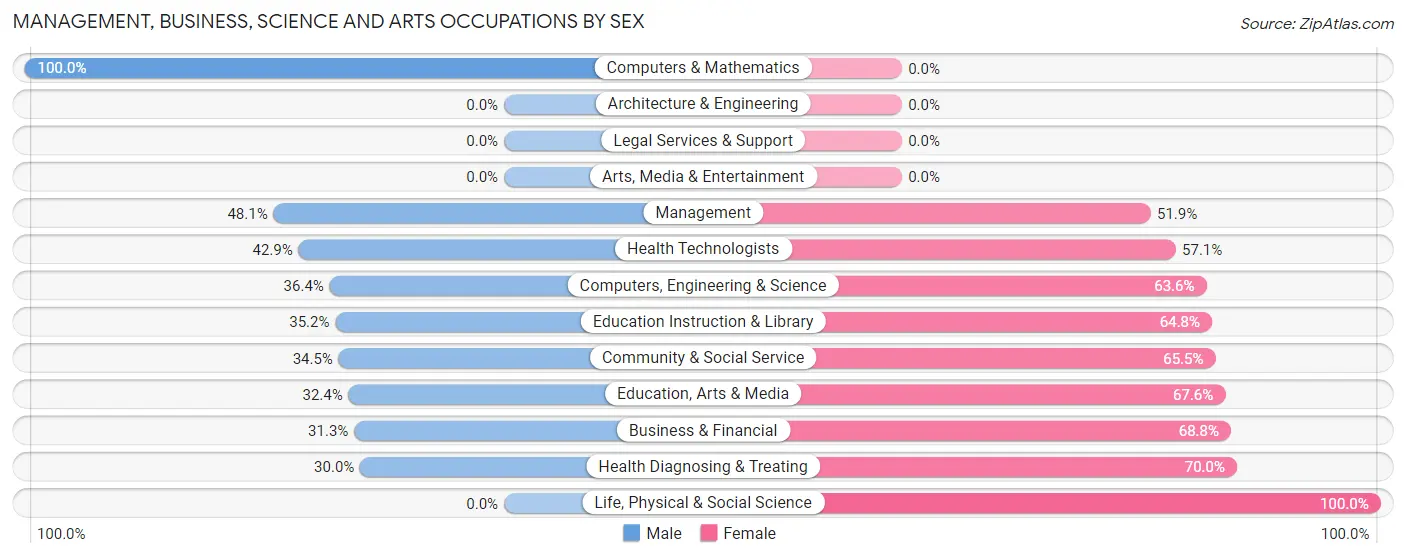
Management, Business, Science and Arts Occupations by Sex
Within the Management, Business, Science and Arts occupations in Metlakatla, the most male-oriented occupations are Computers & Mathematics (100.0%), Management (48.1%), and Health Technologists (42.9%), while the most female-oriented occupations are Life, Physical & Social Science (100.0%), Health Diagnosing & Treating (70.0%), and Business & Financial (68.8%).
| Occupation | Male | Female |
| Management | 25 (48.1%) | 27 (51.9%) |
| Business & Financial | 5 (31.2%) | 11 (68.8%) |
| Computers, Engineering & Science | 4 (36.4%) | 7 (63.6%) |
| Computers & Mathematics | 4 (100.0%) | 0 (0.0%) |
| Architecture & Engineering | 0 (0.0%) | 0 (0.0%) |
| Life, Physical & Social Science | 0 (0.0%) | 7 (100.0%) |
| Community & Social Service | 50 (34.5%) | 95 (65.5%) |
| Education, Arts & Media | 12 (32.4%) | 25 (67.6%) |
| Legal Services & Support | 0 (0.0%) | 0 (0.0%) |
| Education Instruction & Library | 38 (35.2%) | 70 (64.8%) |
| Arts, Media & Entertainment | 0 (0.0%) | 0 (0.0%) |
| Health Diagnosing & Treating | 6 (30.0%) | 14 (70.0%) |
| Health Technologists | 6 (42.9%) | 8 (57.1%) |
| Total (Category) | 90 (36.9%) | 154 (63.1%) |
| Total (Overall) | 349 (58.0%) | 253 (42.0%) |
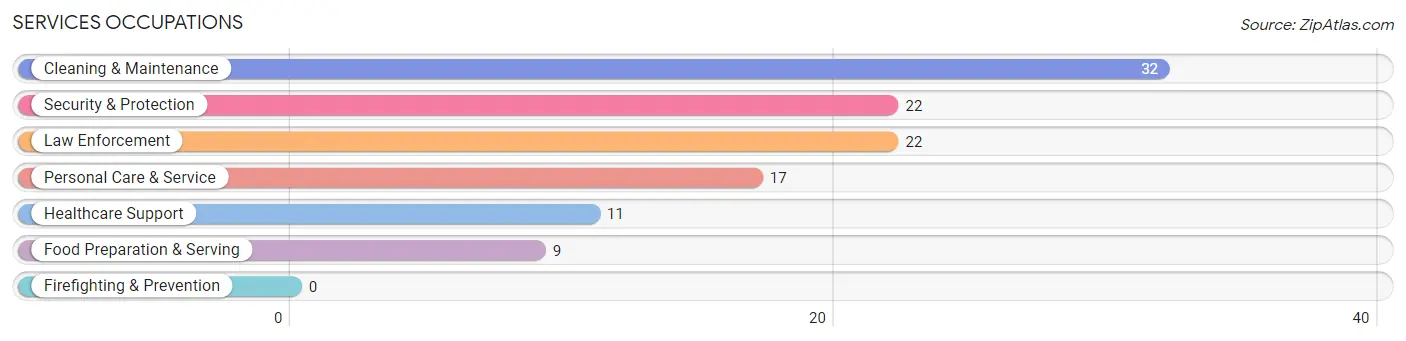
Services Occupations
The most common Services occupations in Metlakatla are Cleaning & Maintenance (32 | 5.3%), Security & Protection (22 | 3.6%), Law Enforcement (22 | 3.6%), Personal Care & Service (17 | 2.8%), and Healthcare Support (11 | 1.8%).
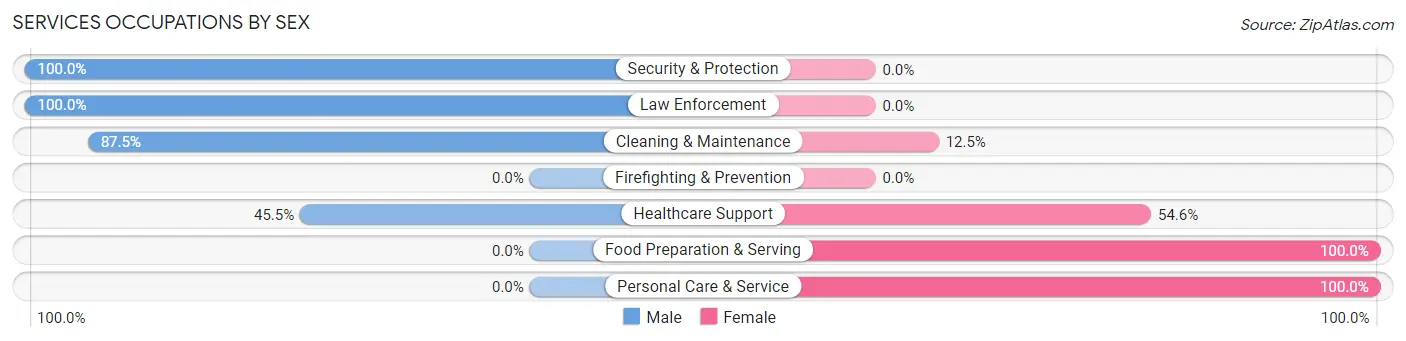
Services Occupations by Sex
Within the Services occupations in Metlakatla, the most male-oriented occupations are Security & Protection (100.0%), Law Enforcement (100.0%), and Cleaning & Maintenance (87.5%), while the most female-oriented occupations are Food Preparation & Serving (100.0%), Personal Care & Service (100.0%), and Healthcare Support (54.5%).
| Occupation | Male | Female |
| Healthcare Support | 5 (45.5%) | 6 (54.5%) |
| Security & Protection | 22 (100.0%) | 0 (0.0%) |
| Firefighting & Prevention | 0 (0.0%) | 0 (0.0%) |
| Law Enforcement | 22 (100.0%) | 0 (0.0%) |
| Food Preparation & Serving | 0 (0.0%) | 9 (100.0%) |
| Cleaning & Maintenance | 28 (87.5%) | 4 (12.5%) |
| Personal Care & Service | 0 (0.0%) | 17 (100.0%) |
| Total (Category) | 55 (60.4%) | 36 (39.6%) |
| Total (Overall) | 349 (58.0%) | 253 (42.0%) |
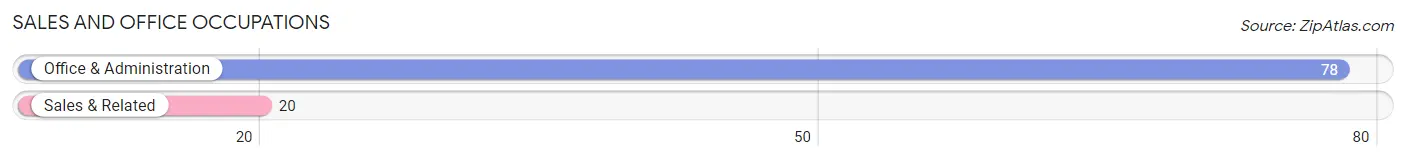
Sales and Office Occupations
The most common Sales and Office occupations in Metlakatla are Office & Administration (78 | 13.0%), and Sales & Related (20 | 3.3%).
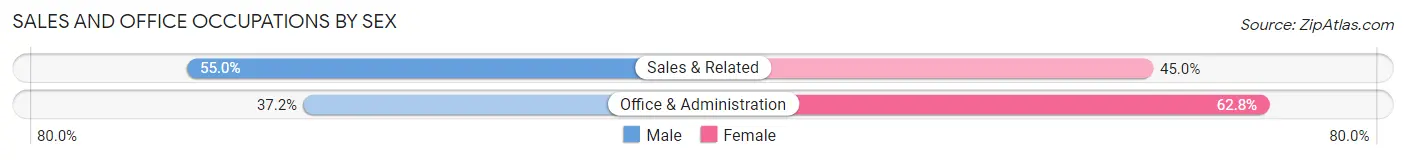
Sales and Office Occupations by Sex
| Occupation | Male | Female |
| Sales & Related | 11 (55.0%) | 9 (45.0%) |
| Office & Administration | 29 (37.2%) | 49 (62.8%) |
| Total (Category) | 40 (40.8%) | 58 (59.2%) |
| Total (Overall) | 349 (58.0%) | 253 (42.0%) |
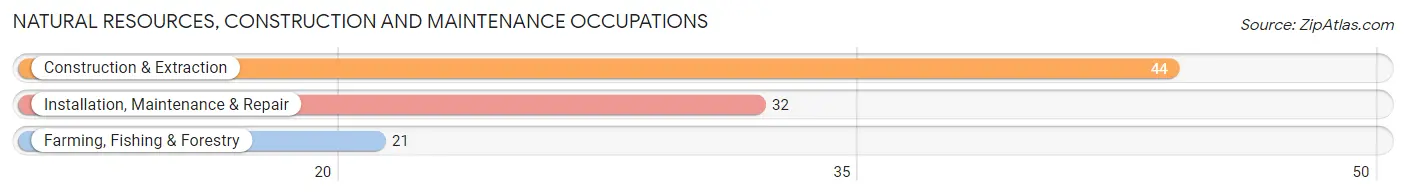
Natural Resources, Construction and Maintenance Occupations
The most common Natural Resources, Construction and Maintenance occupations in Metlakatla are Construction & Extraction (44 | 7.3%), Installation, Maintenance & Repair (32 | 5.3%), and Farming, Fishing & Forestry (21 | 3.5%).
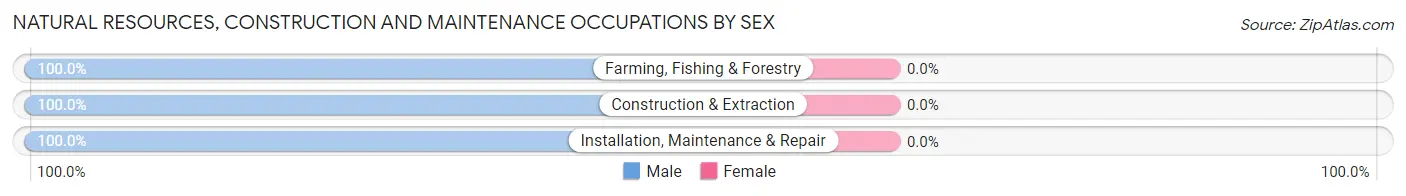
Natural Resources, Construction and Maintenance Occupations by Sex
| Occupation | Male | Female |
| Farming, Fishing & Forestry | 21 (100.0%) | 0 (0.0%) |
| Construction & Extraction | 44 (100.0%) | 0 (0.0%) |
| Installation, Maintenance & Repair | 32 (100.0%) | 0 (0.0%) |
| Total (Category) | 97 (100.0%) | 0 (0.0%) |
| Total (Overall) | 349 (58.0%) | 253 (42.0%) |
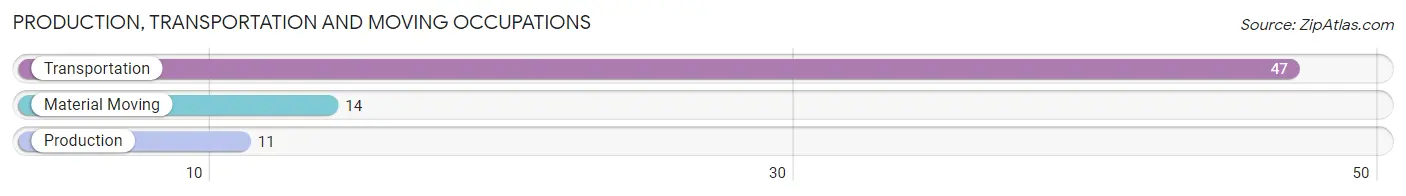
Production, Transportation and Moving Occupations
The most common Production, Transportation and Moving occupations in Metlakatla are Transportation (47 | 7.8%), Material Moving (14 | 2.3%), and Production (11 | 1.8%).
Production, Transportation and Moving Occupations by Sex
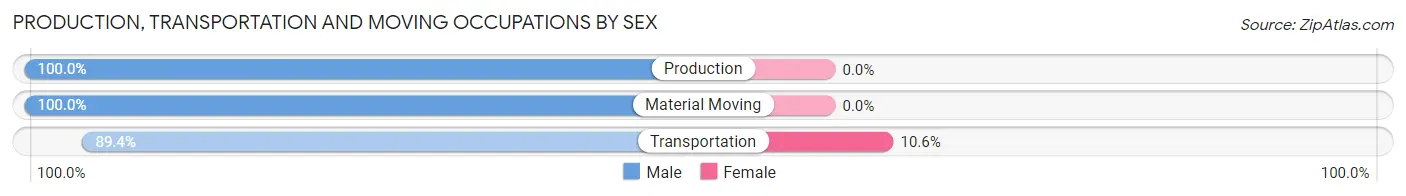
| Occupation | Male | Female |
| Production | 11 (100.0%) | 0 (0.0%) |
| Transportation | 42 (89.4%) | 5 (10.6%) |
| Material Moving | 14 (100.0%) | 0 (0.0%) |
| Total (Category) | 67 (93.1%) | 5 (6.9%) |
| Total (Overall) | 349 (58.0%) | 253 (42.0%) |
Employment Industries by Sex in Metlakatla
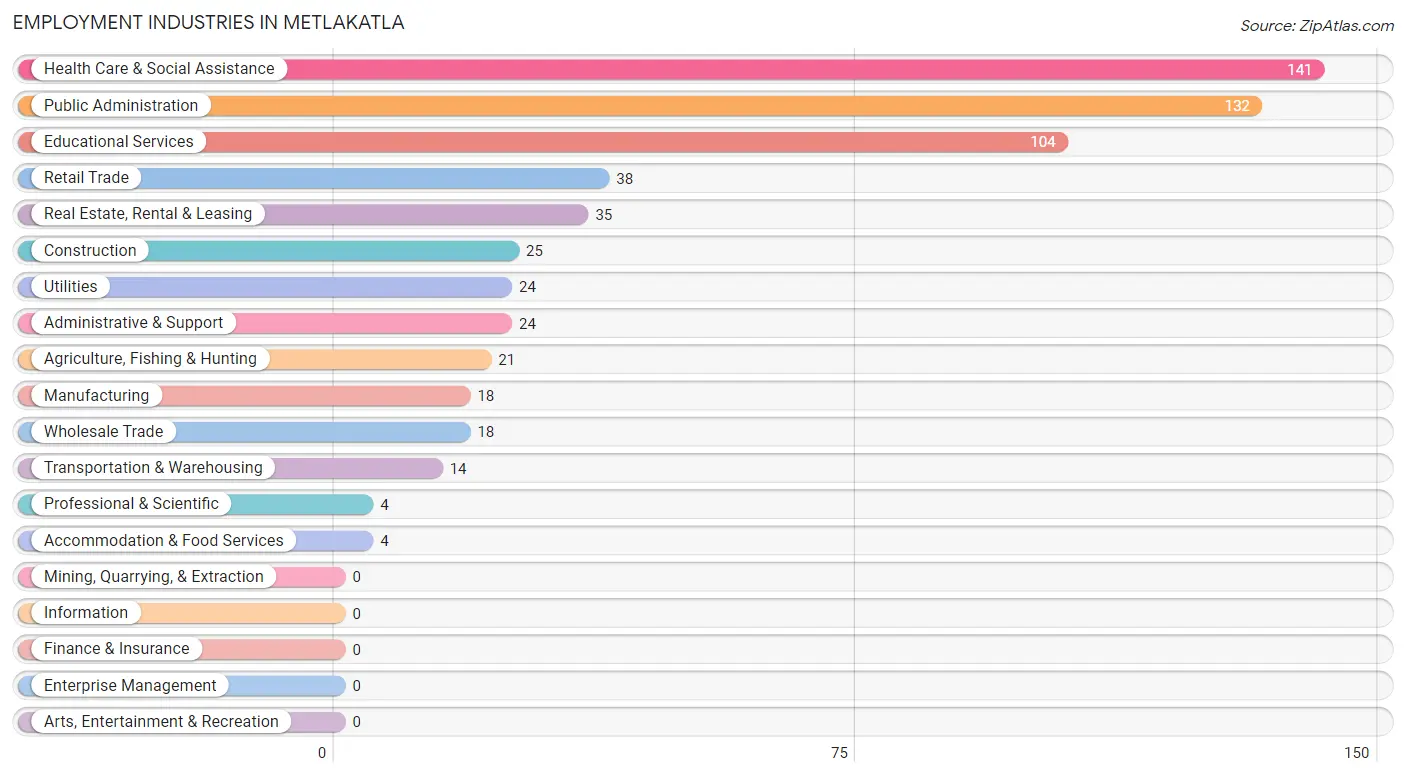
Employment Industries in Metlakatla
The major employment industries in Metlakatla include Health Care & Social Assistance (141 | 23.4%), Public Administration (132 | 21.9%), Educational Services (104 | 17.3%), Retail Trade (38 | 6.3%), and Real Estate, Rental & Leasing (35 | 5.8%).
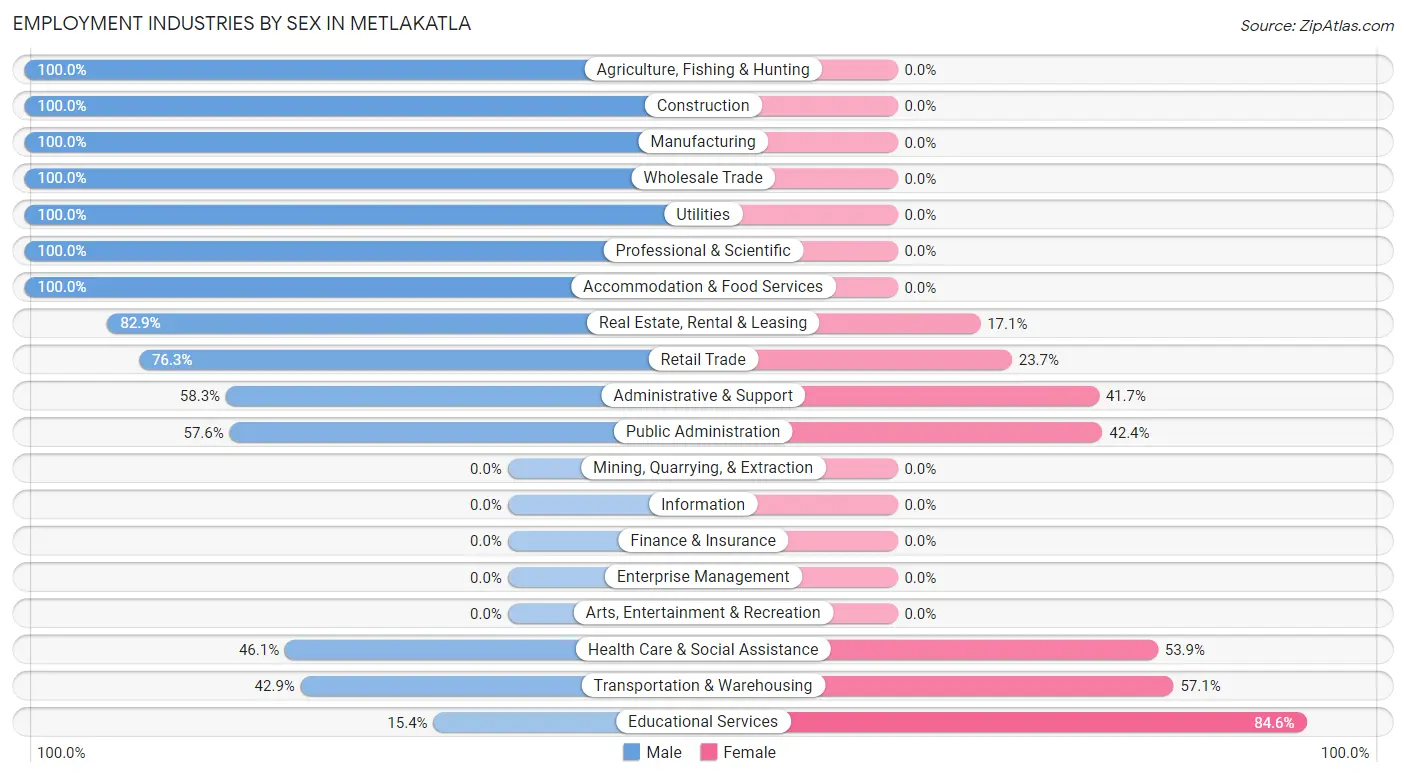
Employment Industries by Sex in Metlakatla
The Metlakatla industries that see more men than women are Agriculture, Fishing & Hunting (100.0%), Construction (100.0%), and Manufacturing (100.0%), whereas the industries that tend to have a higher number of women are Educational Services (84.6%), Transportation & Warehousing (57.1%), and Health Care & Social Assistance (53.9%).
| Industry | Male | Female |
| Agriculture, Fishing & Hunting | 21 (100.0%) | 0 (0.0%) |
| Mining, Quarrying, & Extraction | 0 (0.0%) | 0 (0.0%) |
| Construction | 25 (100.0%) | 0 (0.0%) |
| Manufacturing | 18 (100.0%) | 0 (0.0%) |
| Wholesale Trade | 18 (100.0%) | 0 (0.0%) |
| Retail Trade | 29 (76.3%) | 9 (23.7%) |
| Transportation & Warehousing | 6 (42.9%) | 8 (57.1%) |
| Utilities | 24 (100.0%) | 0 (0.0%) |
| Information | 0 (0.0%) | 0 (0.0%) |
| Finance & Insurance | 0 (0.0%) | 0 (0.0%) |
| Real Estate, Rental & Leasing | 29 (82.9%) | 6 (17.1%) |
| Professional & Scientific | 4 (100.0%) | 0 (0.0%) |
| Enterprise Management | 0 (0.0%) | 0 (0.0%) |
| Administrative & Support | 14 (58.3%) | 10 (41.7%) |
| Educational Services | 16 (15.4%) | 88 (84.6%) |
| Health Care & Social Assistance | 65 (46.1%) | 76 (53.9%) |
| Arts, Entertainment & Recreation | 0 (0.0%) | 0 (0.0%) |
| Accommodation & Food Services | 4 (100.0%) | 0 (0.0%) |
| Public Administration | 76 (57.6%) | 56 (42.4%) |
| Total | 349 (58.0%) | 253 (42.0%) |
Education in Metlakatla
School Enrollment in Metlakatla
The most common levels of schooling among the 382 students in Metlakatla are middle school (102 | 26.7%), high school (94 | 24.6%), and elementary school (78 | 20.4%).
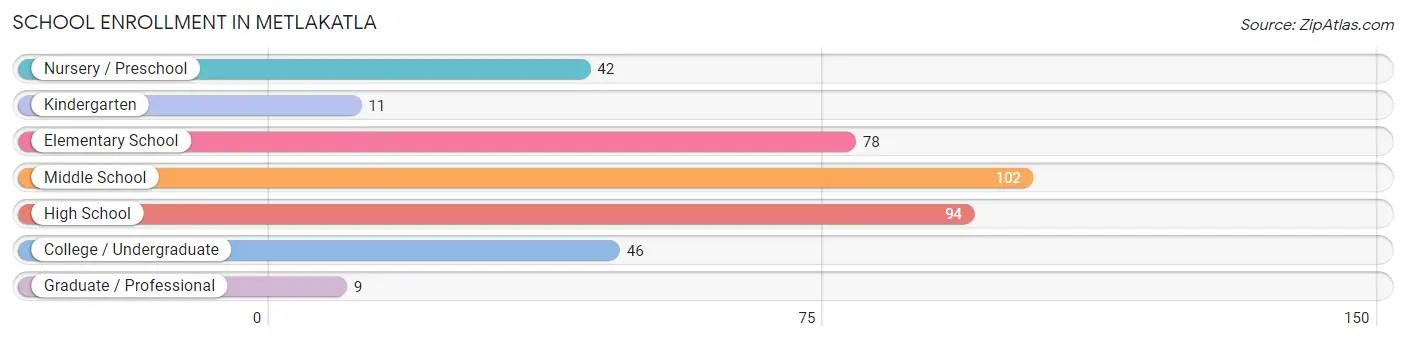
| School Level | # Students | % Students |
| Nursery / Preschool | 42 | 11.0% |
| Kindergarten | 11 | 2.9% |
| Elementary School | 78 | 20.4% |
| Middle School | 102 | 26.7% |
| High School | 94 | 24.6% |
| College / Undergraduate | 46 | 12.0% |
| Graduate / Professional | 9 | 2.4% |
| Total | 382 | 100.0% |
School Enrollment by Age by Funding Source in Metlakatla
Out of a total of 382 students who are enrolled in schools in Metlakatla, 16 (4.2%) attend a private institution, while the remaining 366 (95.8%) are enrolled in public schools. The age group of 20 to 24 year olds has the highest likelihood of being enrolled in private schools, with 8 (100.0% in the age bracket) enrolled. Conversely, the age group of 3 to 4 year olds has the lowest likelihood of being enrolled in a private school, with 26 (100.0% in the age bracket) attending a public institution.
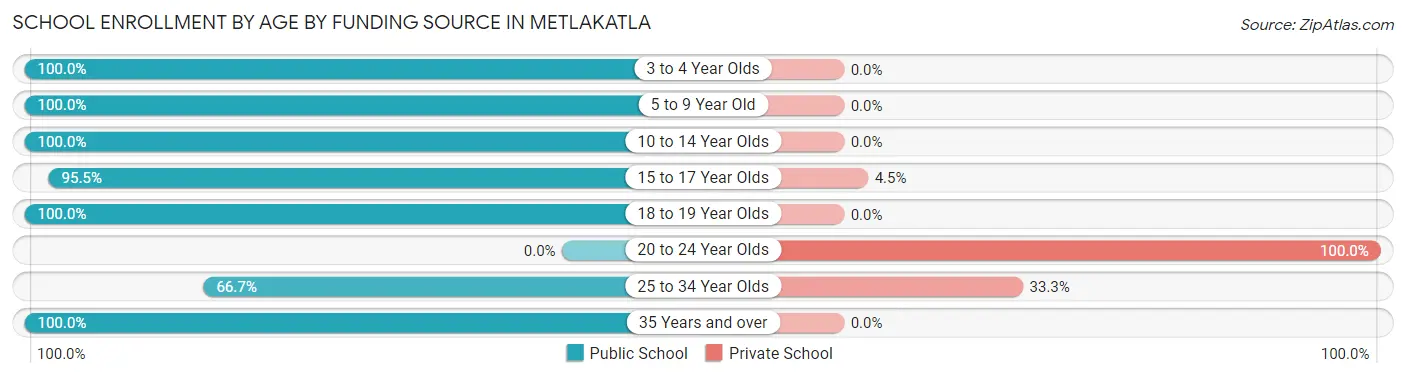
| Age Bracket | Public School | Private School |
| 3 to 4 Year Olds | 26 (100.0%) | 0 (0.0%) |
| 5 to 9 Year Old | 100 (100.0%) | 0 (0.0%) |
| 10 to 14 Year Olds | 126 (100.0%) | 0 (0.0%) |
| 15 to 17 Year Olds | 64 (95.5%) | 3 (4.5%) |
| 18 to 19 Year Olds | 8 (100.0%) | 0 (0.0%) |
| 20 to 24 Year Olds | 0 (0.0%) | 8 (100.0%) |
| 25 to 34 Year Olds | 10 (66.7%) | 5 (33.3%) |
| 35 Years and over | 32 (100.0%) | 0 (0.0%) |
| Total | 366 (95.8%) | 16 (4.2%) |
Educational Attainment by Field of Study in Metlakatla
Education (44 | 40.7%), literature & languages (16 | 14.8%), bio, nature & agricultural (14 | 13.0%), social sciences (6 | 5.6%), and science & technology (6 | 5.6%) are the most common fields of study among 108 individuals in Metlakatla who have obtained a bachelor's degree or higher.
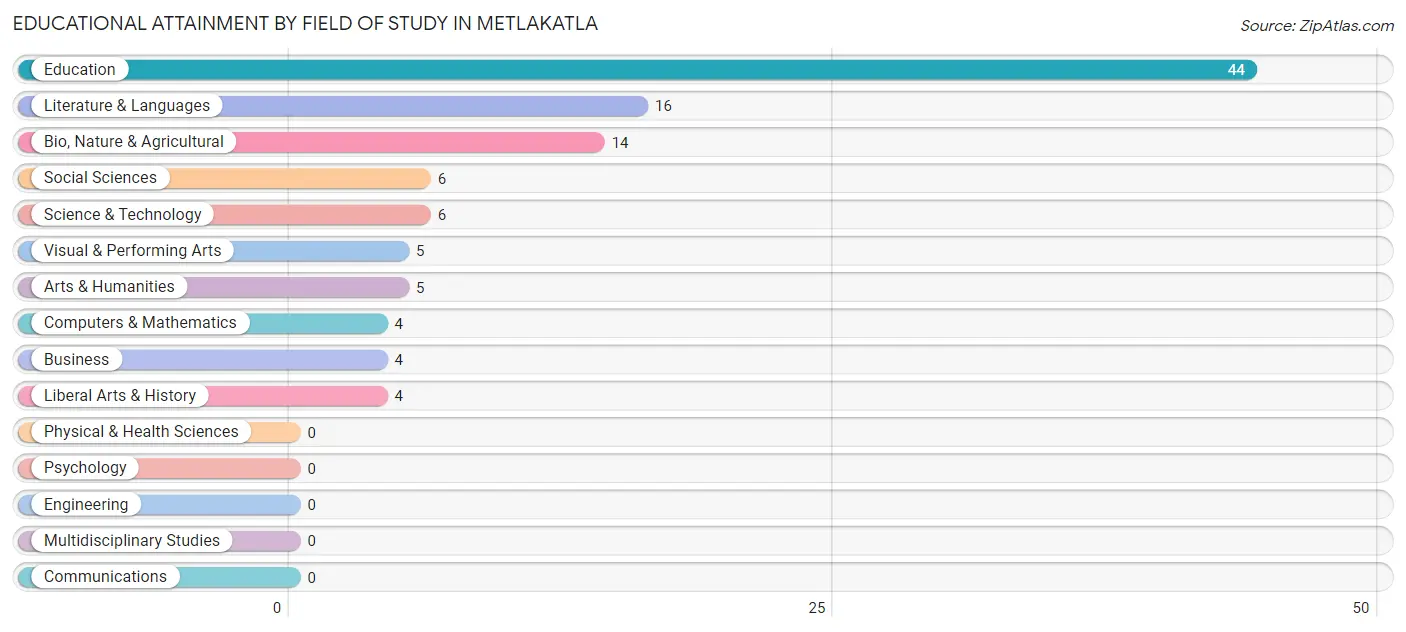
| Field of Study | # Graduates | % Graduates |
| Computers & Mathematics | 4 | 3.7% |
| Bio, Nature & Agricultural | 14 | 13.0% |
| Physical & Health Sciences | 0 | 0.0% |
| Psychology | 0 | 0.0% |
| Social Sciences | 6 | 5.6% |
| Engineering | 0 | 0.0% |
| Multidisciplinary Studies | 0 | 0.0% |
| Science & Technology | 6 | 5.6% |
| Business | 4 | 3.7% |
| Education | 44 | 40.7% |
| Literature & Languages | 16 | 14.8% |
| Liberal Arts & History | 4 | 3.7% |
| Visual & Performing Arts | 5 | 4.6% |
| Communications | 0 | 0.0% |
| Arts & Humanities | 5 | 4.6% |
| Total | 108 | 100.0% |
Transportation & Commute in Metlakatla
Vehicle Availability by Sex in Metlakatla
The most prevalent vehicle ownership categories in Metlakatla are males with 2 vehicles (163, accounting for 50.8%) and females with 2 vehicles (119, making up 67.1%).
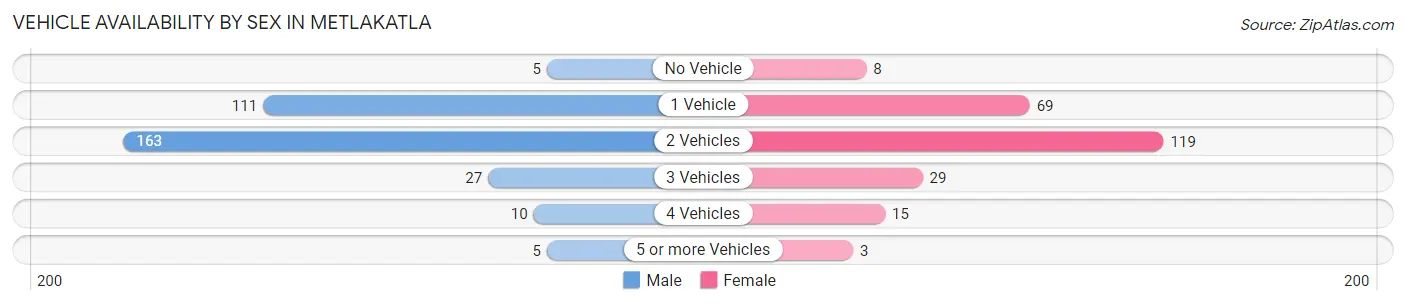
| Vehicles Available | Male | Female |
| No Vehicle | 5 (1.6%) | 8 (3.3%) |
| 1 Vehicle | 111 (34.6%) | 69 (28.4%) |
| 2 Vehicles | 163 (50.8%) | 119 (49.0%) |
| 3 Vehicles | 27 (8.4%) | 29 (11.9%) |
| 4 Vehicles | 10 (3.1%) | 15 (6.2%) |
| 5 or more Vehicles | 5 (1.6%) | 3 (1.2%) |
| Total | 321 (100.0%) | 243 (100.0%) |
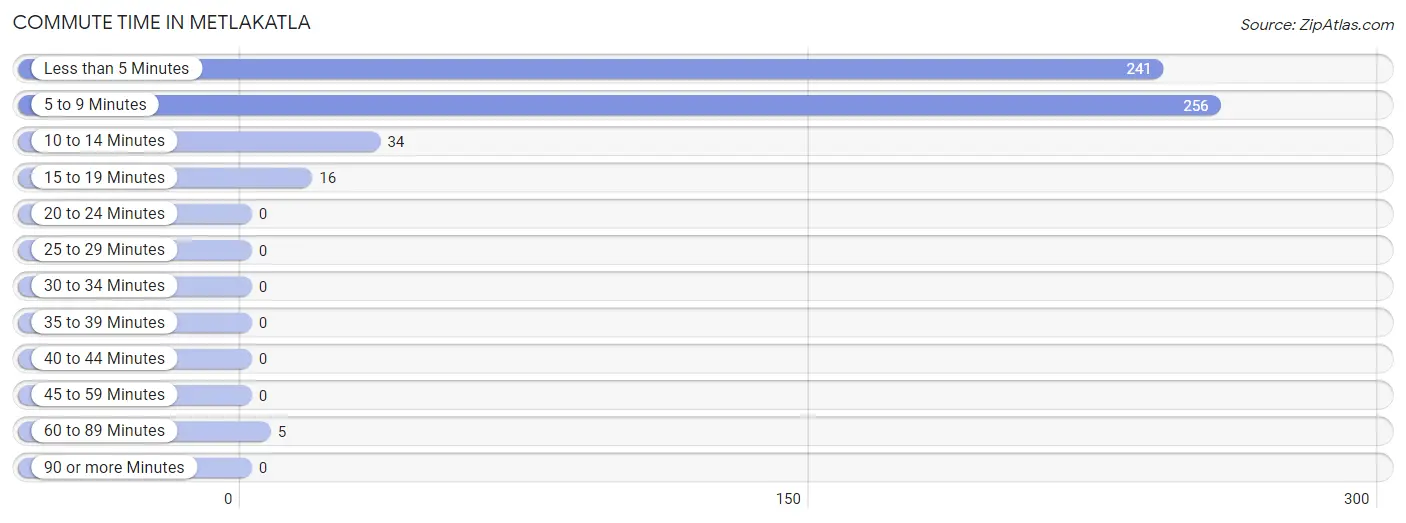
Commute Time in Metlakatla
The most frequently occuring commute durations in Metlakatla are 5 to 9 minutes (256 commuters, 46.4%), less than 5 minutes (241 commuters, 43.7%), and 10 to 14 minutes (34 commuters, 6.2%).
| Commute Time | # Commuters | % Commuters |
| Less than 5 Minutes | 241 | 43.7% |
| 5 to 9 Minutes | 256 | 46.4% |
| 10 to 14 Minutes | 34 | 6.2% |
| 15 to 19 Minutes | 16 | 2.9% |
| 20 to 24 Minutes | 0 | 0.0% |
| 25 to 29 Minutes | 0 | 0.0% |
| 30 to 34 Minutes | 0 | 0.0% |
| 35 to 39 Minutes | 0 | 0.0% |
| 40 to 44 Minutes | 0 | 0.0% |
| 45 to 59 Minutes | 0 | 0.0% |
| 60 to 89 Minutes | 5 | 0.9% |
| 90 or more Minutes | 0 | 0.0% |
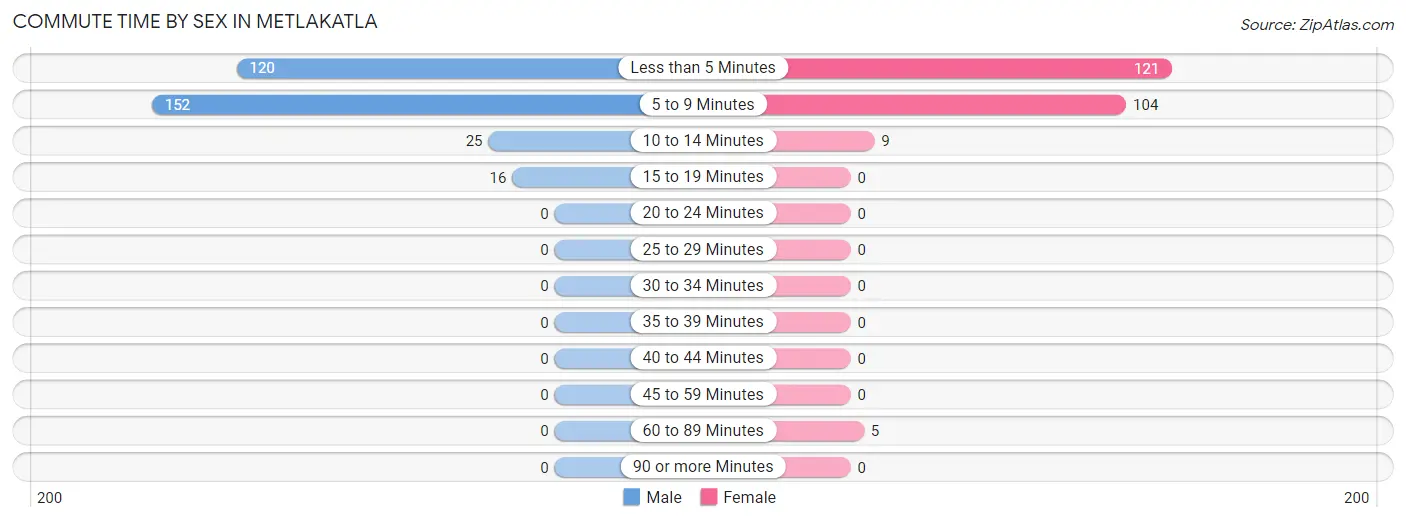
Commute Time by Sex in Metlakatla
The most common commute times in Metlakatla are 5 to 9 minutes (152 commuters, 48.6%) for males and less than 5 minutes (121 commuters, 50.6%) for females.
| Commute Time | Male | Female |
| Less than 5 Minutes | 120 (38.3%) | 121 (50.6%) |
| 5 to 9 Minutes | 152 (48.6%) | 104 (43.5%) |
| 10 to 14 Minutes | 25 (8.0%) | 9 (3.8%) |
| 15 to 19 Minutes | 16 (5.1%) | 0 (0.0%) |
| 20 to 24 Minutes | 0 (0.0%) | 0 (0.0%) |
| 25 to 29 Minutes | 0 (0.0%) | 0 (0.0%) |
| 30 to 34 Minutes | 0 (0.0%) | 0 (0.0%) |
| 35 to 39 Minutes | 0 (0.0%) | 0 (0.0%) |
| 40 to 44 Minutes | 0 (0.0%) | 0 (0.0%) |
| 45 to 59 Minutes | 0 (0.0%) | 0 (0.0%) |
| 60 to 89 Minutes | 0 (0.0%) | 5 (2.1%) |
| 90 or more Minutes | 0 (0.0%) | 0 (0.0%) |
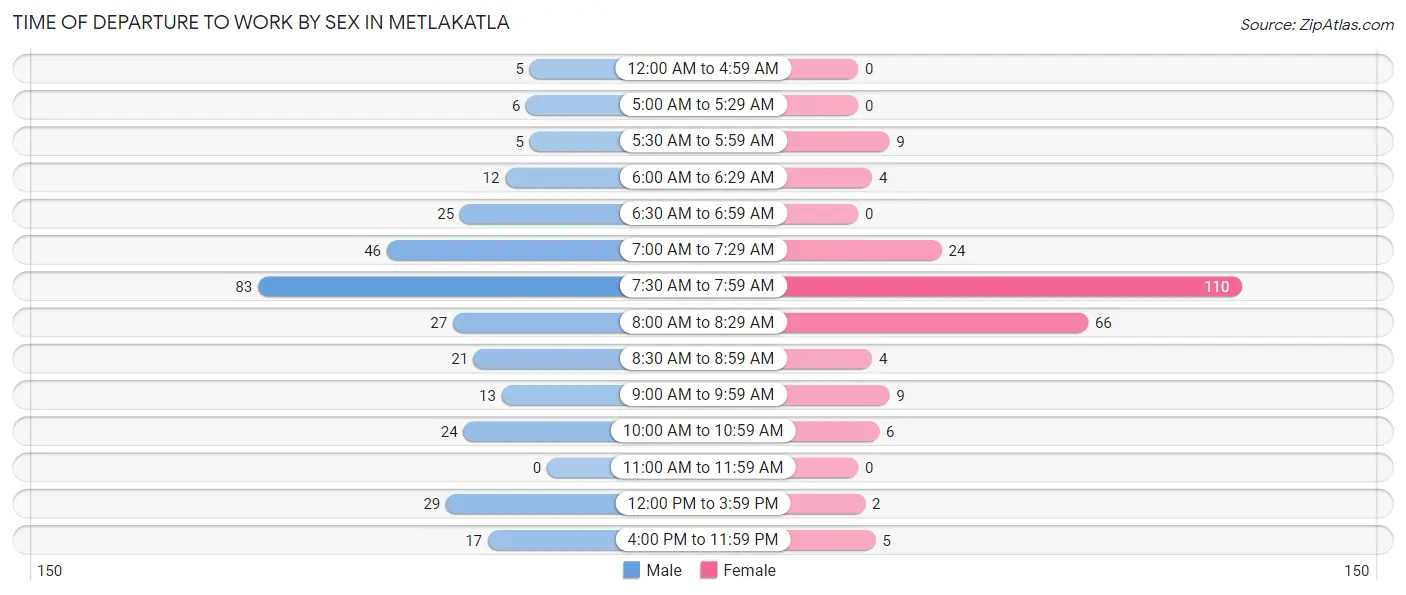
Time of Departure to Work by Sex in Metlakatla
The most frequent times of departure to work in Metlakatla are 7:30 AM to 7:59 AM (83, 26.5%) for males and 7:30 AM to 7:59 AM (110, 46.0%) for females.
| Time of Departure | Male | Female |
| 12:00 AM to 4:59 AM | 5 (1.6%) | 0 (0.0%) |
| 5:00 AM to 5:29 AM | 6 (1.9%) | 0 (0.0%) |
| 5:30 AM to 5:59 AM | 5 (1.6%) | 9 (3.8%) |
| 6:00 AM to 6:29 AM | 12 (3.8%) | 4 (1.7%) |
| 6:30 AM to 6:59 AM | 25 (8.0%) | 0 (0.0%) |
| 7:00 AM to 7:29 AM | 46 (14.7%) | 24 (10.0%) |
| 7:30 AM to 7:59 AM | 83 (26.5%) | 110 (46.0%) |
| 8:00 AM to 8:29 AM | 27 (8.6%) | 66 (27.6%) |
| 8:30 AM to 8:59 AM | 21 (6.7%) | 4 (1.7%) |
| 9:00 AM to 9:59 AM | 13 (4.2%) | 9 (3.8%) |
| 10:00 AM to 10:59 AM | 24 (7.7%) | 6 (2.5%) |
| 11:00 AM to 11:59 AM | 0 (0.0%) | 0 (0.0%) |
| 12:00 PM to 3:59 PM | 29 (9.3%) | 2 (0.8%) |
| 4:00 PM to 11:59 PM | 17 (5.4%) | 5 (2.1%) |
| Total | 313 (100.0%) | 239 (100.0%) |
Housing Occupancy in Metlakatla
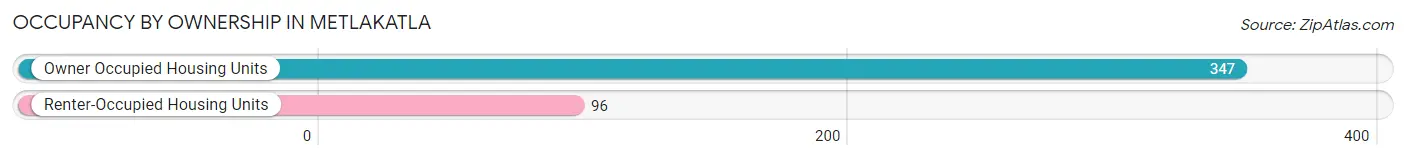
Occupancy by Ownership in Metlakatla
Of the total 443 dwellings in Metlakatla, owner-occupied units account for 347 (78.3%), while renter-occupied units make up 96 (21.7%).
| Occupancy | # Housing Units | % Housing Units |
| Owner Occupied Housing Units | 347 | 78.3% |
| Renter-Occupied Housing Units | 96 | 21.7% |
| Total Occupied Housing Units | 443 | 100.0% |
Occupancy by Household Size in Metlakatla
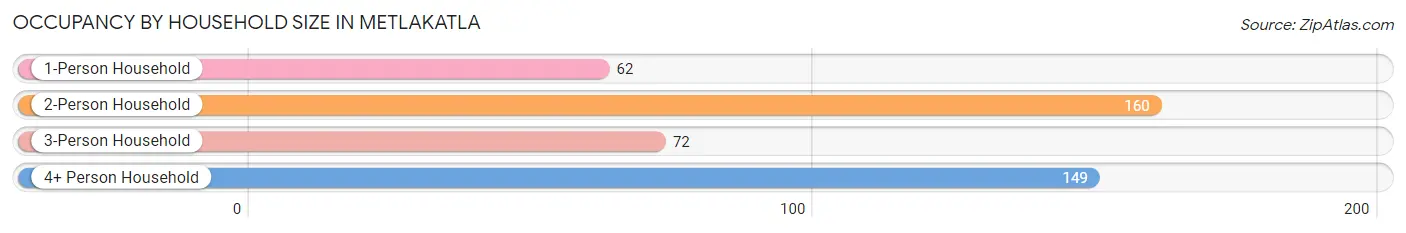
| Household Size | # Housing Units | % Housing Units |
| 1-Person Household | 62 | 14.0% |
| 2-Person Household | 160 | 36.1% |
| 3-Person Household | 72 | 16.3% |
| 4+ Person Household | 149 | 33.6% |
| Total Housing Units | 443 | 100.0% |
Occupancy by Ownership by Household Size in Metlakatla
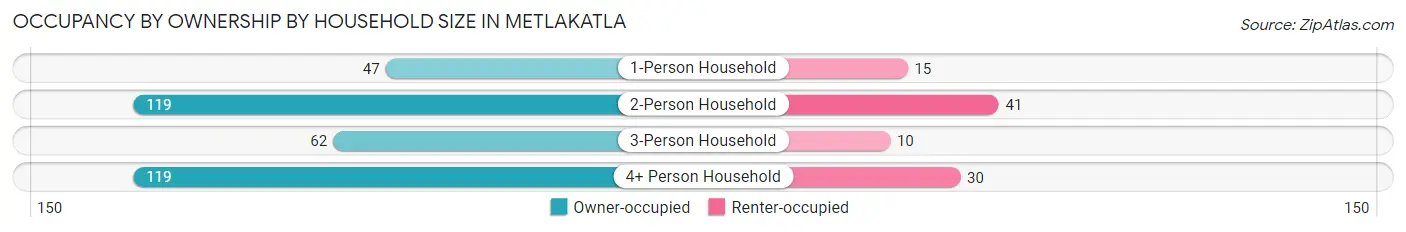
| Household Size | Owner-occupied | Renter-occupied |
| 1-Person Household | 47 (75.8%) | 15 (24.2%) |
| 2-Person Household | 119 (74.4%) | 41 (25.6%) |
| 3-Person Household | 62 (86.1%) | 10 (13.9%) |
| 4+ Person Household | 119 (79.9%) | 30 (20.1%) |
| Total Housing Units | 347 (78.3%) | 96 (21.7%) |
Occupancy by Educational Attainment in Metlakatla
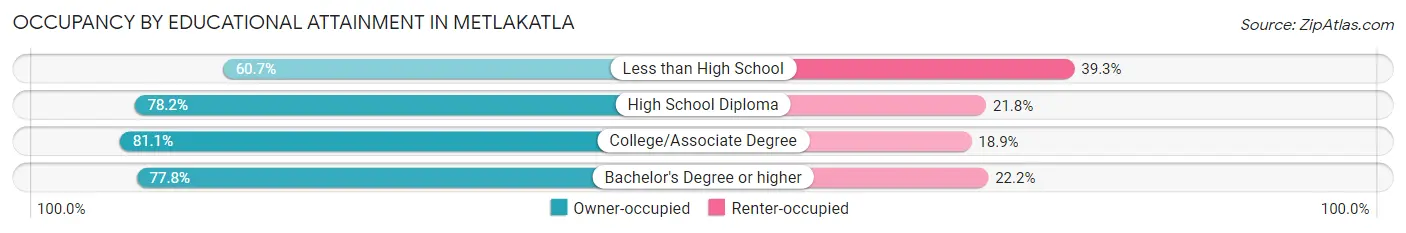
| Household Size | Owner-occupied | Renter-occupied |
| Less than High School | 17 (60.7%) | 11 (39.3%) |
| High School Diploma | 122 (78.2%) | 34 (21.8%) |
| College/Associate Degree | 159 (81.1%) | 37 (18.9%) |
| Bachelor's Degree or higher | 49 (77.8%) | 14 (22.2%) |
Occupancy by Age of Householder in Metlakatla
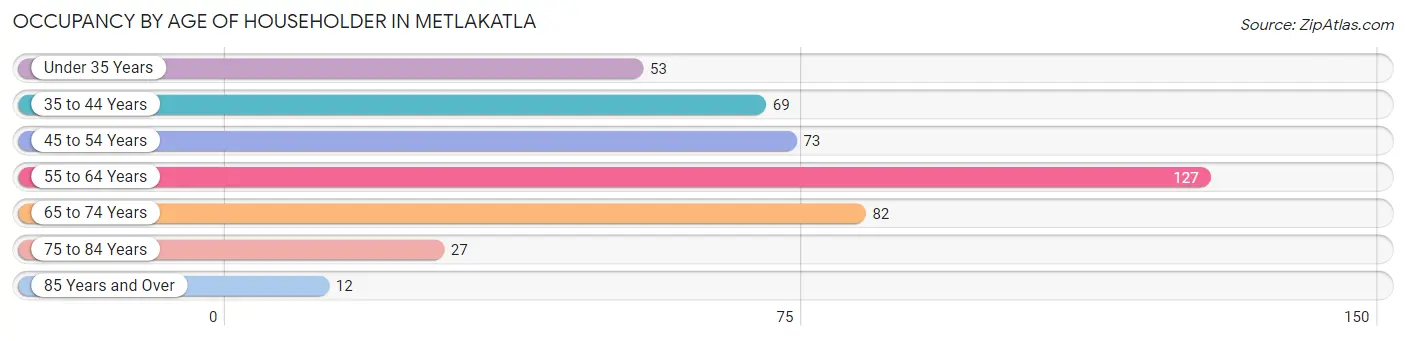
| Age Bracket | # Households | % Households |
| Under 35 Years | 53 | 12.0% |
| 35 to 44 Years | 69 | 15.6% |
| 45 to 54 Years | 73 | 16.5% |
| 55 to 64 Years | 127 | 28.7% |
| 65 to 74 Years | 82 | 18.5% |
| 75 to 84 Years | 27 | 6.1% |
| 85 Years and Over | 12 | 2.7% |
| Total | 443 | 100.0% |
Housing Finances in Metlakatla
Median Income by Occupancy in Metlakatla
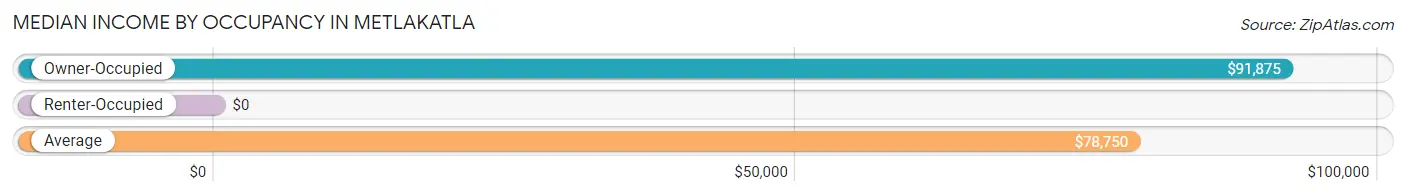
| Occupancy Type | # Households | Median Income |
| Owner-Occupied | 347 (78.3%) | $91,875 |
| Renter-Occupied | 96 (21.7%) | $0 |
| Average | 443 (100.0%) | $78,750 |
Occupancy by Householder Income Bracket in Metlakatla
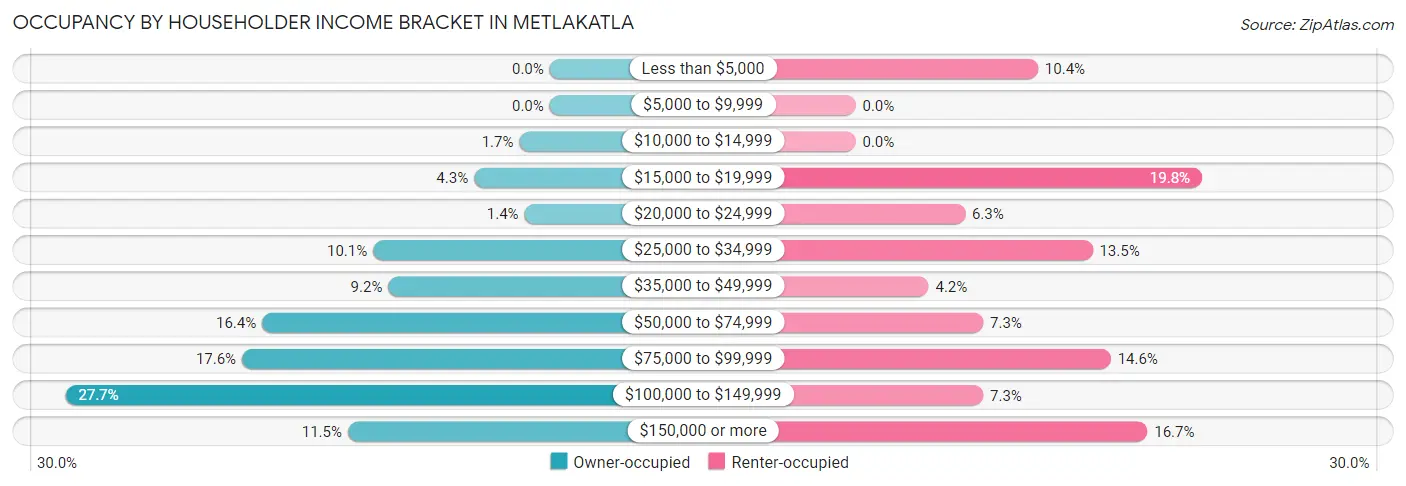
| Income Bracket | Owner-occupied | Renter-occupied |
| Less than $5,000 | 0 (0.0%) | 10 (10.4%) |
| $5,000 to $9,999 | 0 (0.0%) | 0 (0.0%) |
| $10,000 to $14,999 | 6 (1.7%) | 0 (0.0%) |
| $15,000 to $19,999 | 15 (4.3%) | 19 (19.8%) |
| $20,000 to $24,999 | 5 (1.4%) | 6 (6.2%) |
| $25,000 to $34,999 | 35 (10.1%) | 13 (13.5%) |
| $35,000 to $49,999 | 32 (9.2%) | 4 (4.2%) |
| $50,000 to $74,999 | 57 (16.4%) | 7 (7.3%) |
| $75,000 to $99,999 | 61 (17.6%) | 14 (14.6%) |
| $100,000 to $149,999 | 96 (27.7%) | 7 (7.3%) |
| $150,000 or more | 40 (11.5%) | 16 (16.7%) |
| Total | 347 (100.0%) | 96 (100.0%) |
Monthly Housing Cost Tiers in Metlakatla
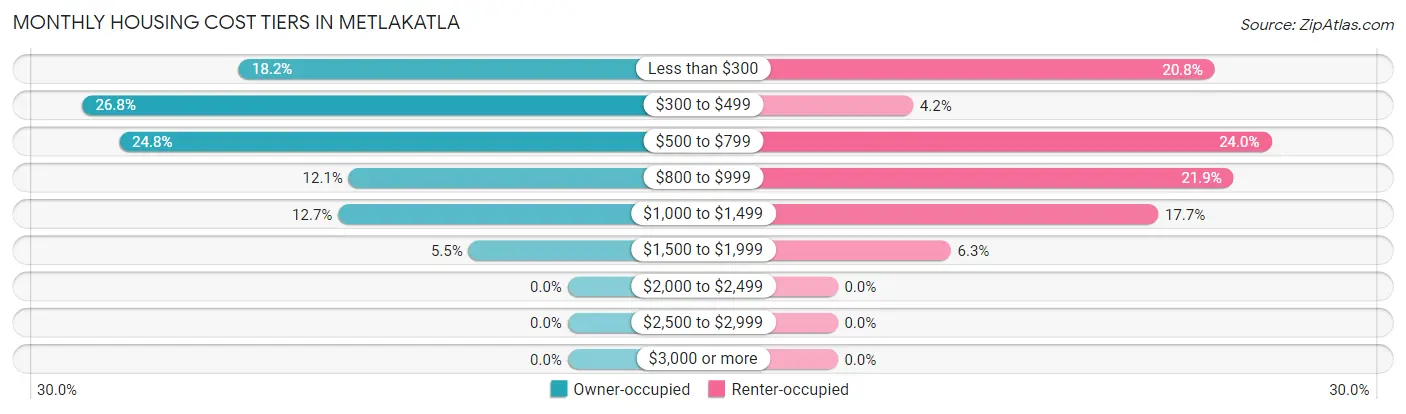
| Monthly Cost | Owner-occupied | Renter-occupied |
| Less than $300 | 63 (18.2%) | 20 (20.8%) |
| $300 to $499 | 93 (26.8%) | 4 (4.2%) |
| $500 to $799 | 86 (24.8%) | 23 (24.0%) |
| $800 to $999 | 42 (12.1%) | 21 (21.9%) |
| $1,000 to $1,499 | 44 (12.7%) | 17 (17.7%) |
| $1,500 to $1,999 | 19 (5.5%) | 6 (6.2%) |
| $2,000 to $2,499 | 0 (0.0%) | 0 (0.0%) |
| $2,500 to $2,999 | 0 (0.0%) | 0 (0.0%) |
| $3,000 or more | 0 (0.0%) | 0 (0.0%) |
| Total | 347 (100.0%) | 96 (100.0%) |
Physical Housing Characteristics in Metlakatla
Housing Structures in Metlakatla
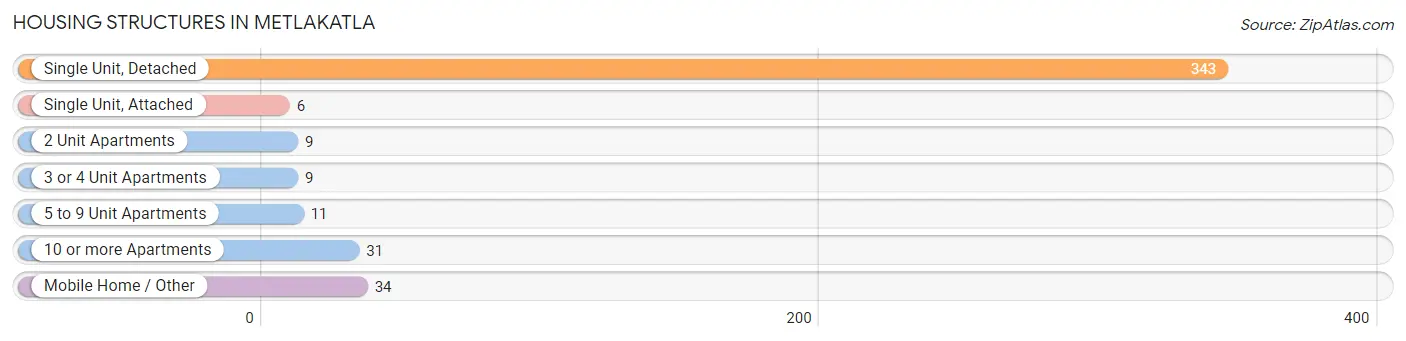
| Structure Type | # Housing Units | % Housing Units |
| Single Unit, Detached | 343 | 77.4% |
| Single Unit, Attached | 6 | 1.3% |
| 2 Unit Apartments | 9 | 2.0% |
| 3 or 4 Unit Apartments | 9 | 2.0% |
| 5 to 9 Unit Apartments | 11 | 2.5% |
| 10 or more Apartments | 31 | 7.0% |
| Mobile Home / Other | 34 | 7.7% |
| Total | 443 | 100.0% |
Housing Structures by Occupancy in Metlakatla
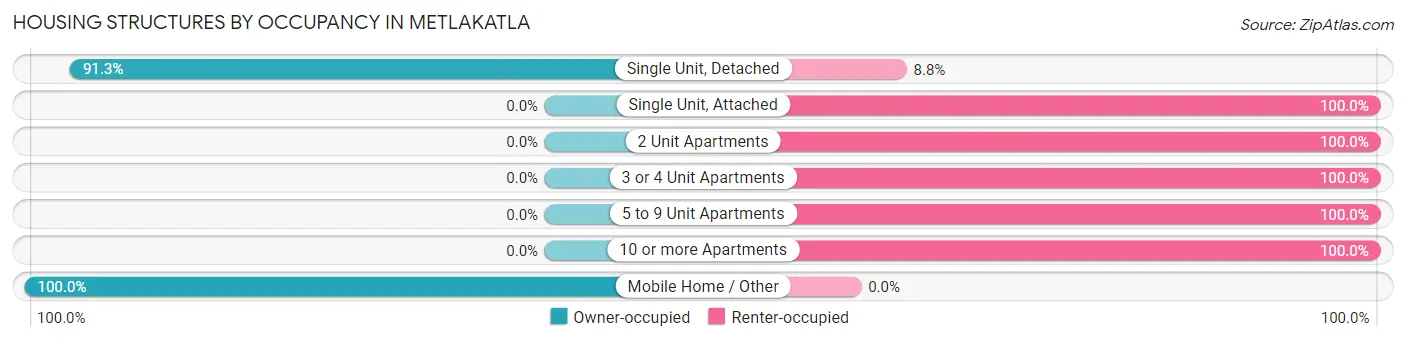
| Structure Type | Owner-occupied | Renter-occupied |
| Single Unit, Detached | 313 (91.2%) | 30 (8.7%) |
| Single Unit, Attached | 0 (0.0%) | 6 (100.0%) |
| 2 Unit Apartments | 0 (0.0%) | 9 (100.0%) |
| 3 or 4 Unit Apartments | 0 (0.0%) | 9 (100.0%) |
| 5 to 9 Unit Apartments | 0 (0.0%) | 11 (100.0%) |
| 10 or more Apartments | 0 (0.0%) | 31 (100.0%) |
| Mobile Home / Other | 34 (100.0%) | 0 (0.0%) |
| Total | 347 (78.3%) | 96 (21.7%) |
Housing Structures by Number of Rooms in Metlakatla
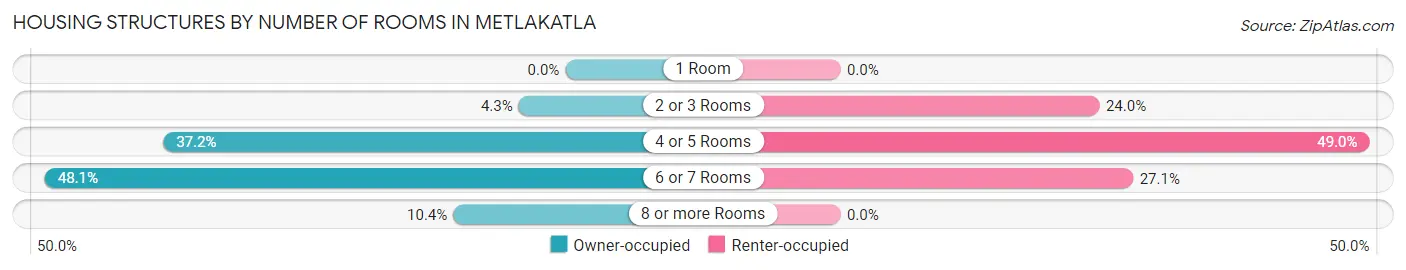
| Number of Rooms | Owner-occupied | Renter-occupied |
| 1 Room | 0 (0.0%) | 0 (0.0%) |
| 2 or 3 Rooms | 15 (4.3%) | 23 (24.0%) |
| 4 or 5 Rooms | 129 (37.2%) | 47 (49.0%) |
| 6 or 7 Rooms | 167 (48.1%) | 26 (27.1%) |
| 8 or more Rooms | 36 (10.4%) | 0 (0.0%) |
| Total | 347 (100.0%) | 96 (100.0%) |
Housing Structure by Heating Type in Metlakatla
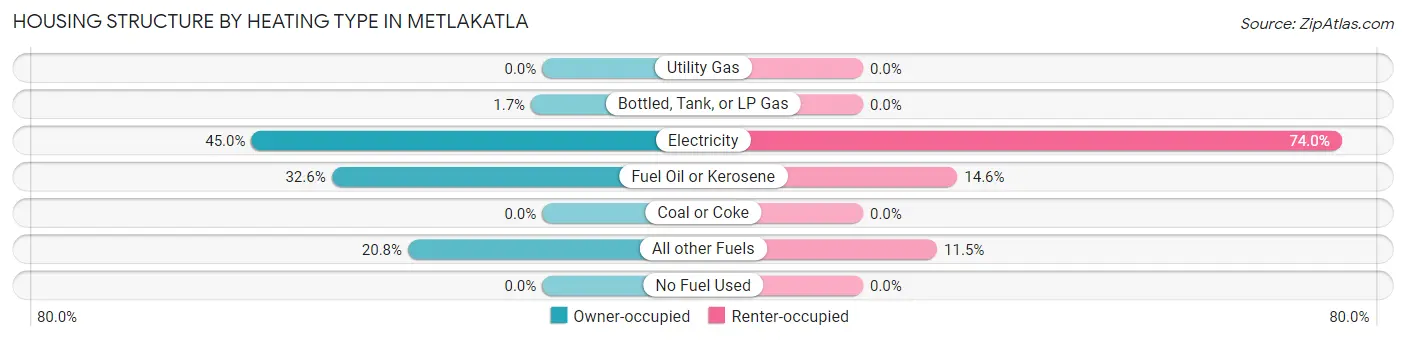
| Heating Type | Owner-occupied | Renter-occupied |
| Utility Gas | 0 (0.0%) | 0 (0.0%) |
| Bottled, Tank, or LP Gas | 6 (1.7%) | 0 (0.0%) |
| Electricity | 156 (45.0%) | 71 (74.0%) |
| Fuel Oil or Kerosene | 113 (32.6%) | 14 (14.6%) |
| Coal or Coke | 0 (0.0%) | 0 (0.0%) |
| All other Fuels | 72 (20.7%) | 11 (11.5%) |
| No Fuel Used | 0 (0.0%) | 0 (0.0%) |
| Total | 347 (100.0%) | 96 (100.0%) |
Household Vehicle Usage in Metlakatla
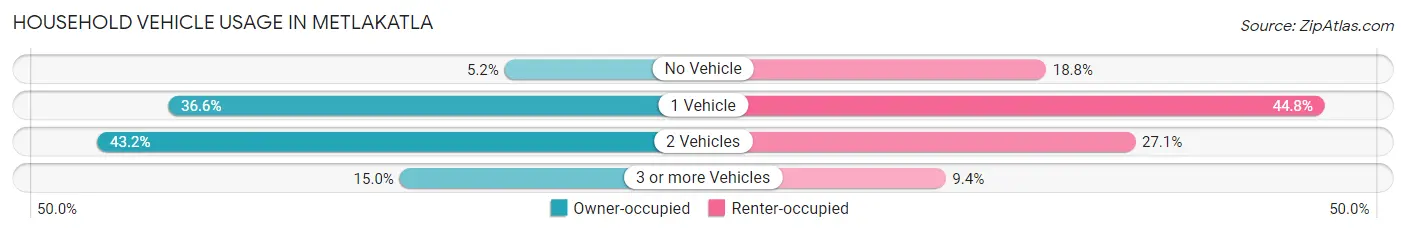
| Vehicles per Household | Owner-occupied | Renter-occupied |
| No Vehicle | 18 (5.2%) | 18 (18.8%) |
| 1 Vehicle | 127 (36.6%) | 43 (44.8%) |
| 2 Vehicles | 150 (43.2%) | 26 (27.1%) |
| 3 or more Vehicles | 52 (15.0%) | 9 (9.4%) |
| Total | 347 (100.0%) | 96 (100.0%) |
Real Estate & Mortgages in Metlakatla
Real Estate and Mortgage Overview in Metlakatla
| Characteristic | Without Mortgage | With Mortgage |
| Housing Units | 240 | 107 |
| Median Property Value | $156,700 | $167,700 |
| Median Household Income | $75,833 | $0 |
| Monthly Housing Costs | $390 | $0 |
| Real Estate Taxes | $199 | $86 |
Property Value by Mortgage Status in Metlakatla
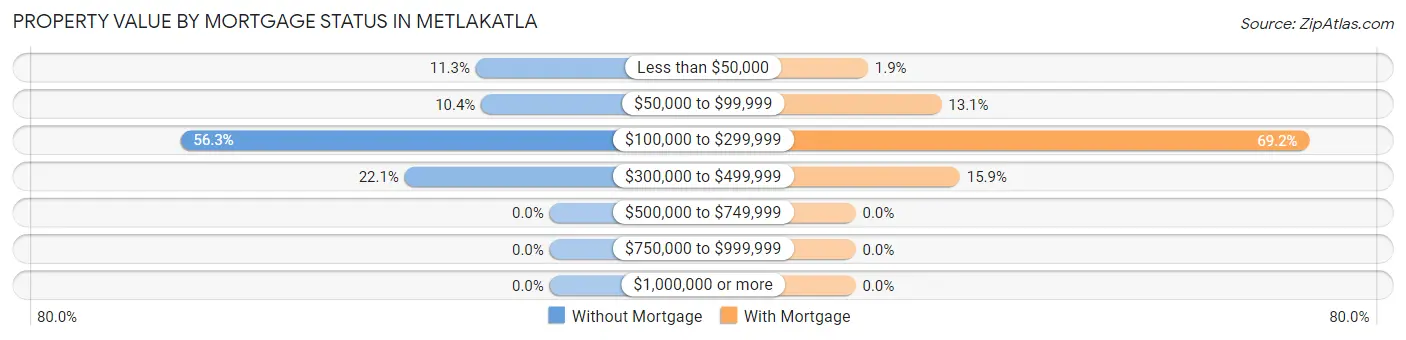
| Property Value | Without Mortgage | With Mortgage |
| Less than $50,000 | 27 (11.3%) | 2 (1.9%) |
| $50,000 to $99,999 | 25 (10.4%) | 14 (13.1%) |
| $100,000 to $299,999 | 135 (56.2%) | 74 (69.2%) |
| $300,000 to $499,999 | 53 (22.1%) | 17 (15.9%) |
| $500,000 to $749,999 | 0 (0.0%) | 0 (0.0%) |
| $750,000 to $999,999 | 0 (0.0%) | 0 (0.0%) |
| $1,000,000 or more | 0 (0.0%) | 0 (0.0%) |
| Total | 240 (100.0%) | 107 (100.0%) |
Household Income by Mortgage Status in Metlakatla
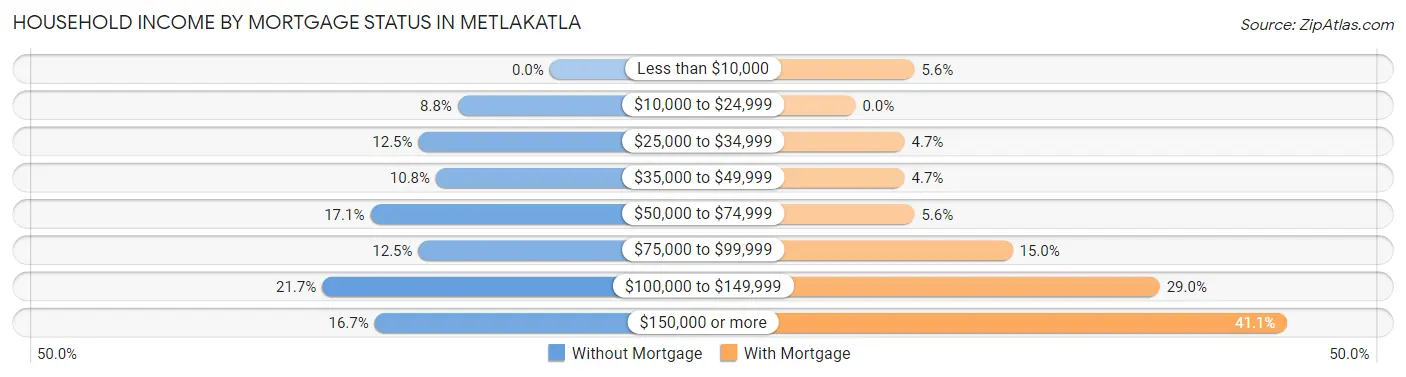
| Household Income | Without Mortgage | With Mortgage |
| Less than $10,000 | 0 (0.0%) | 6 (5.6%) |
| $10,000 to $24,999 | 21 (8.7%) | 0 (0.0%) |
| $25,000 to $34,999 | 30 (12.5%) | 5 (4.7%) |
| $35,000 to $49,999 | 26 (10.8%) | 5 (4.7%) |
| $50,000 to $74,999 | 41 (17.1%) | 6 (5.6%) |
| $75,000 to $99,999 | 30 (12.5%) | 16 (14.9%) |
| $100,000 to $149,999 | 52 (21.7%) | 31 (29.0%) |
| $150,000 or more | 40 (16.7%) | 44 (41.1%) |
| Total | 240 (100.0%) | 107 (100.0%) |
Property Value to Household Income Ratio in Metlakatla
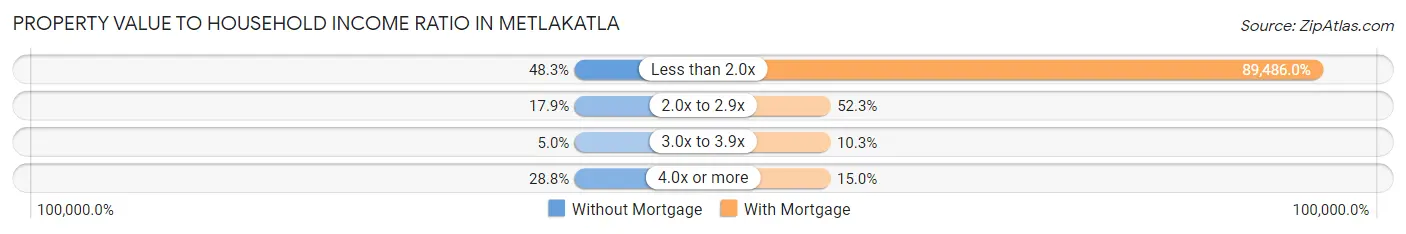
| Value-to-Income Ratio | Without Mortgage | With Mortgage |
| Less than 2.0x | 116 (48.3%) | 95,750 (89,486.0%) |
| 2.0x to 2.9x | 43 (17.9%) | 56 (52.3%) |
| 3.0x to 3.9x | 12 (5.0%) | 11 (10.3%) |
| 4.0x or more | 69 (28.7%) | 16 (14.9%) |
| Total | 240 (100.0%) | 107 (100.0%) |
Real Estate Taxes by Mortgage Status in Metlakatla
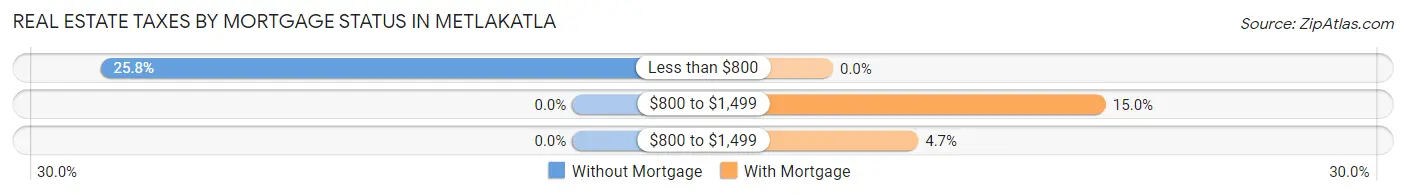
| Property Taxes | Without Mortgage | With Mortgage |
| Less than $800 | 62 (25.8%) | 0 (0.0%) |
| $800 to $1,499 | 0 (0.0%) | 16 (14.9%) |
| $800 to $1,499 | 0 (0.0%) | 5 (4.7%) |
| Total | 240 (100.0%) | 107 (100.0%) |
Health & Disability in Metlakatla
Health Insurance Coverage by Age in Metlakatla
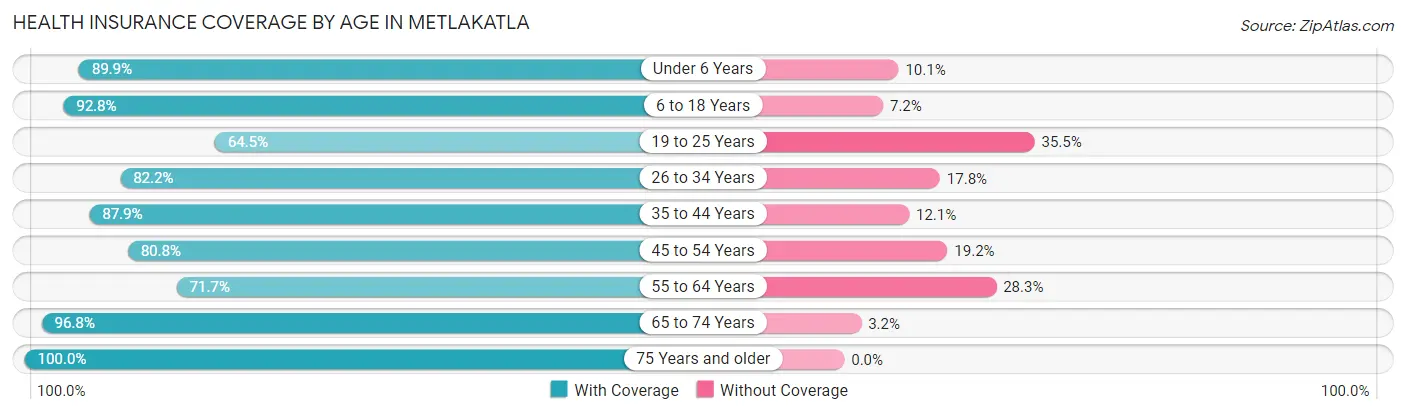
| Age Bracket | With Coverage | Without Coverage |
| Under 6 Years | 80 (89.9%) | 9 (10.1%) |
| 6 to 18 Years | 257 (92.8%) | 20 (7.2%) |
| 19 to 25 Years | 80 (64.5%) | 44 (35.5%) |
| 26 to 34 Years | 129 (82.2%) | 28 (17.8%) |
| 35 to 44 Years | 153 (87.9%) | 21 (12.1%) |
| 45 to 54 Years | 126 (80.8%) | 30 (19.2%) |
| 55 to 64 Years | 167 (71.7%) | 66 (28.3%) |
| 65 to 74 Years | 153 (96.8%) | 5 (3.2%) |
| 75 Years and older | 68 (100.0%) | 0 (0.0%) |
| Total | 1,213 (84.5%) | 223 (15.5%) |
Health Insurance Coverage by Citizenship Status in Metlakatla
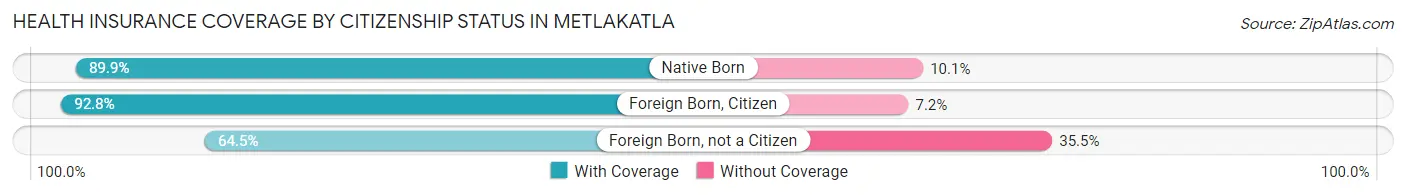
| Citizenship Status | With Coverage | Without Coverage |
| Native Born | 80 (89.9%) | 9 (10.1%) |
| Foreign Born, Citizen | 257 (92.8%) | 20 (7.2%) |
| Foreign Born, not a Citizen | 80 (64.5%) | 44 (35.5%) |
Health Insurance Coverage by Household Income in Metlakatla
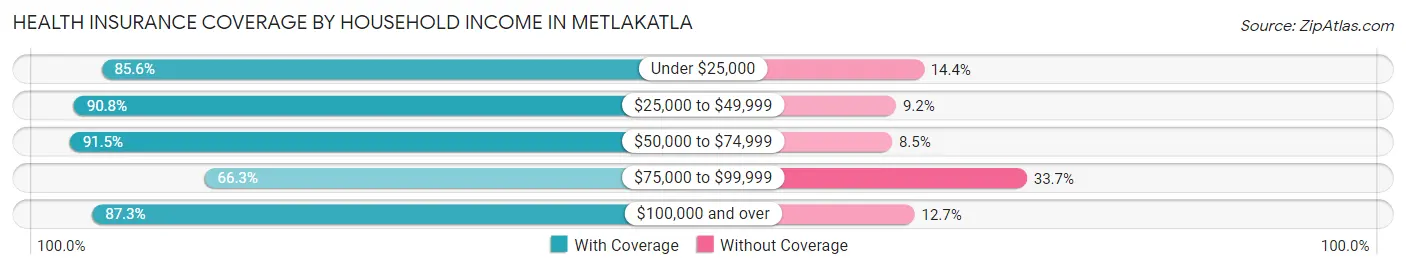
| Household Income | With Coverage | Without Coverage |
| Under $25,000 | 101 (85.6%) | 17 (14.4%) |
| $25,000 to $49,999 | 187 (90.8%) | 19 (9.2%) |
| $50,000 to $74,999 | 249 (91.5%) | 23 (8.5%) |
| $75,000 to $99,999 | 167 (66.3%) | 85 (33.7%) |
| $100,000 and over | 509 (87.3%) | 74 (12.7%) |
Public vs Private Health Insurance Coverage by Age in Metlakatla
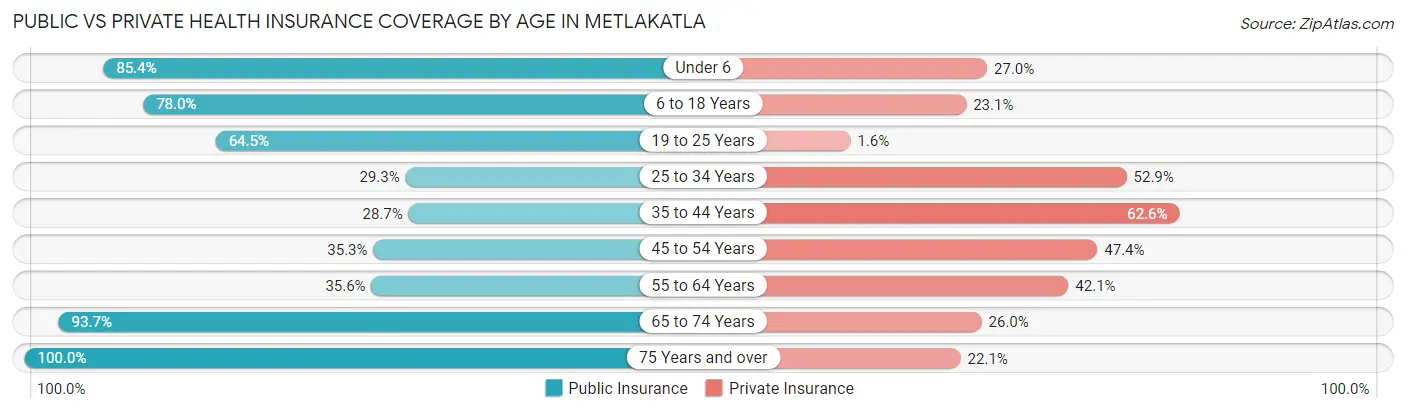
| Age Bracket | Public Insurance | Private Insurance |
| Under 6 | 76 (85.4%) | 24 (27.0%) |
| 6 to 18 Years | 216 (78.0%) | 64 (23.1%) |
| 19 to 25 Years | 80 (64.5%) | 2 (1.6%) |
| 25 to 34 Years | 46 (29.3%) | 83 (52.9%) |
| 35 to 44 Years | 50 (28.7%) | 109 (62.6%) |
| 45 to 54 Years | 55 (35.3%) | 74 (47.4%) |
| 55 to 64 Years | 83 (35.6%) | 98 (42.1%) |
| 65 to 74 Years | 148 (93.7%) | 41 (26.0%) |
| 75 Years and over | 68 (100.0%) | 15 (22.1%) |
| Total | 822 (57.2%) | 510 (35.5%) |
Disability Status by Sex by Age in Metlakatla
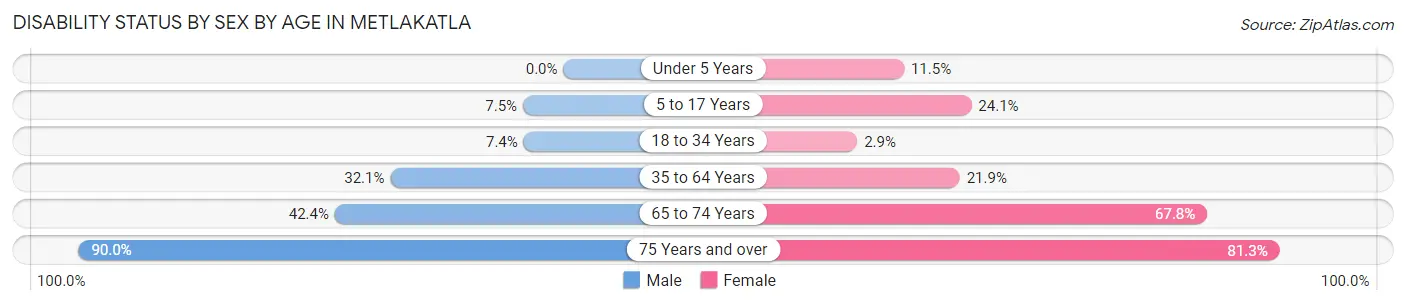
| Age Bracket | Male | Female |
| Under 5 Years | 0 (0.0%) | 3 (11.5%) |
| 5 to 17 Years | 12 (7.5%) | 32 (24.1%) |
| 18 to 34 Years | 11 (7.4%) | 4 (2.9%) |
| 35 to 64 Years | 106 (32.1%) | 51 (21.9%) |
| 65 to 74 Years | 42 (42.4%) | 40 (67.8%) |
| 75 Years and over | 18 (90.0%) | 39 (81.2%) |
Disability Class by Sex by Age in Metlakatla
Disability Class: Hearing Difficulty
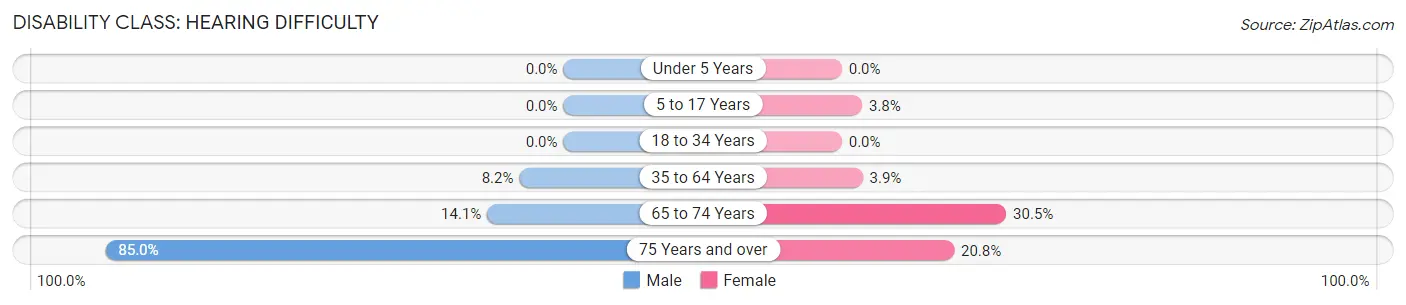
| Age Bracket | Male | Female |
| Under 5 Years | 0 (0.0%) | 0 (0.0%) |
| 5 to 17 Years | 0 (0.0%) | 5 (3.8%) |
| 18 to 34 Years | 0 (0.0%) | 0 (0.0%) |
| 35 to 64 Years | 27 (8.2%) | 9 (3.9%) |
| 65 to 74 Years | 14 (14.1%) | 18 (30.5%) |
| 75 Years and over | 17 (85.0%) | 10 (20.8%) |
Disability Class: Vision Difficulty
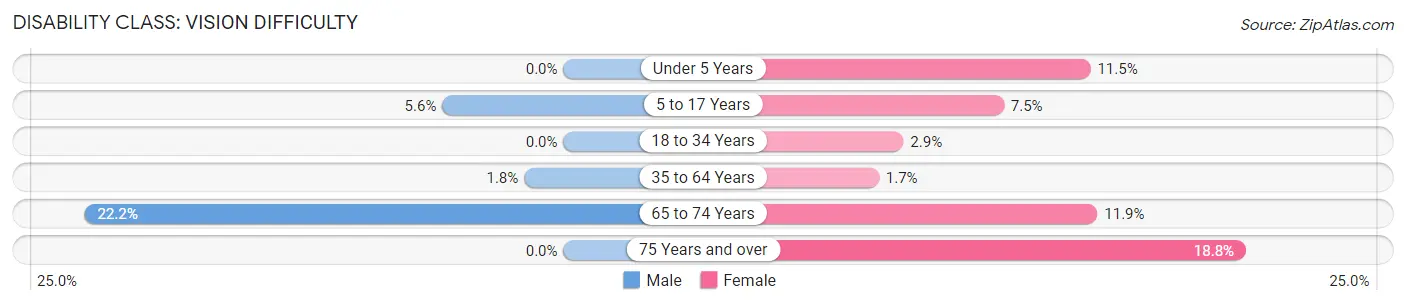
| Age Bracket | Male | Female |
| Under 5 Years | 0 (0.0%) | 3 (11.5%) |
| 5 to 17 Years | 9 (5.6%) | 10 (7.5%) |
| 18 to 34 Years | 0 (0.0%) | 4 (2.9%) |
| 35 to 64 Years | 6 (1.8%) | 4 (1.7%) |
| 65 to 74 Years | 22 (22.2%) | 7 (11.9%) |
| 75 Years and over | 0 (0.0%) | 9 (18.8%) |
Disability Class: Cognitive Difficulty
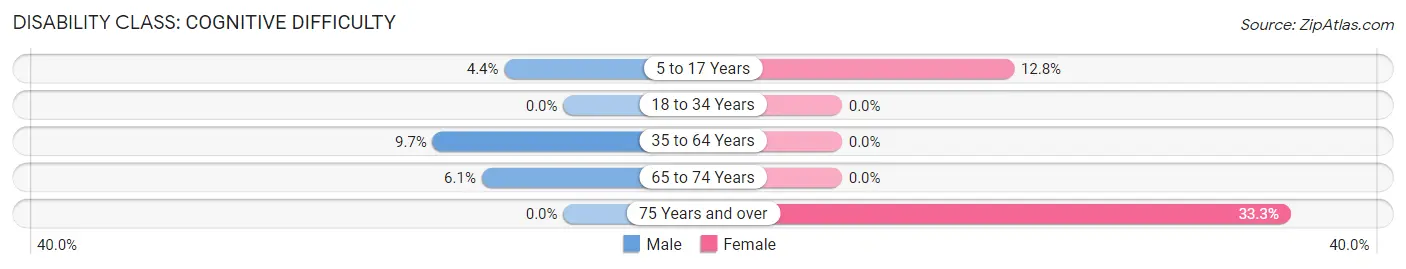
| Age Bracket | Male | Female |
| 5 to 17 Years | 7 (4.4%) | 17 (12.8%) |
| 18 to 34 Years | 0 (0.0%) | 0 (0.0%) |
| 35 to 64 Years | 32 (9.7%) | 0 (0.0%) |
| 65 to 74 Years | 6 (6.1%) | 0 (0.0%) |
| 75 Years and over | 0 (0.0%) | 16 (33.3%) |
Disability Class: Ambulatory Difficulty
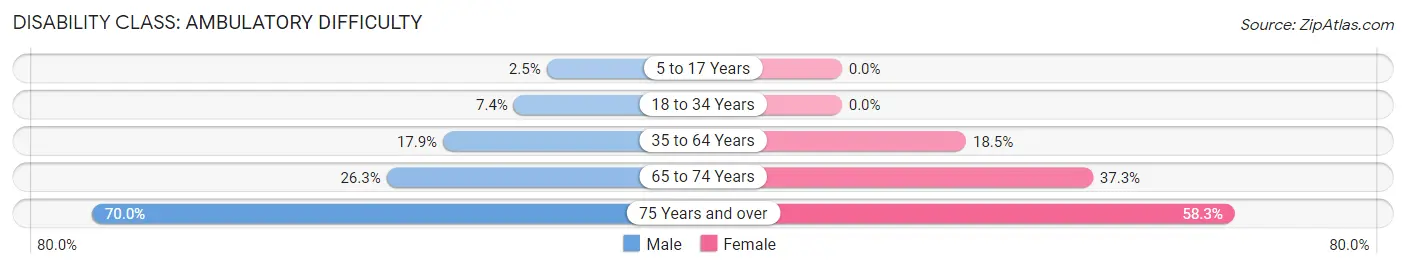
| Age Bracket | Male | Female |
| 5 to 17 Years | 4 (2.5%) | 0 (0.0%) |
| 18 to 34 Years | 11 (7.4%) | 0 (0.0%) |
| 35 to 64 Years | 59 (17.9%) | 43 (18.4%) |
| 65 to 74 Years | 26 (26.3%) | 22 (37.3%) |
| 75 Years and over | 14 (70.0%) | 28 (58.3%) |
Disability Class: Self-Care Difficulty
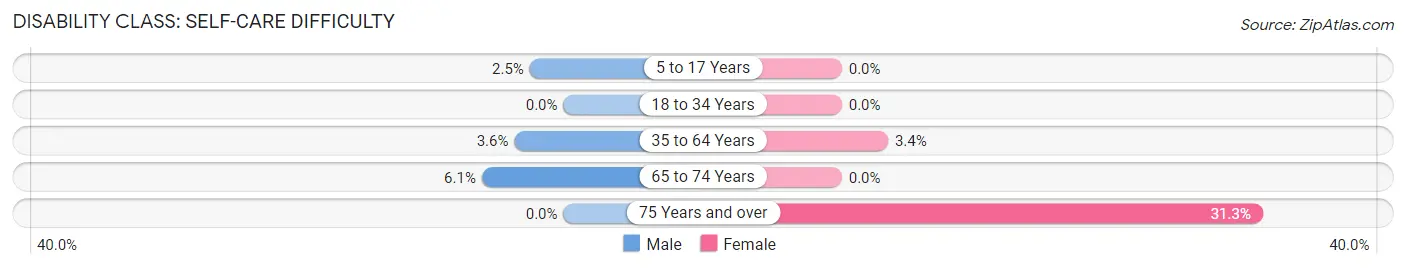
| Age Bracket | Male | Female |
| 5 to 17 Years | 4 (2.5%) | 0 (0.0%) |
| 18 to 34 Years | 0 (0.0%) | 0 (0.0%) |
| 35 to 64 Years | 12 (3.6%) | 8 (3.4%) |
| 65 to 74 Years | 6 (6.1%) | 0 (0.0%) |
| 75 Years and over | 0 (0.0%) | 15 (31.2%) |
Technology Access in Metlakatla
Computing Device Access in Metlakatla
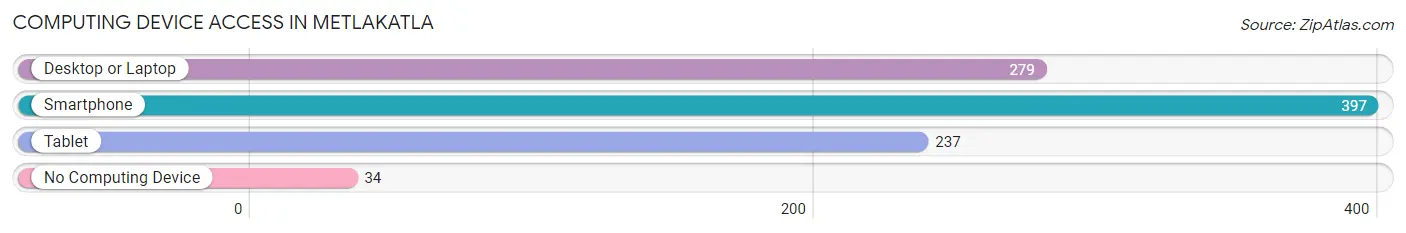
| Device Type | # Households | % Households |
| Desktop or Laptop | 279 | 63.0% |
| Smartphone | 397 | 89.6% |
| Tablet | 237 | 53.5% |
| No Computing Device | 34 | 7.7% |
| Total | 443 | 100.0% |
Internet Access in Metlakatla
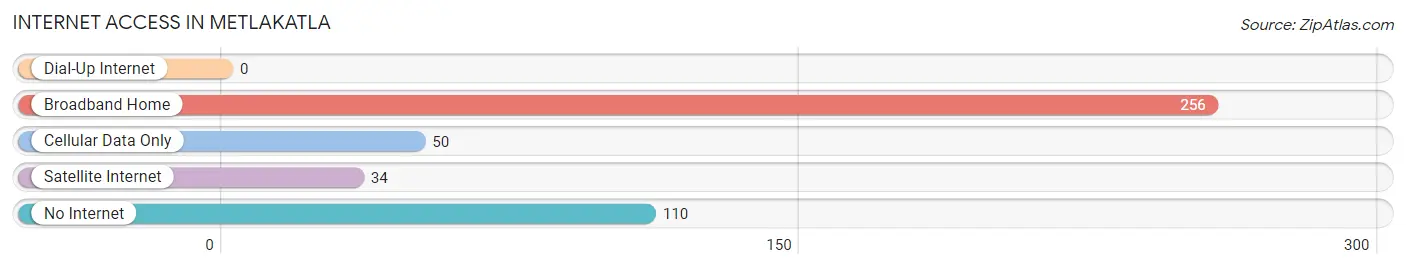
| Internet Type | # Households | % Households |
| Dial-Up Internet | 0 | 0.0% |
| Broadband Home | 256 | 57.8% |
| Cellular Data Only | 50 | 11.3% |
| Satellite Internet | 34 | 7.7% |
| No Internet | 110 | 24.8% |
| Total | 443 | 100.0% |
Metlakatla Summary
Metlakatla, Alaska is a small city located on Annette Island in the Prince of Wales-Outer Ketchikan Census Area of the state of Alaska. It is the only remaining Indian reservation in Alaska and is home to the Tsimshian people. The city was founded in 1887 by William Duncan, a missionary from England, and is the oldest continuously inhabited community in Alaska.
Geography
Metlakatla is located on Annette Island, which is the southernmost island in the Alexander Archipelago of Southeast Alaska. The island is approximately 12 miles long and 6 miles wide, with a total area of about 40 square miles. The island is surrounded by the Pacific Ocean to the south and the Inside Passage to the north. The island is mostly forested, with a few small lakes and streams. The climate is mild and humid, with temperatures ranging from the mid-30s in the winter to the mid-60s in the summer.
Economy
Metlakatla’s economy is largely based on fishing and tourism. The city is home to a large commercial fishing fleet, and the seafood industry is a major source of employment and income for the city. The city also has a small tourism industry, with visitors coming to the island to experience the unique culture and natural beauty of the area.
Demographics
As of the 2010 census, the population of Metlakatla was 1,405. The racial makeup of the city was 95.3% Native American, 2.2% White, 0.3% Asian, 0.2% Black or African American, 0.1% Pacific Islander, and 1.9% from two or more races. The median age was 33.7 years, and the median household income was $37,917.
History
Metlakatla was founded in 1887 by William Duncan, a missionary from England. Duncan was sent to the area by the Church of England to convert the Tsimshian people to Christianity. He established a mission on Annette Island and the settlement of Metlakatla was born. The settlement was originally a closed community, with no contact with the outside world. In 1891, the US government recognized Metlakatla as an Indian reservation, and the Tsimshian people were granted the right to self-governance.
In the early 20th century, Metlakatla experienced a period of economic growth and prosperity. The city was home to a thriving fishing industry, and the population grew to over 1,000 people. In the 1950s, the city began to decline as the fishing industry declined and the population began to move away. In the 1970s, the city was revitalized with the construction of a new cannery and the establishment of a tribal government.
Today, Metlakatla is a vibrant and thriving community. The city is home to a variety of businesses, including a seafood processing plant, a sawmill, and a fish hatchery. The city is also home to a number of cultural and recreational attractions, including a museum, a cultural center, and a marina. The city is also home to a number of schools, including a tribal college and a high school.
Common Questions
What is Per Capita Income in Metlakatla?
Per Capita income in Metlakatla is $29,379.
What is the Median Family Income in Metlakatla?
Median Family Income in Metlakatla is $95,556.
What is the Median Household income in Metlakatla?
Median Household Income in Metlakatla is $78,750.
What is Income or Wage Gap in Metlakatla?
Income or Wage Gap in Metlakatla is 14.9%.
Women in Metlakatla earn 85.1 cents for every dollar earned by a man.
What is Inequality or Gini Index in Metlakatla?
Inequality or Gini Index in Metlakatla is 0.37.
What is the Total Population of Metlakatla?
Total Population of Metlakatla is 1,437.
What is the Total Male Population of Metlakatla?
Total Male Population of Metlakatla is 798.
What is the Total Female Population of Metlakatla?
Total Female Population of Metlakatla is 639.
What is the Ratio of Males per 100 Females in Metlakatla?
There are 124.88 Males per 100 Females in Metlakatla.
What is the Ratio of Females per 100 Males in Metlakatla?
There are 80.08 Females per 100 Males in Metlakatla.
What is the Median Population Age in Metlakatla?
Median Population Age in Metlakatla is 38.6 Years.
What is the Average Family Size in Metlakatla
Average Family Size in Metlakatla is 3.5 People.
What is the Average Household Size in Metlakatla
Average Household Size in Metlakatla is 3.2 People.
How Large is the Labor Force in Metlakatla?
There are 684 People in the Labor Forcein in Metlakatla.
What is the Percentage of People in the Labor Force in Metlakatla?
60.7% of People are in the Labor Force in Metlakatla.
What is the Unemployment Rate in Metlakatla?
Unemployment Rate in Metlakatla is 12.0%.