Cities with the Highest Percentage of Population Employed in Administrative & Support Services in Hawaii
RELATED REPORTS & OPTIONS
Administrative & Support Services
Hawaii
Compare Cities
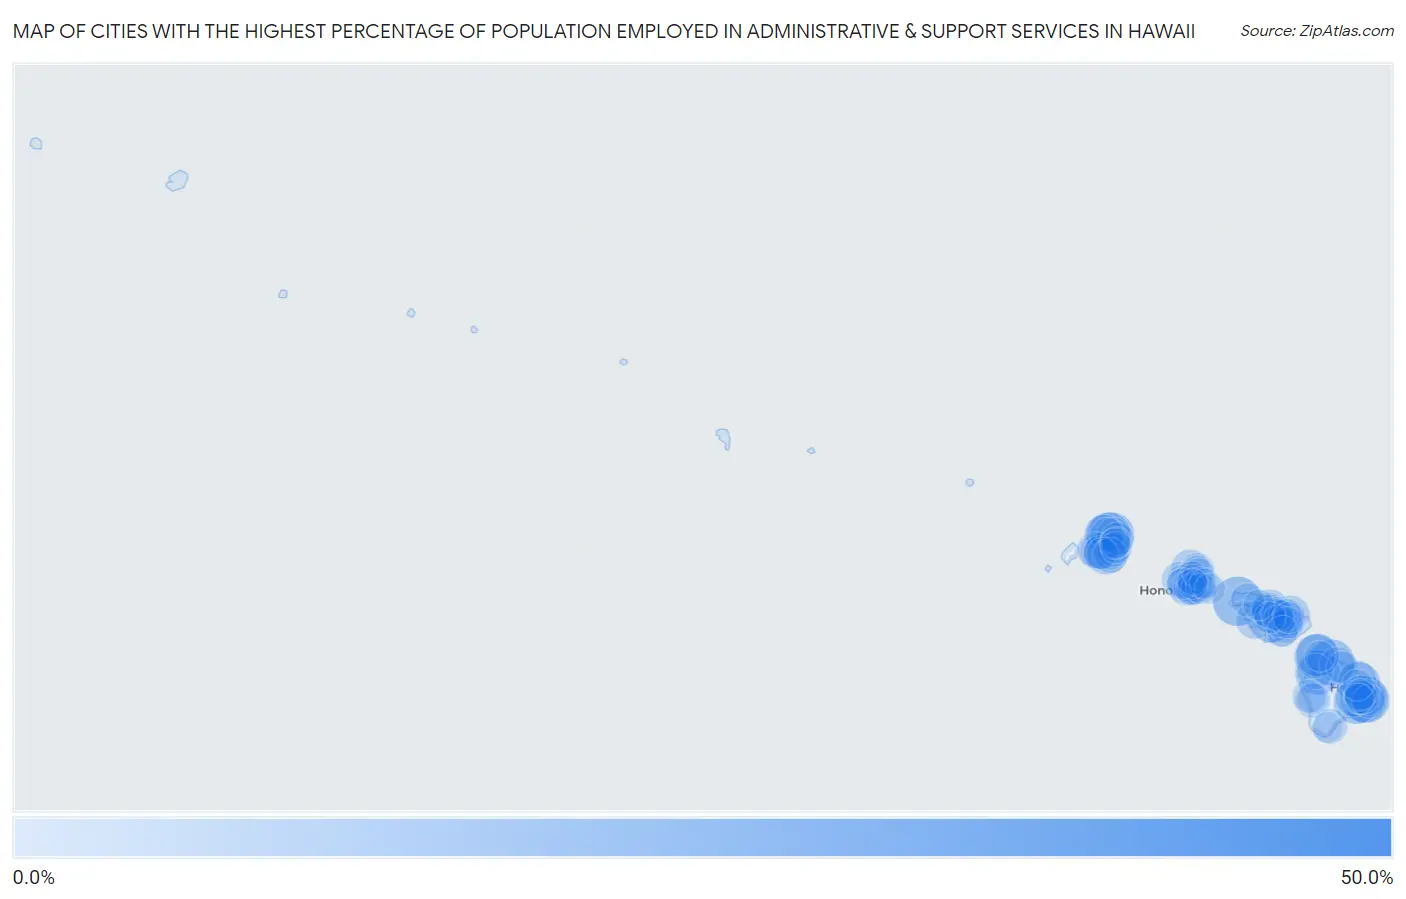
Map of Cities with the Highest Percentage of Population Employed in Administrative & Support Services in Hawaii
0.0%
50.0%
Cities with the Highest Percentage of Population Employed in Administrative & Support Services in Hawaii
| City | % Employed | vs State | vs National | |
| 1. | Kamaili | 45.0% | 4.7%(+40.3)#1 | 4.1%(+40.9)#77 |
| 2. | Maunaloa | 19.4% | 4.7%(+14.6)#2 | 4.1%(+15.2)#469 |
| 3. | Ainaloa | 17.4% | 4.7%(+12.7)#3 | 4.1%(+13.3)#580 |
| 4. | Kukuihaele | 16.9% | 4.7%(+12.2)#4 | 4.1%(+12.8)#617 |
| 5. | Pahoa | 16.7% | 4.7%(+11.9)#5 | 4.1%(+12.5)#628 |
| 6. | Kalihiwai | 16.7% | 4.7%(+11.9)#6 | 4.1%(+12.5)#631 |
| 7. | Fern Forest | 16.1% | 4.7%(+11.3)#7 | 4.1%(+11.9)#679 |
| 8. | Princeville | 15.7% | 4.7%(+11.0)#8 | 4.1%(+11.6)#709 |
| 9. | Olowalu | 15.7% | 4.7%(+10.9)#9 | 4.1%(+11.5)#712 |
| 10. | Waikoloa Village | 15.6% | 4.7%(+10.8)#10 | 4.1%(+11.4)#723 |
| 11. | Hawi | 14.7% | 4.7%(+9.94)#11 | 4.1%(+10.5)#839 |
| 12. | Kalaheo | 14.6% | 4.7%(+9.89)#12 | 4.1%(+10.5)#843 |
| 13. | Paukaa | 14.2% | 4.7%(+9.48)#13 | 4.1%(+10.1)#912 |
| 14. | Kapaau | 14.0% | 4.7%(+9.28)#14 | 4.1%(+9.88)#940 |
| 15. | Royal Hawaiian Estates | 11.2% | 4.7%(+6.49)#15 | 4.1%(+7.08)#1,484 |
| 16. | Haiku Pauwela | 11.2% | 4.7%(+6.42)#16 | 4.1%(+7.02)#1,498 |
| 17. | Kapalua | 10.5% | 4.7%(+5.75)#17 | 4.1%(+6.35)#1,700 |
| 18. | Helemano | 10.5% | 4.7%(+5.72)#18 | 4.1%(+6.32)#1,711 |
| 19. | Haena | 10.3% | 4.7%(+5.56)#19 | 4.1%(+6.15)#1,782 |
| 20. | Pupukea | 10.2% | 4.7%(+5.44)#20 | 4.1%(+6.03)#1,821 |
| 21. | Lanai City | 10.2% | 4.7%(+5.43)#21 | 4.1%(+6.03)#1,824 |
| 22. | Pepeekeo | 10.2% | 4.7%(+5.43)#22 | 4.1%(+6.02)#1,828 |
| 23. | Hanapepe | 9.9% | 4.7%(+5.17)#23 | 4.1%(+5.76)#1,946 |
| 24. | Kailua Cdp Hawaii County | 9.3% | 4.7%(+4.59)#24 | 4.1%(+5.19)#2,191 |
| 25. | Pakala Village | 9.2% | 4.7%(+4.48)#25 | 4.1%(+5.08)#2,246 |
| 26. | Haliimaile | 9.1% | 4.7%(+4.34)#26 | 4.1%(+4.94)#2,310 |
| 27. | Makaha | 8.9% | 4.7%(+4.19)#27 | 4.1%(+4.79)#2,414 |
| 28. | Wailea | 8.6% | 4.7%(+3.88)#28 | 4.1%(+4.48)#2,600 |
| 29. | Mountain View | 8.4% | 4.7%(+3.68)#29 | 4.1%(+4.28)#2,717 |
| 30. | Kekaha | 8.4% | 4.7%(+3.68)#30 | 4.1%(+4.27)#2,719 |
| 31. | Honokaa | 8.4% | 4.7%(+3.63)#31 | 4.1%(+4.23)#2,745 |
| 32. | Hawaiian Beaches | 8.3% | 4.7%(+3.60)#32 | 4.1%(+4.20)#2,763 |
| 33. | Poipu | 8.3% | 4.7%(+3.54)#33 | 4.1%(+4.13)#2,817 |
| 34. | Captain Cook | 8.3% | 4.7%(+3.51)#34 | 4.1%(+4.11)#2,828 |
| 35. | Puako | 8.2% | 4.7%(+3.49)#35 | 4.1%(+4.09)#2,841 |
| 36. | Lahaina | 8.1% | 4.7%(+3.33)#36 | 4.1%(+3.92)#2,945 |
| 37. | Naalehu | 7.8% | 4.7%(+3.08)#37 | 4.1%(+3.68)#3,126 |
| 38. | Orchidlands Estates | 7.8% | 4.7%(+3.08)#38 | 4.1%(+3.67)#3,129 |
| 39. | Napili Honokowai | 7.7% | 4.7%(+3.00)#39 | 4.1%(+3.60)#3,188 |
| 40. | Waimea Cdp Kauai County | 7.7% | 4.7%(+2.98)#40 | 4.1%(+3.57)#3,202 |
| 41. | Volcano Golf Course | 7.7% | 4.7%(+2.91)#41 | 4.1%(+3.50)#3,267 |
| 42. | Kilauea | 7.3% | 4.7%(+2.60)#42 | 4.1%(+3.20)#3,545 |
| 43. | Hanalei | 7.2% | 4.7%(+2.48)#43 | 4.1%(+3.08)#3,658 |
| 44. | Kaiminani | 7.1% | 4.7%(+2.33)#44 | 4.1%(+2.93)#3,815 |
| 45. | Wahiawa | 7.1% | 4.7%(+2.33)#45 | 4.1%(+2.92)#3,822 |
| 46. | Nanakuli | 7.0% | 4.7%(+2.22)#46 | 4.1%(+2.82)#3,938 |
| 47. | Keaau | 6.9% | 4.7%(+2.13)#47 | 4.1%(+2.72)#4,016 |
| 48. | Laie | 6.9% | 4.7%(+2.13)#48 | 4.1%(+2.72)#4,019 |
| 49. | Keokea | 6.9% | 4.7%(+2.12)#49 | 4.1%(+2.71)#4,033 |
| 50. | Ko Olina | 6.8% | 4.7%(+2.03)#50 | 4.1%(+2.62)#4,124 |
| 51. | Mahinahina | 6.6% | 4.7%(+1.89)#51 | 4.1%(+2.49)#4,275 |
| 52. | Waihee Waiehu | 6.6% | 4.7%(+1.83)#52 | 4.1%(+2.42)#4,358 |
| 53. | Ewa Villages | 6.5% | 4.7%(+1.79)#53 | 4.1%(+2.39)#4,384 |
| 54. | Puhi | 6.5% | 4.7%(+1.77)#54 | 4.1%(+2.37)#4,423 |
| 55. | Kualapuu | 6.4% | 4.7%(+1.68)#55 | 4.1%(+2.28)#4,531 |
| 56. | Hawaiian Acres | 6.3% | 4.7%(+1.56)#56 | 4.1%(+2.16)#4,686 |
| 57. | Leilani Estates | 6.3% | 4.7%(+1.56)#57 | 4.1%(+2.16)#4,687 |
| 58. | Kahaluu Keauhou | 6.1% | 4.7%(+1.38)#58 | 4.1%(+1.98)#4,937 |
| 59. | Kaumakani | 6.1% | 4.7%(+1.34)#59 | 4.1%(+1.94)#4,998 |
| 60. | Waianae | 6.0% | 4.7%(+1.29)#60 | 4.1%(+1.89)#5,076 |
| 61. | Royal Kunia | 6.0% | 4.7%(+1.22)#61 | 4.1%(+1.82)#5,190 |
| 62. | Anahola | 5.8% | 4.7%(+1.09)#62 | 4.1%(+1.69)#5,395 |
| 63. | Paia | 5.7% | 4.7%(+0.977)#63 | 4.1%(+1.57)#5,583 |
| 64. | Paauilo | 5.7% | 4.7%(+0.945)#64 | 4.1%(+1.54)#5,640 |
| 65. | Waipahu | 5.6% | 4.7%(+0.887)#65 | 4.1%(+1.48)#5,742 |
| 66. | Kahului | 5.5% | 4.7%(+0.744)#66 | 4.1%(+1.34)#6,022 |
| 67. | Wailuku | 5.3% | 4.7%(+0.553)#67 | 4.1%(+1.15)#6,400 |
| 68. | Koloa | 5.3% | 4.7%(+0.517)#68 | 4.1%(+1.11)#6,454 |
| 69. | Eleele | 5.3% | 4.7%(+0.513)#69 | 4.1%(+1.11)#6,501 |
| 70. | Whitmore Village | 5.2% | 4.7%(+0.480)#70 | 4.1%(+1.08)#6,569 |
| 71. | Iroquois Point | 5.2% | 4.7%(+0.463)#71 | 4.1%(+1.06)#6,597 |
| 72. | Maalaea | 5.2% | 4.7%(+0.449)#72 | 4.1%(+1.04)#6,629 |
| 73. | Hanamaulu | 5.0% | 4.7%(+0.234)#73 | 4.1%(+0.831)#7,097 |
| 74. | Ewa Gentry | 4.9% | 4.7%(+0.181)#74 | 4.1%(+0.777)#7,221 |
| 75. | Makakilo | 4.9% | 4.7%(+0.161)#75 | 4.1%(+0.757)#7,262 |
| 76. | Kurtistown | 4.9% | 4.7%(+0.142)#76 | 4.1%(+0.739)#7,311 |
| 77. | Wainaku | 4.8% | 4.7%(+0.038)#77 | 4.1%(+0.634)#7,563 |
| 78. | Hickam Housing | 4.8% | 4.7%(+0.007)#78 | 4.1%(+0.603)#7,652 |
| 79. | Hauula | 4.8% | 4.7%(+0.006)#79 | 4.1%(+0.602)#7,654 |
| 80. | Kula | 4.7% | 4.7%(-0.028)#80 | 4.1%(+0.568)#7,732 |
| 81. | Halawa | 4.7% | 4.7%(-0.031)#81 | 4.1%(+0.565)#7,748 |
| 82. | Launiupoko | 4.6% | 4.7%(-0.103)#82 | 4.1%(+0.493)#7,935 |
| 83. | Ocean Pointe | 4.6% | 4.7%(-0.142)#83 | 4.1%(+0.454)#8,027 |
| 84. | Makena | 4.5% | 4.7%(-0.201)#84 | 4.1%(+0.396)#8,192 |
| 85. | Kealakekua | 4.5% | 4.7%(-0.274)#85 | 4.1%(+0.322)#8,383 |
| 86. | Makawao | 4.5% | 4.7%(-0.275)#86 | 4.1%(+0.321)#8,390 |
| 87. | Maili | 4.4% | 4.7%(-0.317)#87 | 4.1%(+0.279)#8,512 |
| 88. | Halaula | 4.4% | 4.7%(-0.360)#88 | 4.1%(+0.236)#8,629 |
| 89. | Kapaa | 4.4% | 4.7%(-0.372)#89 | 4.1%(+0.224)#8,663 |
| 90. | Ahuimanu | 4.3% | 4.7%(-0.406)#90 | 4.1%(+0.190)#8,783 |
| 91. | Punaluu | 4.3% | 4.7%(-0.408)#91 | 4.1%(+0.188)#8,789 |
| 92. | Discovery Harbour | 4.3% | 4.7%(-0.442)#92 | 4.1%(+0.154)#8,915 |
| 93. | Wailua Homesteads | 4.3% | 4.7%(-0.464)#93 | 4.1%(+0.132)#8,982 |
| 94. | Urban Honolulu | 4.2% | 4.7%(-0.506)#94 | 4.1%(+0.090)#9,109 |
| 95. | Ualapue | 4.2% | 4.7%(-0.513)#95 | 4.1%(+0.083)#9,127 |
| 96. | Waipio Acres | 4.1% | 4.7%(-0.639)#96 | 4.1%(-0.043)#9,500 |
| 97. | Kaneohe | 4.0% | 4.7%(-0.721)#97 | 4.1%(-0.125)#9,764 |
| 98. | Waimanalo Beach | 4.0% | 4.7%(-0.777)#98 | 4.1%(-0.181)#9,955 |
| 99. | Waikele | 4.0% | 4.7%(-0.796)#99 | 4.1%(-0.200)#10,025 |
| 100. | Fern Acres | 3.9% | 4.7%(-0.831)#100 | 4.1%(-0.235)#10,135 |
1
2Common Questions
What are the Top 10 Cities with the Highest Percentage of Population Employed in Administrative & Support Services in Hawaii?
Top 10 Cities with the Highest Percentage of Population Employed in Administrative & Support Services in Hawaii are:
#1
19.4%
#2
17.4%
#3
16.9%
#4
16.7%
#5
16.7%
#6
16.1%
#7
15.7%
#8
15.7%
#9
15.6%
#10
14.7%
What city has the Highest Percentage of Population Employed in Administrative & Support Services in Hawaii?
Maunaloa has the Highest Percentage of Population Employed in Administrative & Support Services in Hawaii with 19.4%.
What is the Percentage of Population Employed in Administrative & Support Services in the State of Hawaii?
Percentage of Population Employed in Administrative & Support Services in Hawaii is 4.7%.
What is the Percentage of Population Employed in Administrative & Support Services in the United States?
Percentage of Population Employed in Administrative & Support Services in the United States is 4.1%.