Cooper Landing, AK Map & Demographics
Cooper Landing Map
Cooper Landing Overview
$47,029
PER CAPITA INCOME
$148,021
AVG FAMILY INCOME
$148,021
AVG HOUSEHOLD INCOME
46.9%
WAGE / INCOME GAP [ % ]
53.1¢/ $1
WAGE / INCOME GAP [ $ ]
0.25
INEQUALITY / GINI INDEX
224
TOTAL POPULATION
132
MALE POPULATION
92
FEMALE POPULATION
143.48
MALES / 100 FEMALES
69.70
FEMALES / 100 MALES
28.9
MEDIAN AGE
3.7
AVG FAMILY SIZE
3.7
AVG HOUSEHOLD SIZE
104
LABOR FORCE [ PEOPLE ]
81.9%
PERCENT IN LABOR FORCE
Cooper Landing Zip Codes
Cooper Landing Area Codes
Income in Cooper Landing
Income Overview in Cooper Landing
Per Capita Income in Cooper Landing is $47,029, while median incomes of families and households are $148,021 and $148,021 respectively.
| Characteristic | Number | Measure |
| Per Capita Income | 224 | $47,029 |
| Median Family Income | 60 | $148,021 |
| Mean Family Income | 60 | $171,217 |
| Median Household Income | 60 | $148,021 |
| Mean Household Income | 60 | $171,217 |
| Income Deficit | 60 | $0 |
| Wage / Income Gap (%) | 224 | 46.95% |
| Wage / Income Gap ($) | 224 | 53.05¢ per $1 |
| Gini / Inequality Index | 224 | 0.25 |
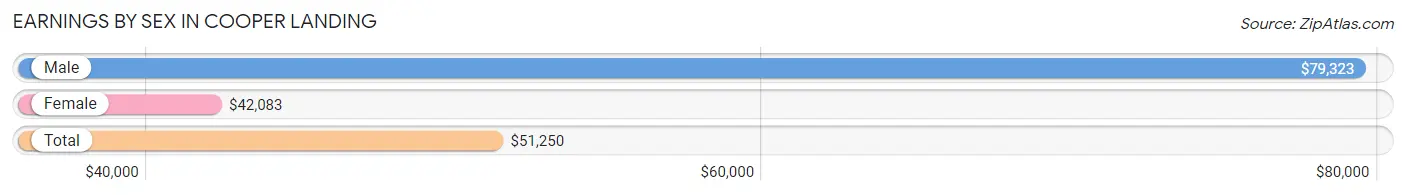
Earnings by Sex in Cooper Landing
Average Earnings in Cooper Landing are $51,250, $79,323 for men and $42,083 for women, a difference of 46.9%.
| Sex | Number | Average Earnings |
| Male | 51 (49.0%) | $79,323 |
| Female | 53 (51.0%) | $42,083 |
| Total | 104 (100.0%) | $51,250 |
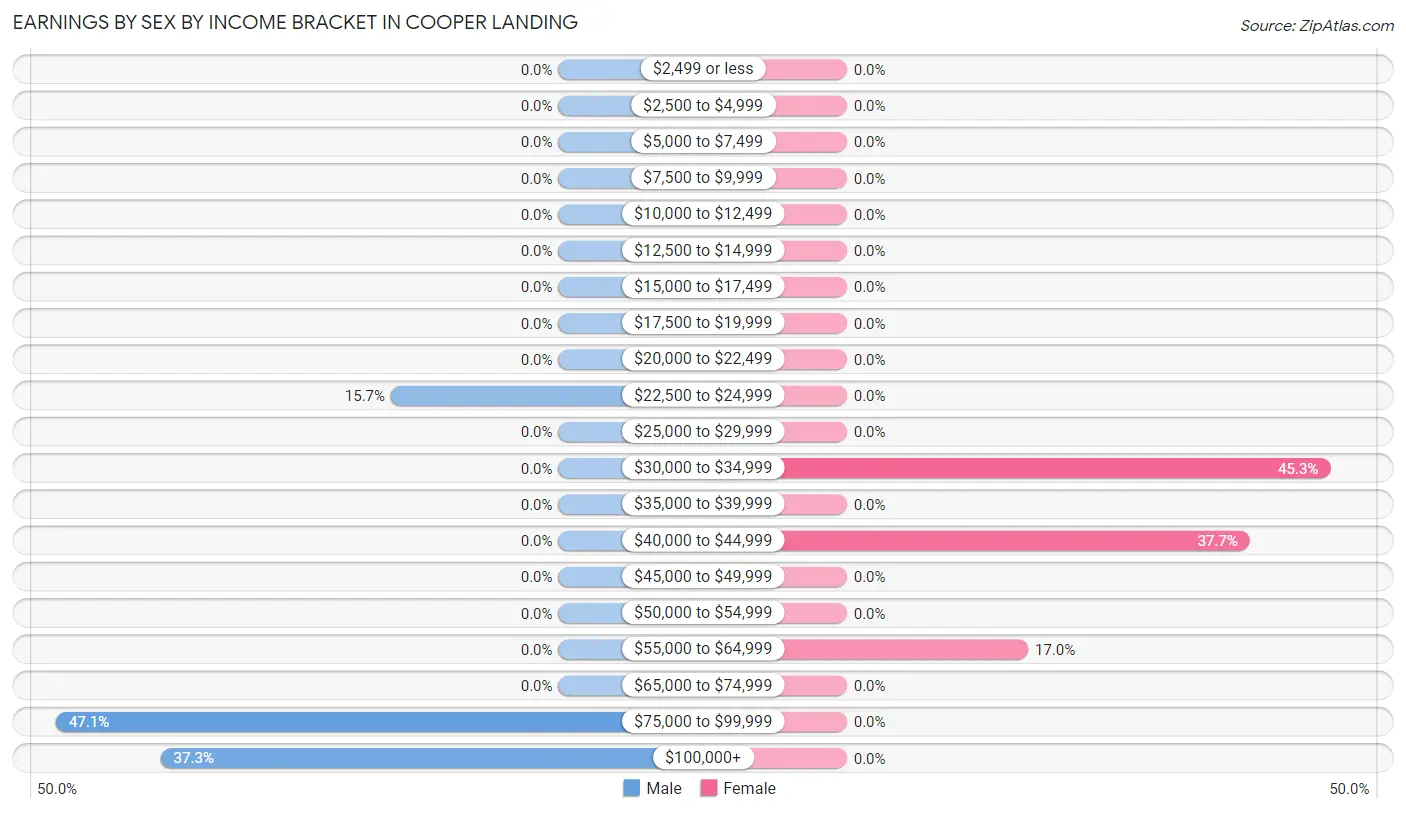
Earnings by Sex by Income Bracket in Cooper Landing
The most common earnings brackets in Cooper Landing are $75,000 to $99,999 for men (24 | 47.1%) and $30,000 to $34,999 for women (24 | 45.3%).
| Income | Male | Female |
| $2,499 or less | 0 (0.0%) | 0 (0.0%) |
| $2,500 to $4,999 | 0 (0.0%) | 0 (0.0%) |
| $5,000 to $7,499 | 0 (0.0%) | 0 (0.0%) |
| $7,500 to $9,999 | 0 (0.0%) | 0 (0.0%) |
| $10,000 to $12,499 | 0 (0.0%) | 0 (0.0%) |
| $12,500 to $14,999 | 0 (0.0%) | 0 (0.0%) |
| $15,000 to $17,499 | 0 (0.0%) | 0 (0.0%) |
| $17,500 to $19,999 | 0 (0.0%) | 0 (0.0%) |
| $20,000 to $22,499 | 0 (0.0%) | 0 (0.0%) |
| $22,500 to $24,999 | 8 (15.7%) | 0 (0.0%) |
| $25,000 to $29,999 | 0 (0.0%) | 0 (0.0%) |
| $30,000 to $34,999 | 0 (0.0%) | 24 (45.3%) |
| $35,000 to $39,999 | 0 (0.0%) | 0 (0.0%) |
| $40,000 to $44,999 | 0 (0.0%) | 20 (37.7%) |
| $45,000 to $49,999 | 0 (0.0%) | 0 (0.0%) |
| $50,000 to $54,999 | 0 (0.0%) | 0 (0.0%) |
| $55,000 to $64,999 | 0 (0.0%) | 9 (17.0%) |
| $65,000 to $74,999 | 0 (0.0%) | 0 (0.0%) |
| $75,000 to $99,999 | 24 (47.1%) | 0 (0.0%) |
| $100,000+ | 19 (37.2%) | 0 (0.0%) |
| Total | 51 (100.0%) | 53 (100.0%) |
Earnings by Sex by Educational Attainment in Cooper Landing
| Educational Attainment | Male Income | Female Income |
| Less than High School | - | - |
| High School Diploma | - | - |
| College or Associate's Degree | - | - |
| Bachelor's Degree | - | - |
| Graduate Degree | - | - |
| Total | $79,323 | $42,083 |
Family Income in Cooper Landing
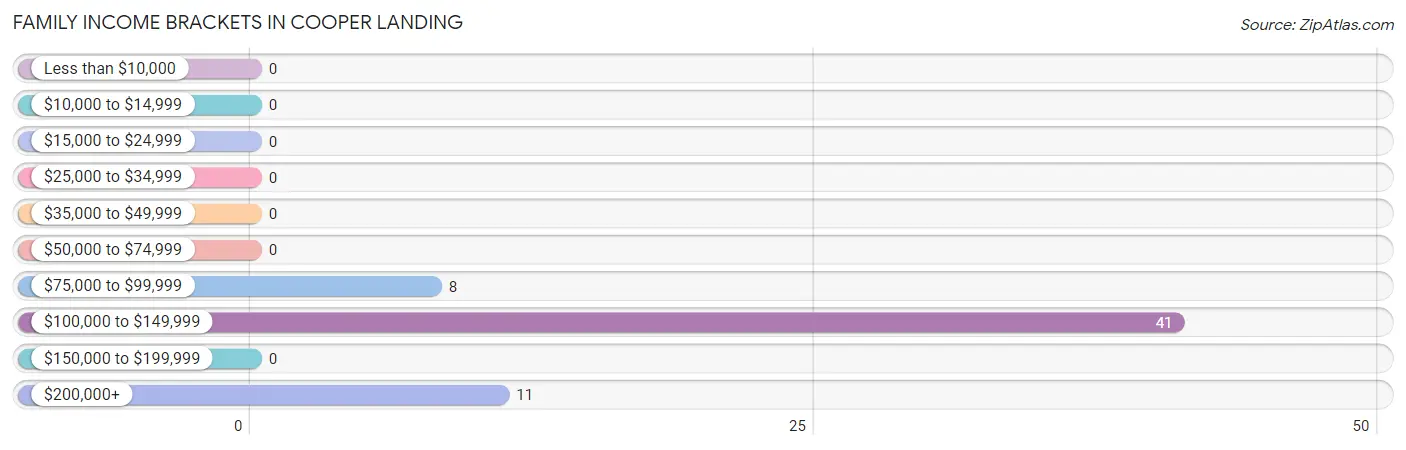
Family Income Brackets in Cooper Landing
According to the Cooper Landing family income data, there are 41 families falling into the $100,000 to $149,999 income range, which is the most common income bracket and makes up 68.3% of all families.
| Income Bracket | # Families | % Families |
| Less than $10,000 | 0 | 0.0% |
| $10,000 to $14,999 | 0 | 0.0% |
| $15,000 to $24,999 | 0 | 0.0% |
| $25,000 to $34,999 | 0 | 0.0% |
| $35,000 to $49,999 | 0 | 0.0% |
| $50,000 to $74,999 | 0 | 0.0% |
| $75,000 to $99,999 | 8 | 13.3% |
| $100,000 to $149,999 | 41 | 68.3% |
| $150,000 to $199,999 | 0 | 0.0% |
| $200,000+ | 11 | 18.3% |
Family Income by Famaliy Size in Cooper Landing
| Income Bracket | # Families | Median Income |
| 2-Person Families | 11 (18.3%) | $0 |
| 3-Person Families | 17 (28.3%) | $0 |
| 4-Person Families | 24 (40.0%) | $0 |
| 5-Person Families | 8 (13.3%) | $0 |
| 6-Person Families | 0 (0.0%) | $0 |
| 7+ Person Families | 0 (0.0%) | $0 |
| Total | 60 (100.0%) | $148,021 |
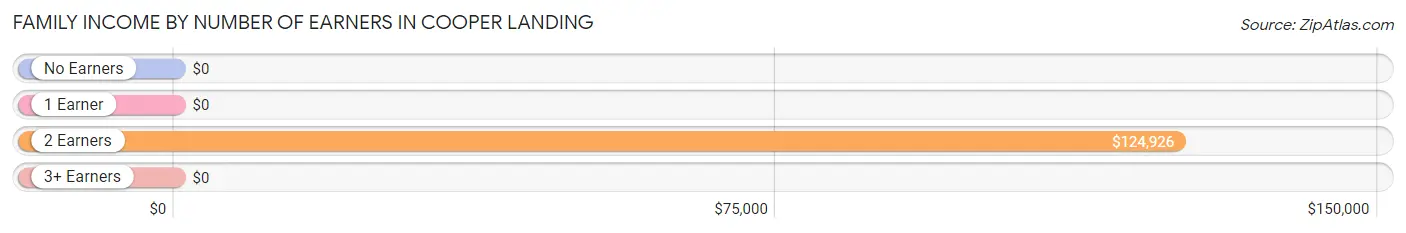
Family Income by Number of Earners in Cooper Landing
| Number of Earners | # Families | Median Income |
| No Earners | 11 (18.3%) | $0 |
| 1 Earner | 0 (0.0%) | $0 |
| 2 Earners | 49 (81.7%) | $124,926 |
| 3+ Earners | 0 (0.0%) | $0 |
| Total | 60 (100.0%) | $148,021 |
Household Income in Cooper Landing
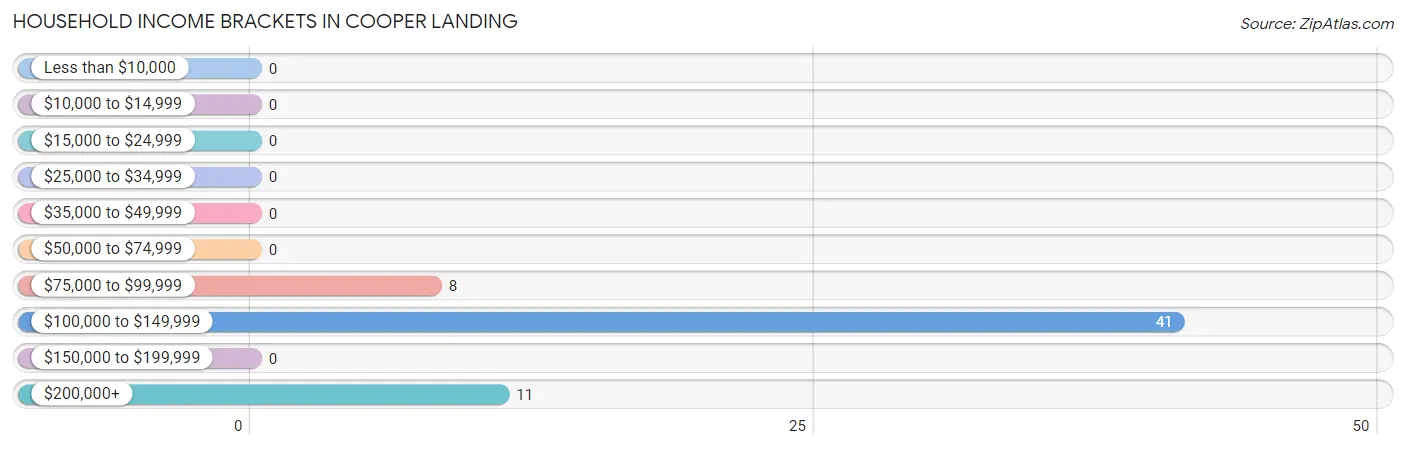
Household Income Brackets in Cooper Landing
With 41 households falling in the category, the $100,000 to $149,999 income range is the most frequent in Cooper Landing, accounting for 68.3% of all households.
| Income Bracket | # Households | % Households |
| Less than $10,000 | 0 | 0.0% |
| $10,000 to $14,999 | 0 | 0.0% |
| $15,000 to $24,999 | 0 | 0.0% |
| $25,000 to $34,999 | 0 | 0.0% |
| $35,000 to $49,999 | 0 | 0.0% |
| $50,000 to $74,999 | 0 | 0.0% |
| $75,000 to $99,999 | 8 | 13.3% |
| $100,000 to $149,999 | 41 | 68.3% |
| $150,000 to $199,999 | 0 | 0.0% |
| $200,000+ | 11 | 18.3% |
Household Income by Householder Age in Cooper Landing
The median household income in Cooper Landing is $148,021, with the highest median household income of $124,926 found in the 25 to 44 years age bracket for the primary householder. A total of 49 households (81.7%) fall into this category.
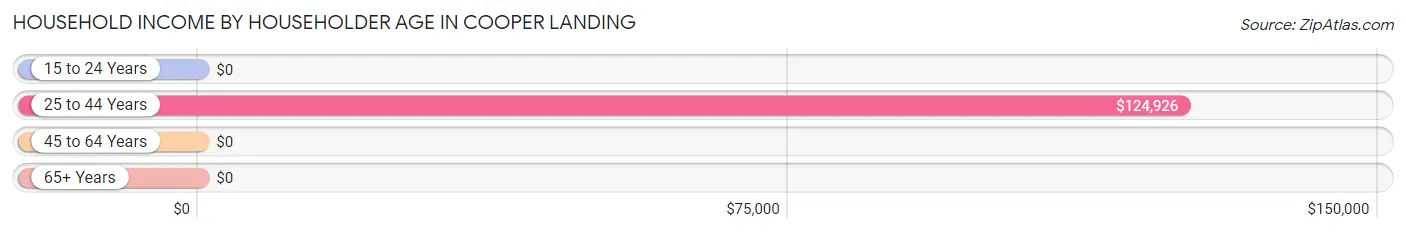
| Income Bracket | # Households | Median Income |
| 15 to 24 Years | 0 (0.0%) | $0 |
| 25 to 44 Years | 49 (81.7%) | $124,926 |
| 45 to 64 Years | 0 (0.0%) | $0 |
| 65+ Years | 11 (18.3%) | $0 |
| Total | 60 (100.0%) | $148,021 |
Poverty in Cooper Landing
Income Below Poverty by Sex and Age in Cooper Landing
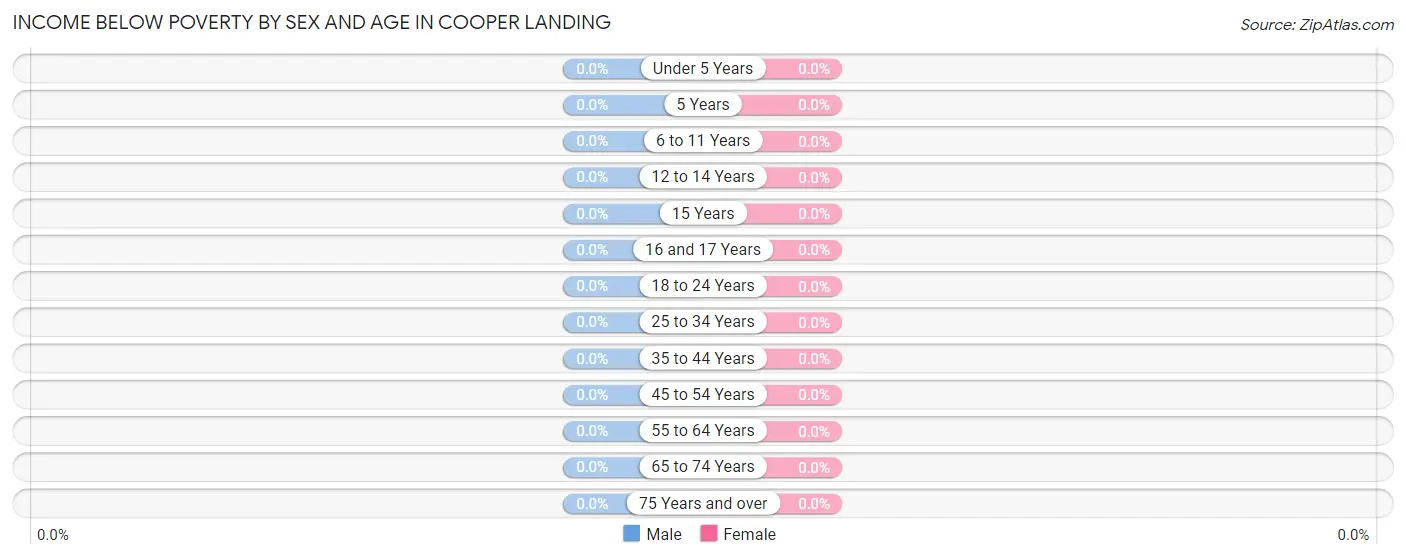
| Age Bracket | Male | Female |
| Under 5 Years | 0 (0.0%) | 0 (0.0%) |
| 5 Years | 0 (0.0%) | 0 (0.0%) |
| 6 to 11 Years | 0 (0.0%) | 0 (0.0%) |
| 12 to 14 Years | 0 (0.0%) | 0 (0.0%) |
| 15 Years | 0 (0.0%) | 0 (0.0%) |
| 16 and 17 Years | 0 (0.0%) | 0 (0.0%) |
| 18 to 24 Years | 0 (0.0%) | 0 (0.0%) |
| 25 to 34 Years | 0 (0.0%) | 0 (0.0%) |
| 35 to 44 Years | 0 (0.0%) | 0 (0.0%) |
| 45 to 54 Years | 0 (0.0%) | 0 (0.0%) |
| 55 to 64 Years | 0 (0.0%) | 0 (0.0%) |
| 65 to 74 Years | 0 (0.0%) | 0 (0.0%) |
| 75 Years and over | 0 (0.0%) | 0 (0.0%) |
| Total | 0 (0.0%) | 0 (0.0%) |
Income Above Poverty by Sex and Age in Cooper Landing
According to the poverty statistics in Cooper Landing, males aged under 5 years and females aged under 5 years are the age groups that are most secure financially, with 100.0% of males and 100.0% of females in these age groups living above the poverty line.
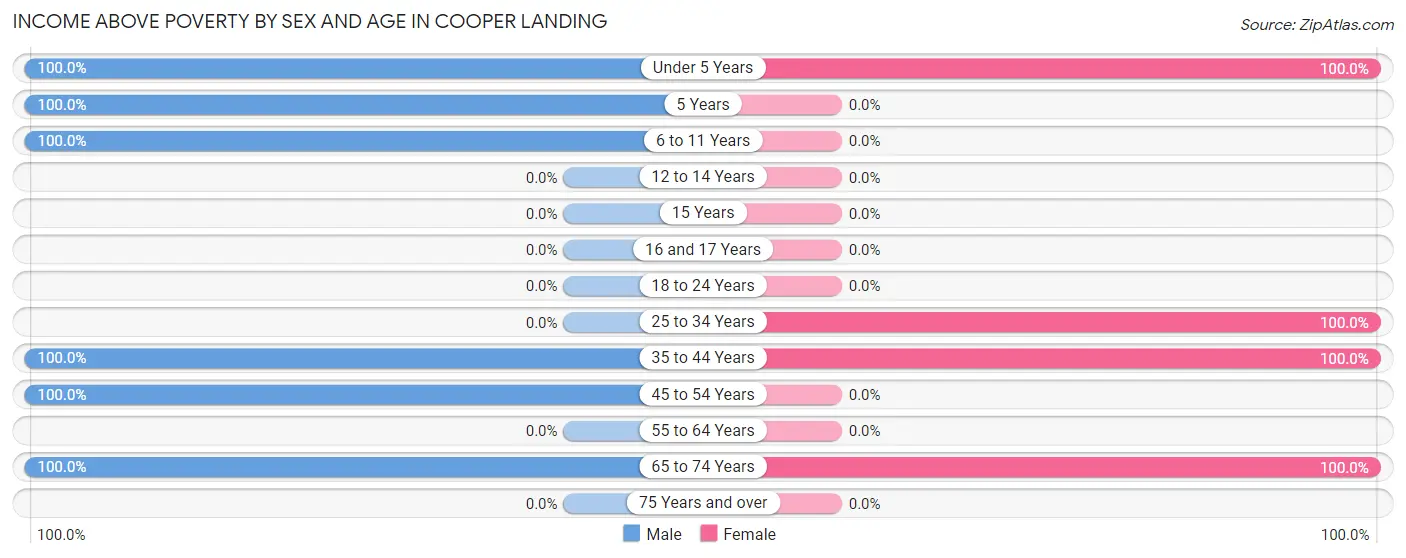
| Age Bracket | Male | Female |
| Under 5 Years | 30 (100.0%) | 28 (100.0%) |
| 5 Years | 22 (100.0%) | 0 (0.0%) |
| 6 to 11 Years | 17 (100.0%) | 0 (0.0%) |
| 12 to 14 Years | 0 (0.0%) | 0 (0.0%) |
| 15 Years | 0 (0.0%) | 0 (0.0%) |
| 16 and 17 Years | 0 (0.0%) | 0 (0.0%) |
| 18 to 24 Years | 0 (0.0%) | 0 (0.0%) |
| 25 to 34 Years | 0 (0.0%) | 41 (100.0%) |
| 35 to 44 Years | 32 (100.0%) | 12 (100.0%) |
| 45 to 54 Years | 19 (100.0%) | 0 (0.0%) |
| 55 to 64 Years | 0 (0.0%) | 0 (0.0%) |
| 65 to 74 Years | 12 (100.0%) | 11 (100.0%) |
| 75 Years and over | 0 (0.0%) | 0 (0.0%) |
| Total | 132 (100.0%) | 92 (100.0%) |
Income Below Poverty Among Married-Couple Families in Cooper Landing
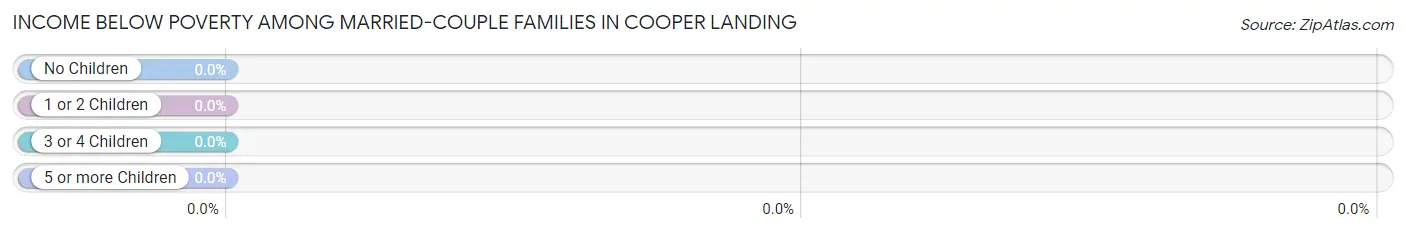
| Children | Above Poverty | Below Poverty |
| No Children | 11 (100.0%) | 0 (0.0%) |
| 1 or 2 Children | 41 (100.0%) | 0 (0.0%) |
| 3 or 4 Children | 8 (100.0%) | 0 (0.0%) |
| 5 or more Children | 0 (0.0%) | 0 (0.0%) |
| Total | 60 (100.0%) | 0 (0.0%) |
Income Below Poverty Among Single-Parent Households in Cooper Landing
| Children | Single Father | Single Mother |
| No Children | 0 (0.0%) | 0 (0.0%) |
| 1 or 2 Children | 0 (0.0%) | 0 (0.0%) |
| 3 or 4 Children | 0 (0.0%) | 0 (0.0%) |
| 5 or more Children | 0 (0.0%) | 0 (0.0%) |
| Total | 0 (0.0%) | 0 (0.0%) |
Income Below Poverty Among Married-Couple vs Single-Parent Households in Cooper Landing
| Children | Married-Couple Families | Single-Parent Households |
| No Children | 0 (0.0%) | 0 (0.0%) |
| 1 or 2 Children | 0 (0.0%) | 0 (0.0%) |
| 3 or 4 Children | 0 (0.0%) | 0 (0.0%) |
| 5 or more Children | 0 (0.0%) | 0 (0.0%) |
| Total | 0 (0.0%) | 0 (0.0%) |
Race in Cooper Landing
The most populous races in Cooper Landing are White / Caucasian (221 | 98.7%), and Asian (3 | 1.3%).
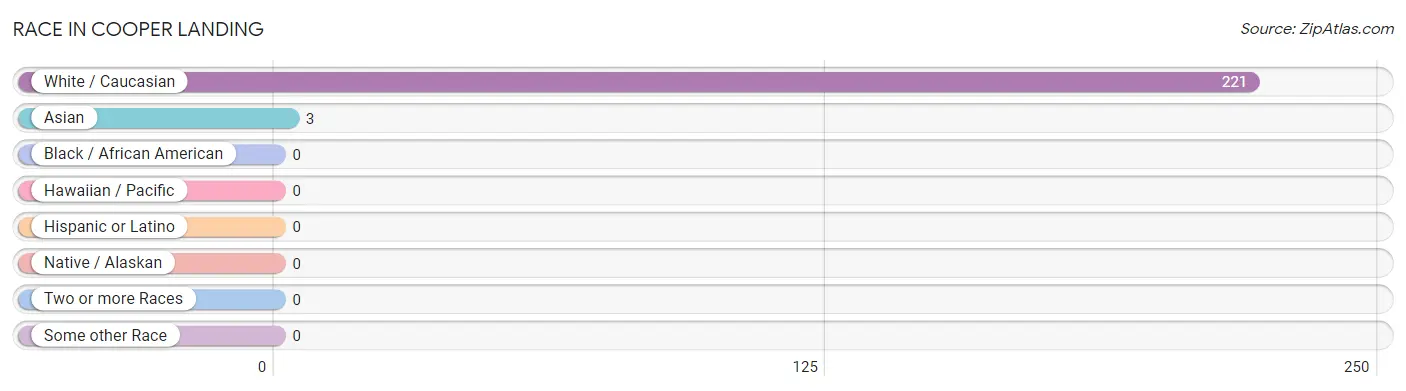
| Race | # Population | % Population |
| Asian | 3 | 1.3% |
| Black / African American | 0 | 0.0% |
| Hawaiian / Pacific | 0 | 0.0% |
| Hispanic or Latino | 0 | 0.0% |
| Native / Alaskan | 0 | 0.0% |
| White / Caucasian | 221 | 98.7% |
| Two or more Races | 0 | 0.0% |
| Some other Race | 0 | 0.0% |
| Total | 224 | 100.0% |
Ancestry in Cooper Landing
The most populous ancestries reported in Cooper Landing are English (96 | 42.9%), Danish (83 | 37.0%), German (58 | 25.9%), Irish (54 | 24.1%), and Scandinavian (8 | 3.6%), together accounting for 133.5% of all Cooper Landing residents.
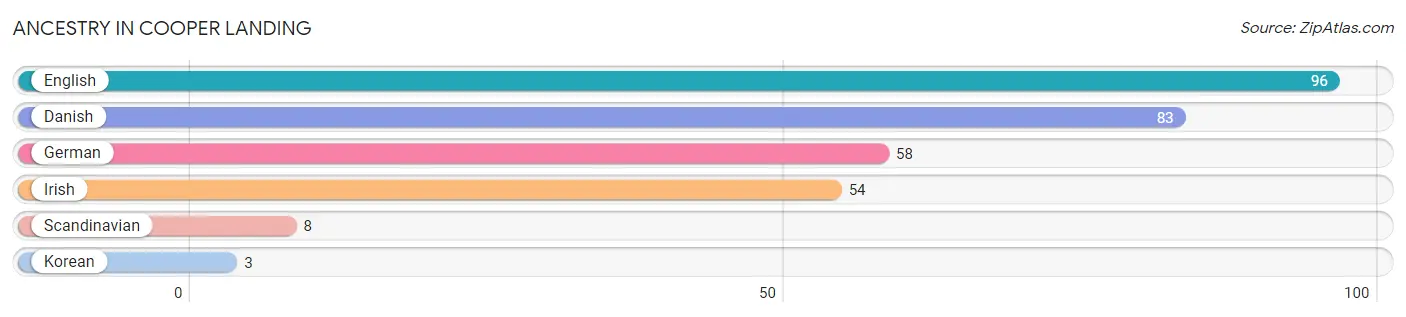
| Ancestry | # Population | % Population |
| Danish | 83 | 37.0% |
| English | 96 | 42.9% |
| German | 58 | 25.9% |
| Irish | 54 | 24.1% |
| Korean | 3 | 1.3% |
| Scandinavian | 8 | 3.6% | View All 6 Rows |
Immigrants in Cooper Landing
The most numerous immigrant groups reported in Cooper Landing came from Asia (3 | 1.3%), Philippines (3 | 1.3%), and South Eastern Asia (3 | 1.3%), together accounting for 4.0% of all Cooper Landing residents.
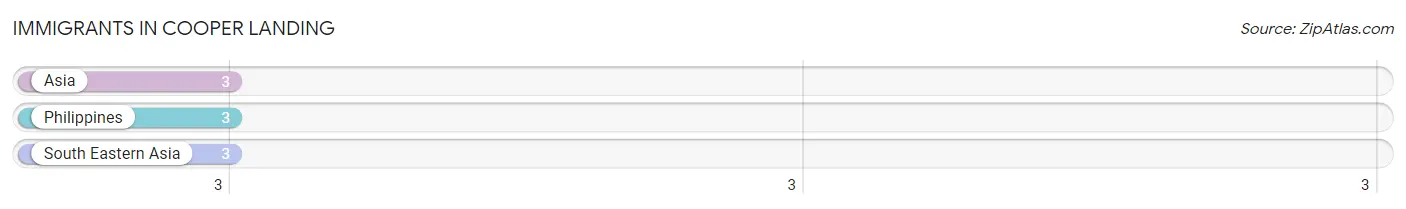
| Immigration Origin | # Population | % Population |
| Asia | 3 | 1.3% |
| Philippines | 3 | 1.3% |
| South Eastern Asia | 3 | 1.3% | View All 3 Rows |
Sex and Age in Cooper Landing
Sex and Age in Cooper Landing
The most populous age groups in Cooper Landing are 5 to 9 Years (39 | 29.5%) for men and Under 5 Years (28 | 30.4%) for women.
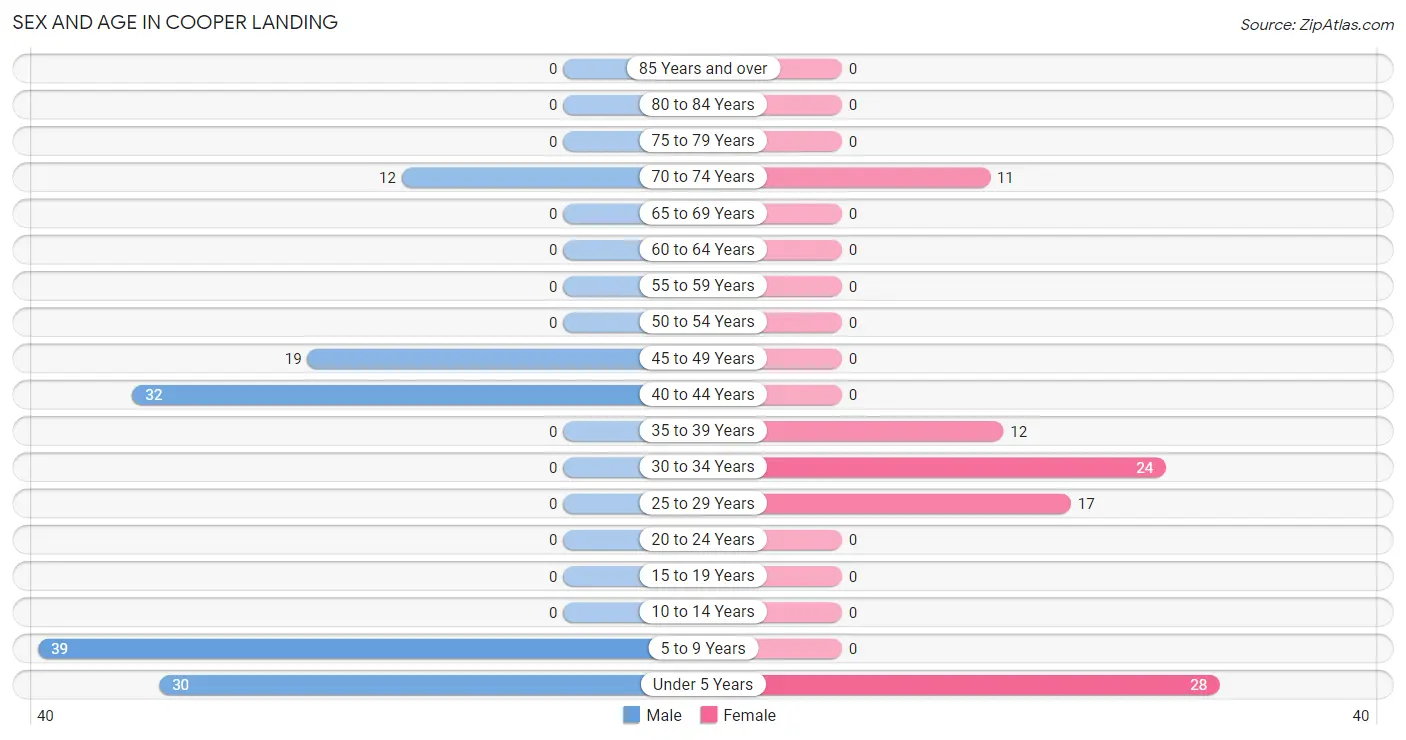
| Age Bracket | Male | Female |
| Under 5 Years | 30 (22.7%) | 28 (30.4%) |
| 5 to 9 Years | 39 (29.5%) | 0 (0.0%) |
| 10 to 14 Years | 0 (0.0%) | 0 (0.0%) |
| 15 to 19 Years | 0 (0.0%) | 0 (0.0%) |
| 20 to 24 Years | 0 (0.0%) | 0 (0.0%) |
| 25 to 29 Years | 0 (0.0%) | 17 (18.5%) |
| 30 to 34 Years | 0 (0.0%) | 24 (26.1%) |
| 35 to 39 Years | 0 (0.0%) | 12 (13.0%) |
| 40 to 44 Years | 32 (24.2%) | 0 (0.0%) |
| 45 to 49 Years | 19 (14.4%) | 0 (0.0%) |
| 50 to 54 Years | 0 (0.0%) | 0 (0.0%) |
| 55 to 59 Years | 0 (0.0%) | 0 (0.0%) |
| 60 to 64 Years | 0 (0.0%) | 0 (0.0%) |
| 65 to 69 Years | 0 (0.0%) | 0 (0.0%) |
| 70 to 74 Years | 12 (9.1%) | 11 (12.0%) |
| 75 to 79 Years | 0 (0.0%) | 0 (0.0%) |
| 80 to 84 Years | 0 (0.0%) | 0 (0.0%) |
| 85 Years and over | 0 (0.0%) | 0 (0.0%) |
| Total | 132 (100.0%) | 92 (100.0%) |
Families and Households in Cooper Landing
Median Family Size in Cooper Landing
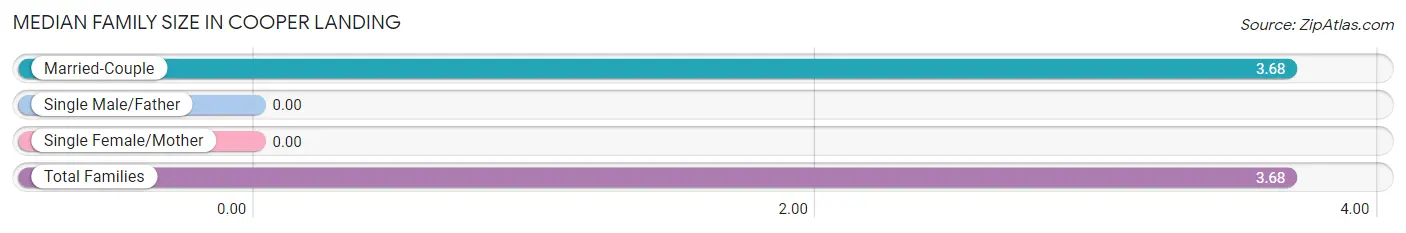
| Family Type | # Families | Family Size |
| Married-Couple | 60 (100.0%) | 3.68 |
| Single Male/Father | 0 (0.0%) | - |
| Single Female/Mother | 0 (0.0%) | - |
| Total Families | 60 (100.0%) | 3.68 |
Median Household Size in Cooper Landing
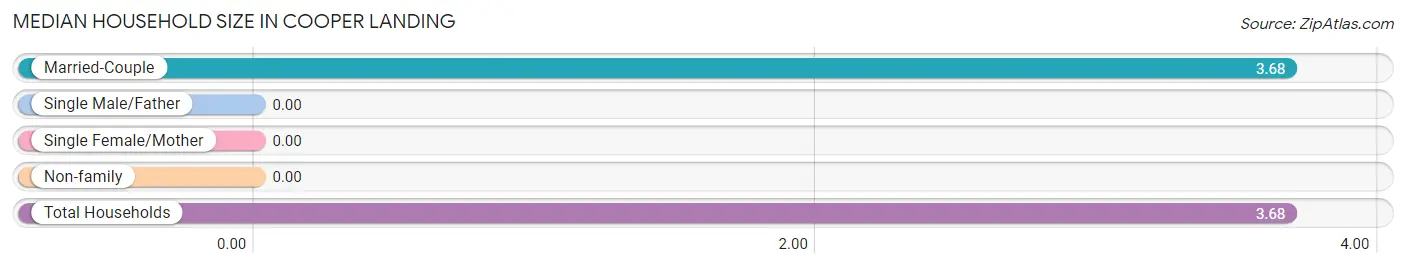
| Household Type | # Households | Household Size |
| Married-Couple | 60 (100.0%) | 3.68 |
| Single Male/Father | 0 (0.0%) | - |
| Single Female/Mother | 0 (0.0%) | - |
| Non-family | 0 (0.0%) | - |
| Total Households | 60 (100.0%) | 3.68 |
Household Size by Marriage Status in Cooper Landing
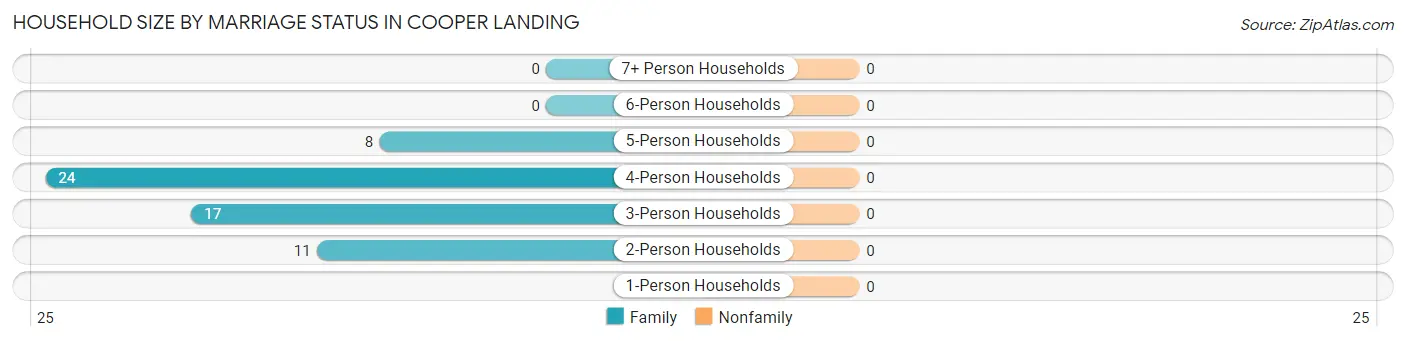
| Household Size | Family Households | Nonfamily Households |
| 1-Person Households | - | 0 (0.0%) |
| 2-Person Households | 11 (18.3%) | 0 (0.0%) |
| 3-Person Households | 17 (28.3%) | 0 (0.0%) |
| 4-Person Households | 24 (40.0%) | 0 (0.0%) |
| 5-Person Households | 8 (13.3%) | 0 (0.0%) |
| 6-Person Households | 0 (0.0%) | 0 (0.0%) |
| 7+ Person Households | 0 (0.0%) | 0 (0.0%) |
| Total | 60 (100.0%) | 0 (0.0%) |
Female Fertility in Cooper Landing
Fertility by Age in Cooper Landing
Average fertility rate in Cooper Landing is 321.0 births per 1,000 women. Women in the age bracket of 20 to 34 years have the highest fertility rate with 415.0 births per 1,000 women. Women in the age bracket of 20 to 34 years acount for 100.0% of all women with births.
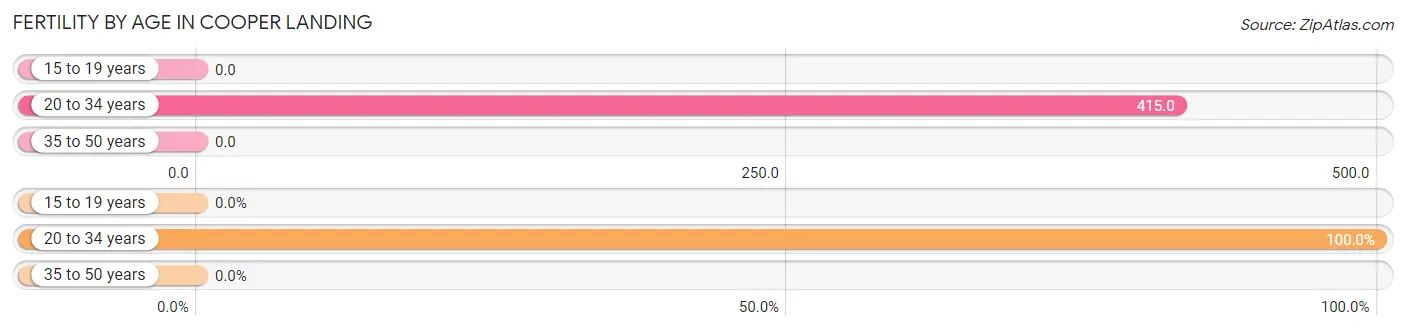
| Age Bracket | Women with Births | Births / 1,000 Women |
| 15 to 19 years | 0 (0.0%) | 0.0 |
| 20 to 34 years | 17 (100.0%) | 415.0 |
| 35 to 50 years | 0 (0.0%) | 0.0 |
| Total | 17 (100.0%) | 321.0 |
Fertility by Age by Marriage Status in Cooper Landing

| Age Bracket | Married | Unmarried |
| 15 to 19 years | 0 (0.0%) | 0 (0.0%) |
| 20 to 34 years | 17 (100.0%) | 0 (0.0%) |
| 35 to 50 years | 0 (0.0%) | 0 (0.0%) |
| Total | 17 (100.0%) | 0 (0.0%) |
Fertility by Education in Cooper Landing
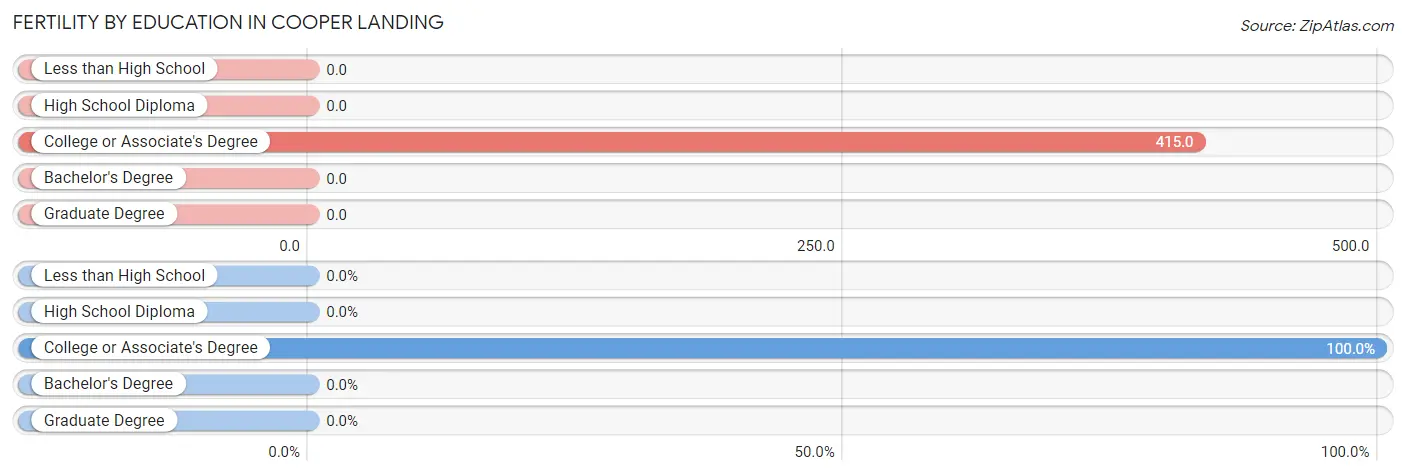
| Educational Attainment | Women with Births | Births / 1,000 Women |
| Less than High School | 0 (0.0%) | 0.0 |
| High School Diploma | 0 (0.0%) | 0.0 |
| College or Associate's Degree | 17 (100.0%) | 415.0 |
| Bachelor's Degree | 0 (0.0%) | 0.0 |
| Graduate Degree | 0 (0.0%) | 0.0 |
| Total | 17 (100.0%) | 321.0 |
Fertility by Education by Marriage Status in Cooper Landing
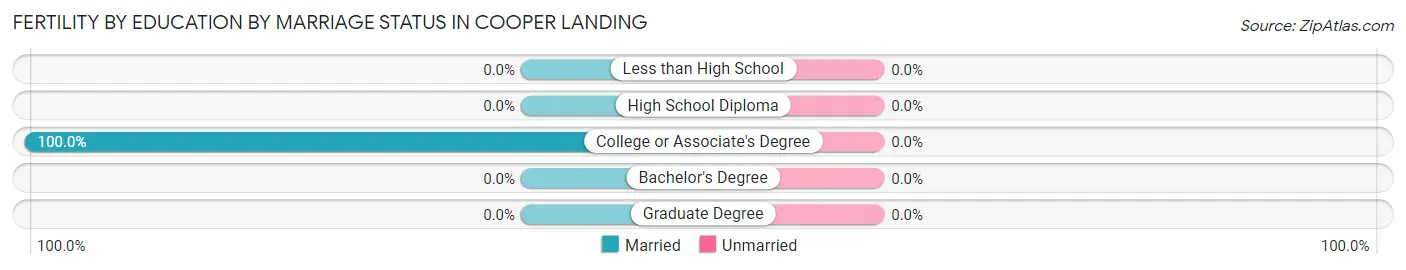
| Educational Attainment | Married | Unmarried |
| Less than High School | 0 (0.0%) | 0 (0.0%) |
| High School Diploma | 0 (0.0%) | 0 (0.0%) |
| College or Associate's Degree | 17 (100.0%) | 0 (0.0%) |
| Bachelor's Degree | 0 (0.0%) | 0 (0.0%) |
| Graduate Degree | 0 (0.0%) | 0 (0.0%) |
| Total | 17 (100.0%) | 0 (0.0%) |
Employment Characteristics in Cooper Landing
Employment by Class of Employer in Cooper Landing
Among the 80 employed individuals in Cooper Landing, private company employees (63 | 78.7%), and self-employed (not incorporated) (17 | 21.2%) make up the most common classes of employment.
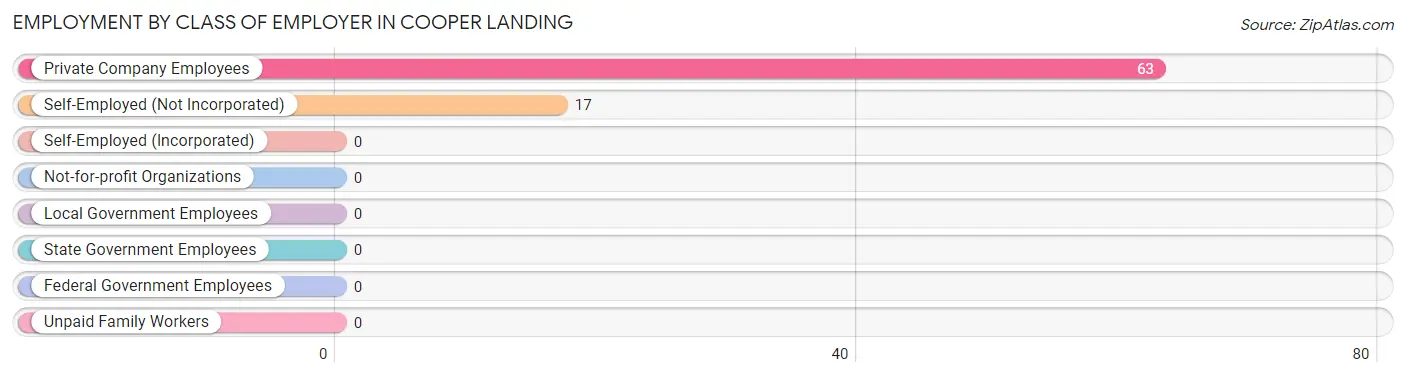
| Employer Class | # Employees | % Employees |
| Private Company Employees | 63 | 78.7% |
| Self-Employed (Incorporated) | 0 | 0.0% |
| Self-Employed (Not Incorporated) | 17 | 21.2% |
| Not-for-profit Organizations | 0 | 0.0% |
| Local Government Employees | 0 | 0.0% |
| State Government Employees | 0 | 0.0% |
| Federal Government Employees | 0 | 0.0% |
| Unpaid Family Workers | 0 | 0.0% |
| Total | 80 | 100.0% |
Employment Status by Age in Cooper Landing
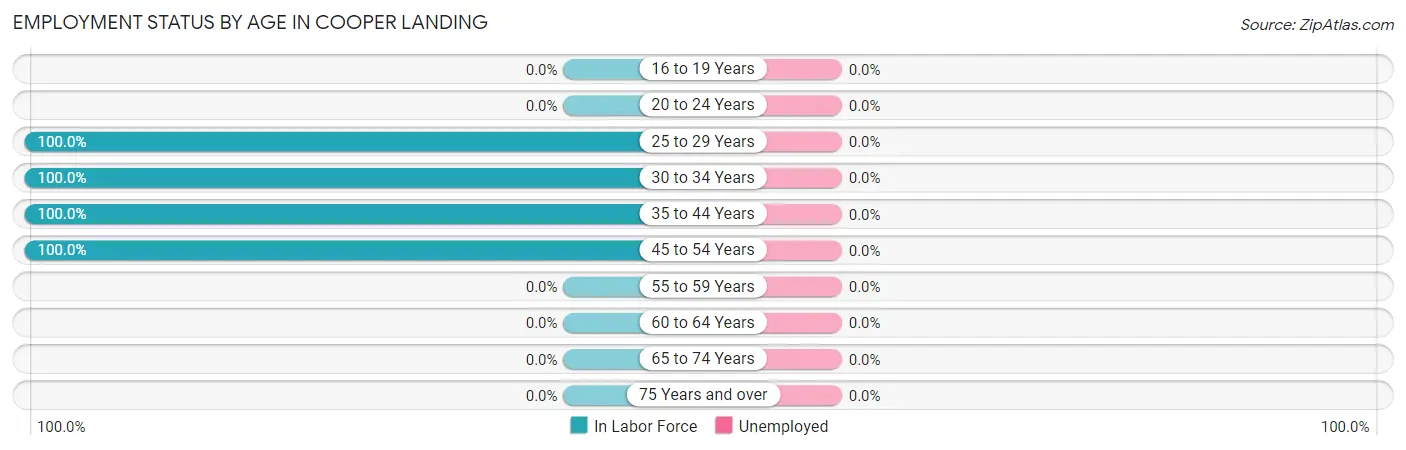
| Age Bracket | In Labor Force | Unemployed |
| 16 to 19 Years | 0 (0.0%) | 0 (0.0%) |
| 20 to 24 Years | 0 (0.0%) | 0 (0.0%) |
| 25 to 29 Years | 17 (100.0%) | 0 (0.0%) |
| 30 to 34 Years | 24 (100.0%) | 0 (0.0%) |
| 35 to 44 Years | 44 (100.0%) | 0 (0.0%) |
| 45 to 54 Years | 19 (100.0%) | 0 (0.0%) |
| 55 to 59 Years | 0 (0.0%) | 0 (0.0%) |
| 60 to 64 Years | 0 (0.0%) | 0 (0.0%) |
| 65 to 74 Years | 0 (0.0%) | 0 (0.0%) |
| 75 Years and over | 0 (0.0%) | 0 (0.0%) |
| Total | 104 (81.9%) | 0 (0.0%) |
Employment Status by Educational Attainment in Cooper Landing
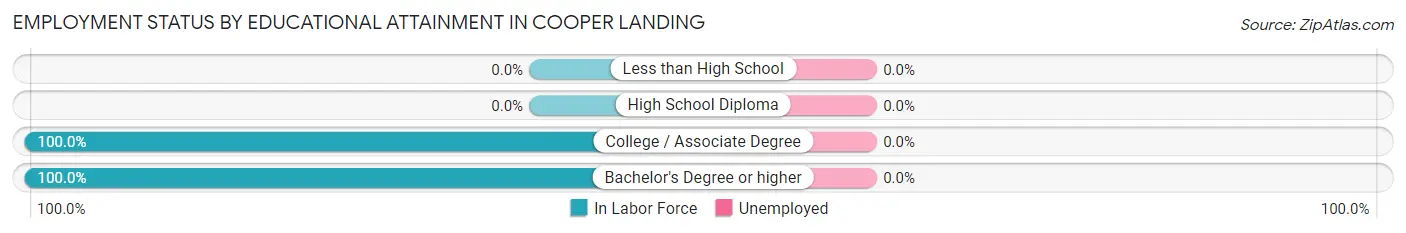
| Educational Attainment | In Labor Force | Unemployed |
| Less than High School | 0 (0.0%) | 0 (0.0%) |
| High School Diploma | 0 (0.0%) | 0 (0.0%) |
| College / Associate Degree | 84 (100.0%) | 0 (0.0%) |
| Bachelor's Degree or higher | 20 (100.0%) | 0 (0.0%) |
| Total | 104 (100.0%) | 0 (0.0%) |
Employment Occupations by Sex in Cooper Landing
Management, Business, Science and Arts Occupations
The most common Management, Business, Science and Arts occupations in Cooper Landing are Management (60 | 57.7%), and Business & Financial (3 | 2.9%).
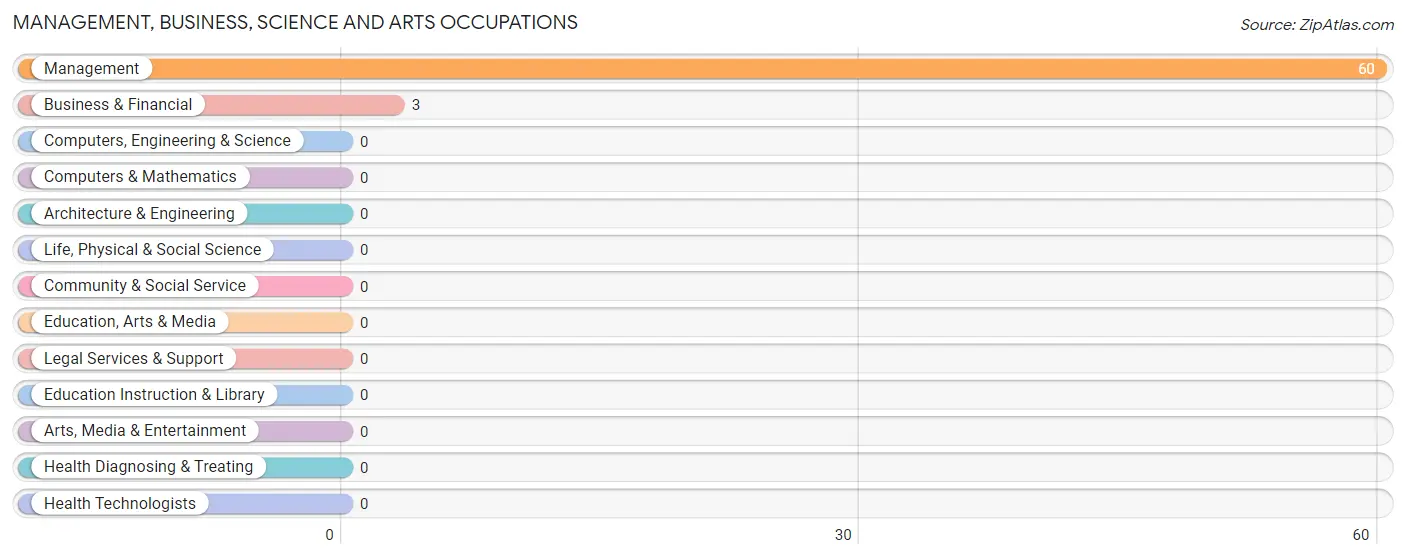
Management, Business, Science and Arts Occupations by Sex
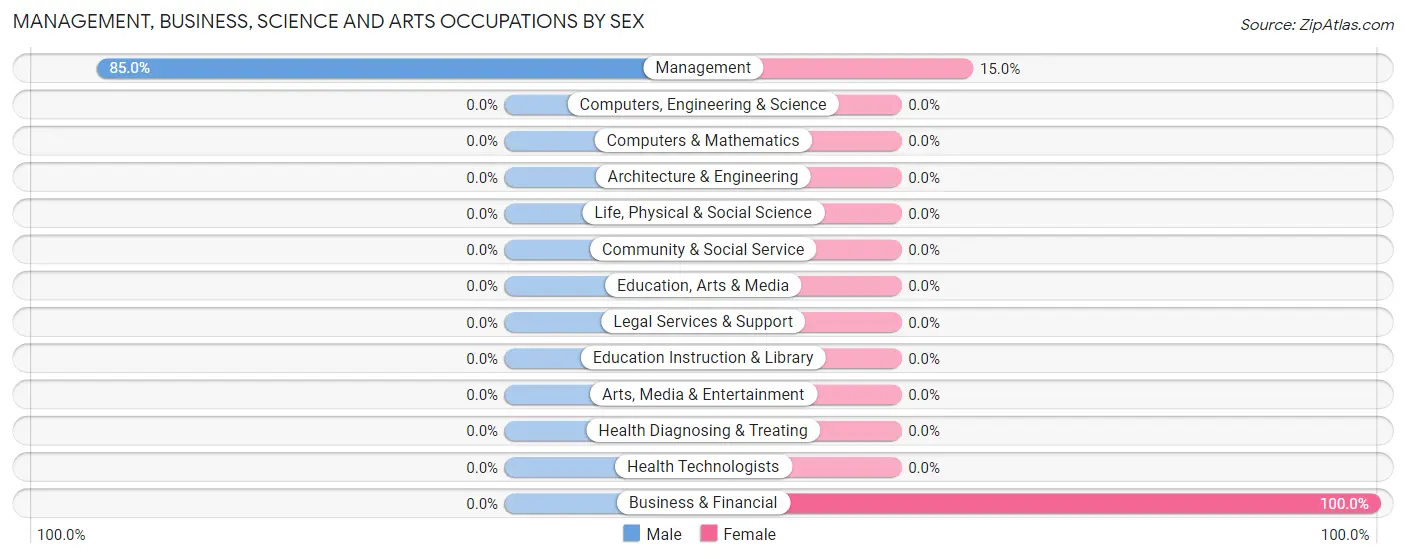
| Occupation | Male | Female |
| Management | 51 (85.0%) | 9 (15.0%) |
| Business & Financial | 0 (0.0%) | 3 (100.0%) |
| Computers, Engineering & Science | 0 (0.0%) | 0 (0.0%) |
| Computers & Mathematics | 0 (0.0%) | 0 (0.0%) |
| Architecture & Engineering | 0 (0.0%) | 0 (0.0%) |
| Life, Physical & Social Science | 0 (0.0%) | 0 (0.0%) |
| Community & Social Service | 0 (0.0%) | 0 (0.0%) |
| Education, Arts & Media | 0 (0.0%) | 0 (0.0%) |
| Legal Services & Support | 0 (0.0%) | 0 (0.0%) |
| Education Instruction & Library | 0 (0.0%) | 0 (0.0%) |
| Arts, Media & Entertainment | 0 (0.0%) | 0 (0.0%) |
| Health Diagnosing & Treating | 0 (0.0%) | 0 (0.0%) |
| Health Technologists | 0 (0.0%) | 0 (0.0%) |
| Total (Category) | 51 (80.9%) | 12 (19.1%) |
| Total (Overall) | 51 (49.0%) | 53 (51.0%) |
Services Occupations
Services Occupations by Sex
| Occupation | Male | Female |
| Healthcare Support | 0 (0.0%) | 0 (0.0%) |
| Security & Protection | 0 (0.0%) | 0 (0.0%) |
| Firefighting & Prevention | 0 (0.0%) | 0 (0.0%) |
| Law Enforcement | 0 (0.0%) | 0 (0.0%) |
| Food Preparation & Serving | 0 (0.0%) | 0 (0.0%) |
| Cleaning & Maintenance | 0 (0.0%) | 0 (0.0%) |
| Personal Care & Service | 0 (0.0%) | 0 (0.0%) |
| Total (Category) | 0 (0.0%) | 0 (0.0%) |
| Total (Overall) | 51 (49.0%) | 53 (51.0%) |
Sales and Office Occupations
The most common Sales and Office occupations in Cooper Landing are , and Office & Administration (41 | 39.4%).
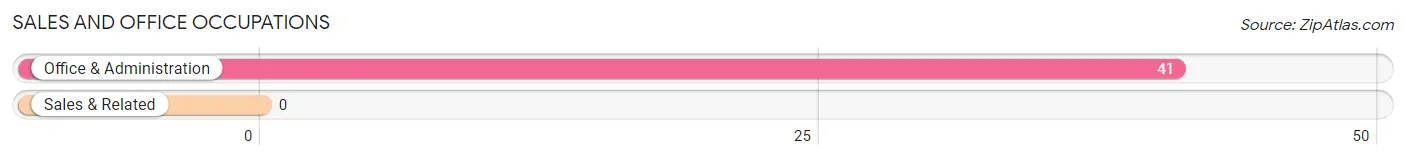
Sales and Office Occupations by Sex
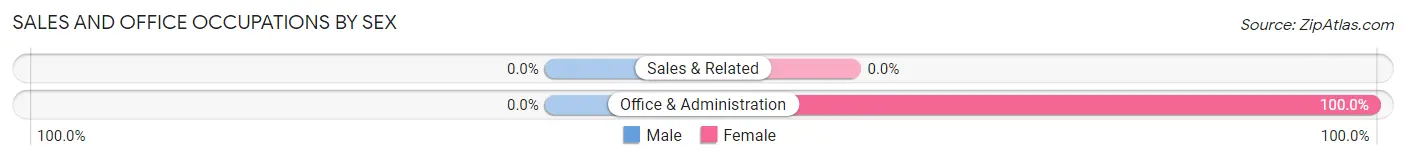
| Occupation | Male | Female |
| Sales & Related | 0 (0.0%) | 0 (0.0%) |
| Office & Administration | 0 (0.0%) | 41 (100.0%) |
| Total (Category) | 0 (0.0%) | 41 (100.0%) |
| Total (Overall) | 51 (49.0%) | 53 (51.0%) |
Natural Resources, Construction and Maintenance Occupations
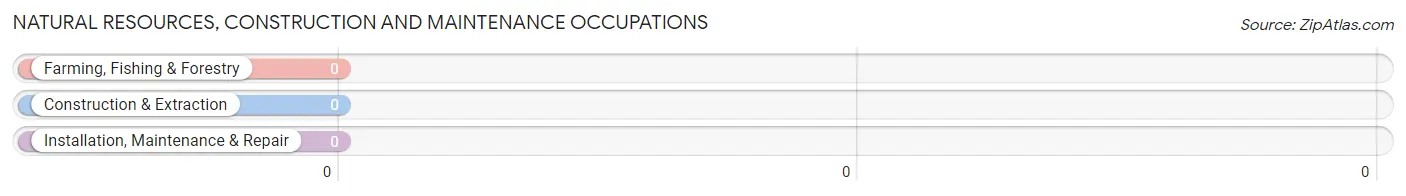
Natural Resources, Construction and Maintenance Occupations by Sex
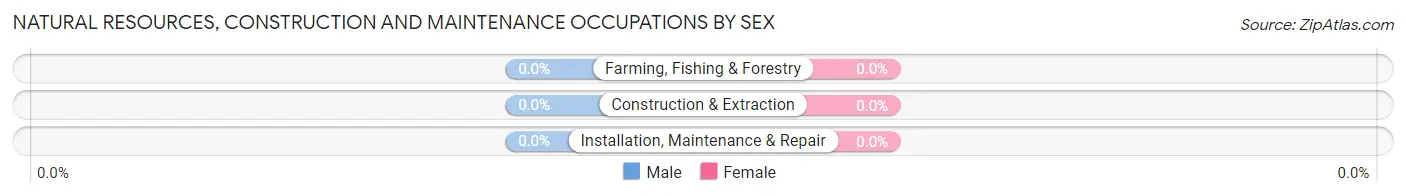
| Occupation | Male | Female |
| Farming, Fishing & Forestry | 0 (0.0%) | 0 (0.0%) |
| Construction & Extraction | 0 (0.0%) | 0 (0.0%) |
| Installation, Maintenance & Repair | 0 (0.0%) | 0 (0.0%) |
| Total (Category) | 0 (0.0%) | 0 (0.0%) |
| Total (Overall) | 51 (49.0%) | 53 (51.0%) |
Production, Transportation and Moving Occupations
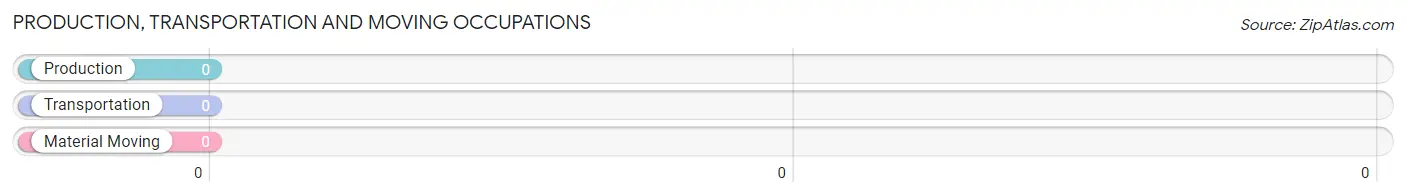
Production, Transportation and Moving Occupations by Sex
| Occupation | Male | Female |
| Production | 0 (0.0%) | 0 (0.0%) |
| Transportation | 0 (0.0%) | 0 (0.0%) |
| Material Moving | 0 (0.0%) | 0 (0.0%) |
| Total (Category) | 0 (0.0%) | 0 (0.0%) |
| Total (Overall) | 51 (49.0%) | 53 (51.0%) |
Employment Industries by Sex in Cooper Landing
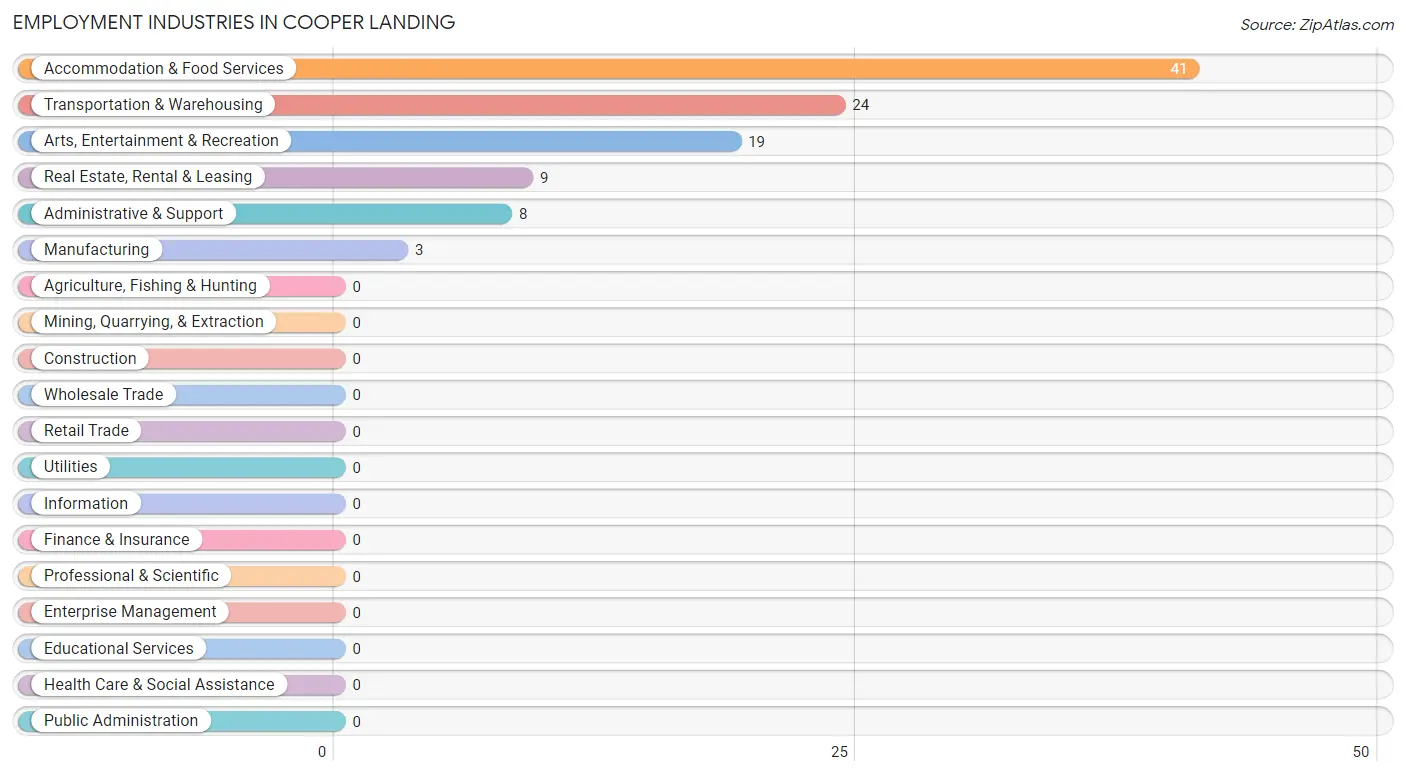
Employment Industries in Cooper Landing
The major employment industries in Cooper Landing include Accommodation & Food Services (41 | 39.4%), Transportation & Warehousing (24 | 23.1%), Arts, Entertainment & Recreation (19 | 18.3%), Real Estate, Rental & Leasing (9 | 8.6%), and Administrative & Support (8 | 7.7%).
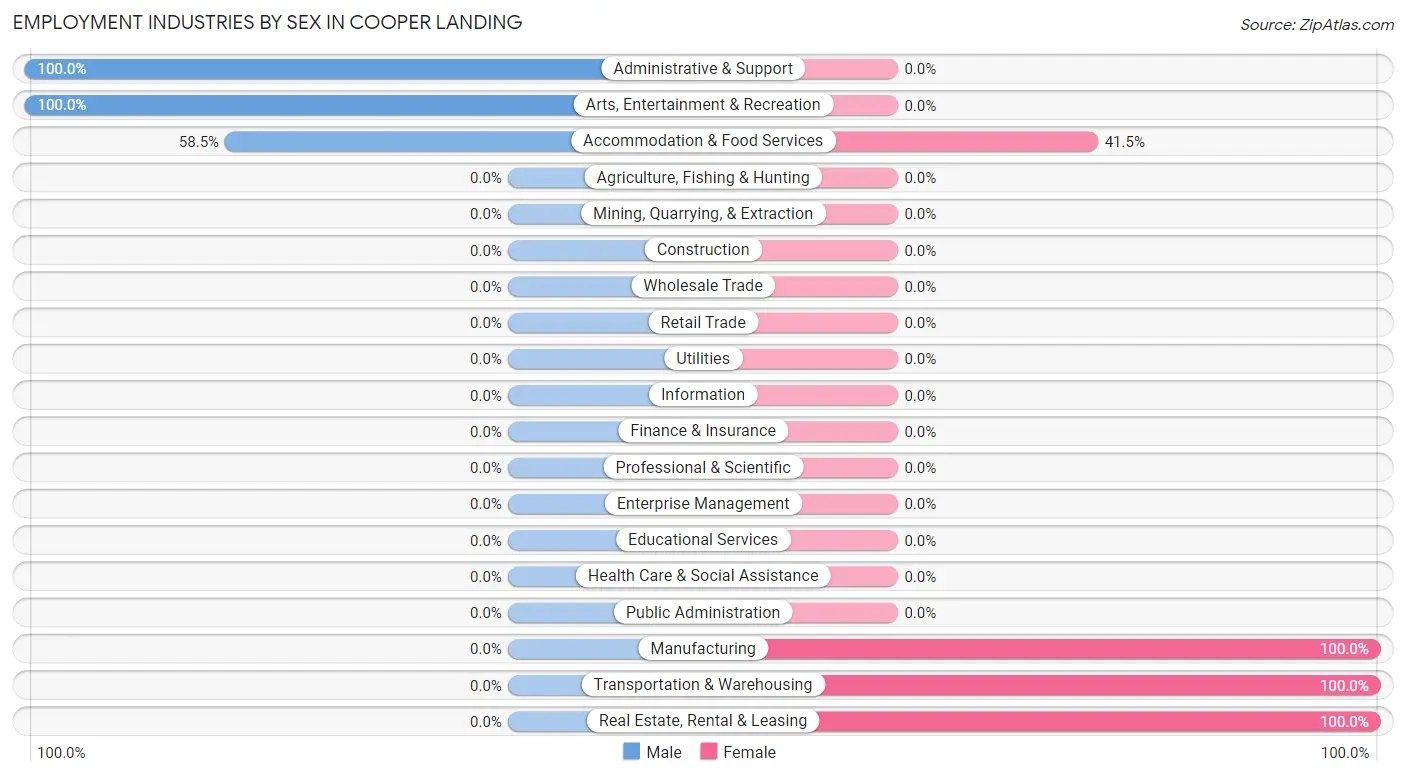
Employment Industries by Sex in Cooper Landing
The Cooper Landing industries that see more men than women are Administrative & Support (100.0%), Arts, Entertainment & Recreation (100.0%), and Accommodation & Food Services (58.5%), whereas the industries that tend to have a higher number of women are Manufacturing (100.0%), Transportation & Warehousing (100.0%), and Real Estate, Rental & Leasing (100.0%).
| Industry | Male | Female |
| Agriculture, Fishing & Hunting | 0 (0.0%) | 0 (0.0%) |
| Mining, Quarrying, & Extraction | 0 (0.0%) | 0 (0.0%) |
| Construction | 0 (0.0%) | 0 (0.0%) |
| Manufacturing | 0 (0.0%) | 3 (100.0%) |
| Wholesale Trade | 0 (0.0%) | 0 (0.0%) |
| Retail Trade | 0 (0.0%) | 0 (0.0%) |
| Transportation & Warehousing | 0 (0.0%) | 24 (100.0%) |
| Utilities | 0 (0.0%) | 0 (0.0%) |
| Information | 0 (0.0%) | 0 (0.0%) |
| Finance & Insurance | 0 (0.0%) | 0 (0.0%) |
| Real Estate, Rental & Leasing | 0 (0.0%) | 9 (100.0%) |
| Professional & Scientific | 0 (0.0%) | 0 (0.0%) |
| Enterprise Management | 0 (0.0%) | 0 (0.0%) |
| Administrative & Support | 8 (100.0%) | 0 (0.0%) |
| Educational Services | 0 (0.0%) | 0 (0.0%) |
| Health Care & Social Assistance | 0 (0.0%) | 0 (0.0%) |
| Arts, Entertainment & Recreation | 19 (100.0%) | 0 (0.0%) |
| Accommodation & Food Services | 24 (58.5%) | 17 (41.5%) |
| Public Administration | 0 (0.0%) | 0 (0.0%) |
| Total | 51 (49.0%) | 53 (51.0%) |
Education in Cooper Landing
School Enrollment in Cooper Landing
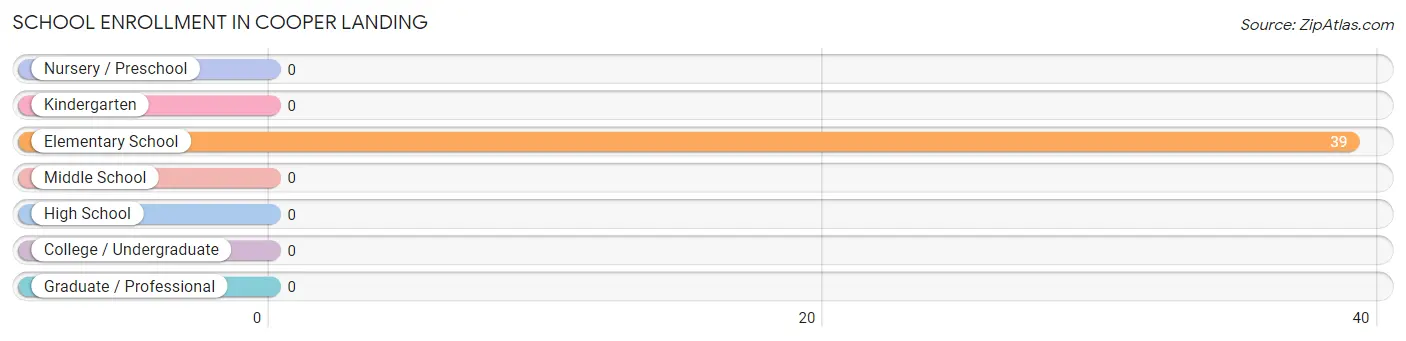
| School Level | # Students | % Students |
| Nursery / Preschool | 0 | 0.0% |
| Kindergarten | 0 | 0.0% |
| Elementary School | 39 | 100.0% |
| Middle School | 0 | 0.0% |
| High School | 0 | 0.0% |
| College / Undergraduate | 0 | 0.0% |
| Graduate / Professional | 0 | 0.0% |
| Total | 39 | 100.0% |
School Enrollment by Age by Funding Source in Cooper Landing
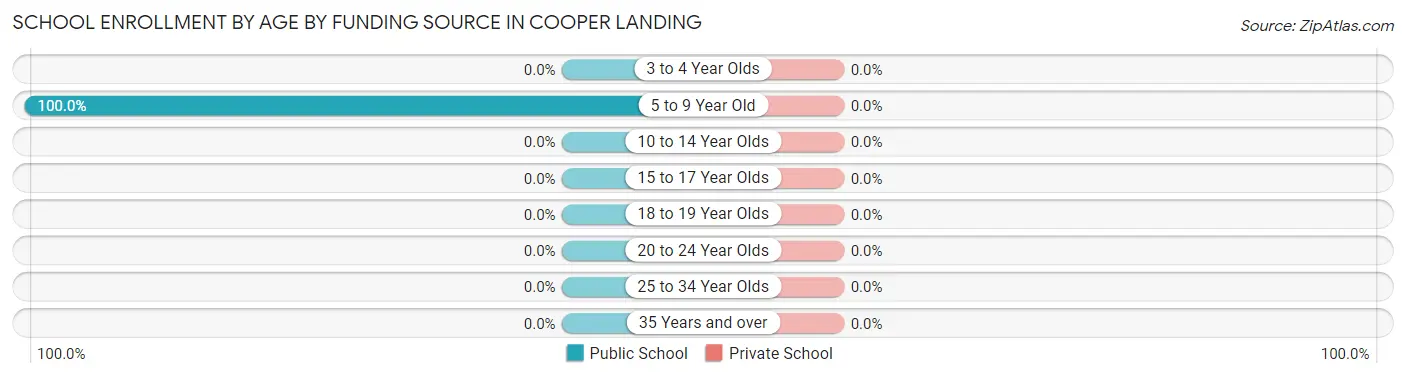
| Age Bracket | Public School | Private School |
| 3 to 4 Year Olds | 0 (0.0%) | 0 (0.0%) |
| 5 to 9 Year Old | 39 (100.0%) | 0 (0.0%) |
| 10 to 14 Year Olds | 0 (0.0%) | 0 (0.0%) |
| 15 to 17 Year Olds | 0 (0.0%) | 0 (0.0%) |
| 18 to 19 Year Olds | 0 (0.0%) | 0 (0.0%) |
| 20 to 24 Year Olds | 0 (0.0%) | 0 (0.0%) |
| 25 to 34 Year Olds | 0 (0.0%) | 0 (0.0%) |
| 35 Years and over | 0 (0.0%) | 0 (0.0%) |
| Total | 39 (100.0%) | 0 (0.0%) |
Educational Attainment by Field of Study in Cooper Landing
Computers & mathematics (12 | 21.8%), social sciences (12 | 21.8%), education (11 | 20.0%), bio, nature & agricultural (9 | 16.4%), and science & technology (8 | 14.5%) are the most common fields of study among 55 individuals in Cooper Landing who have obtained a bachelor's degree or higher.
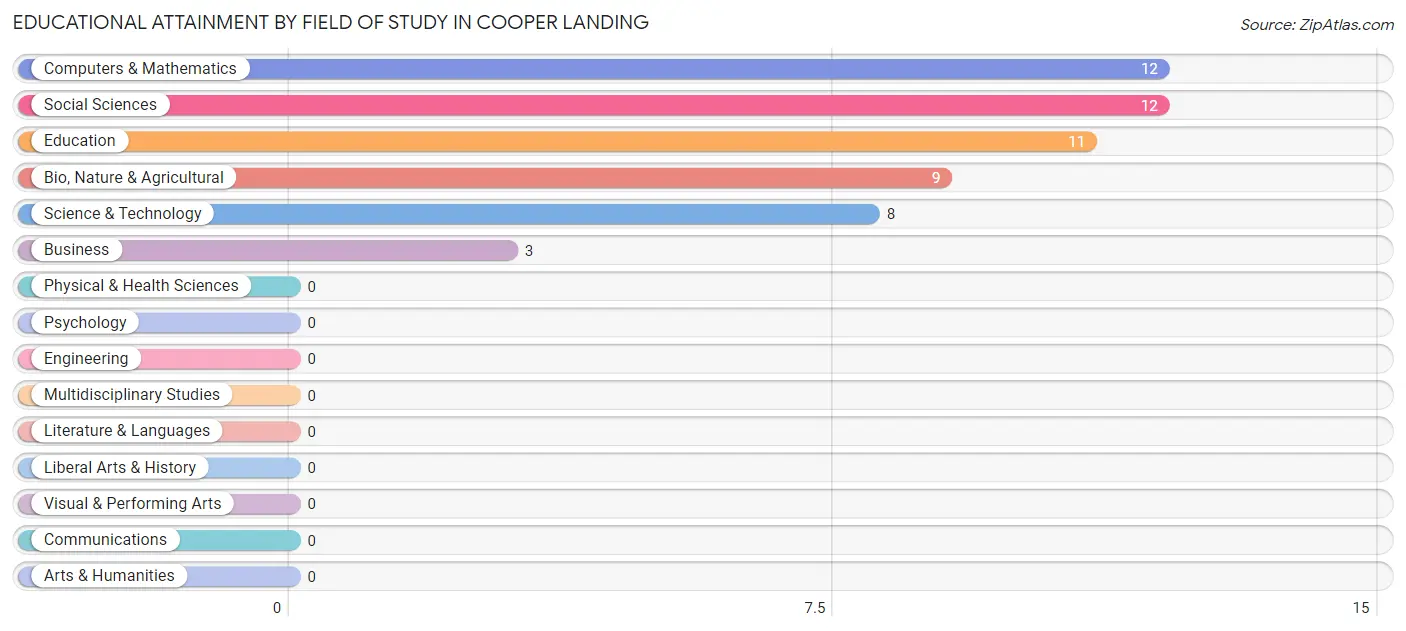
| Field of Study | # Graduates | % Graduates |
| Computers & Mathematics | 12 | 21.8% |
| Bio, Nature & Agricultural | 9 | 16.4% |
| Physical & Health Sciences | 0 | 0.0% |
| Psychology | 0 | 0.0% |
| Social Sciences | 12 | 21.8% |
| Engineering | 0 | 0.0% |
| Multidisciplinary Studies | 0 | 0.0% |
| Science & Technology | 8 | 14.5% |
| Business | 3 | 5.4% |
| Education | 11 | 20.0% |
| Literature & Languages | 0 | 0.0% |
| Liberal Arts & History | 0 | 0.0% |
| Visual & Performing Arts | 0 | 0.0% |
| Communications | 0 | 0.0% |
| Arts & Humanities | 0 | 0.0% |
| Total | 55 | 100.0% |
Transportation & Commute in Cooper Landing
Vehicle Availability by Sex in Cooper Landing
The most prevalent vehicle ownership categories in Cooper Landing are males with 2 vehicles (32, accounting for 62.7%) and females with 2 vehicles (26, making up 123.1%).
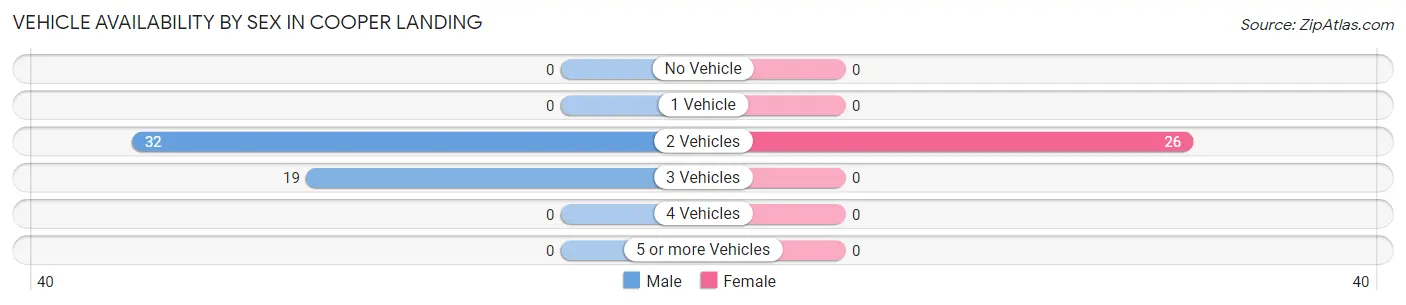
| Vehicles Available | Male | Female |
| No Vehicle | 0 (0.0%) | 0 (0.0%) |
| 1 Vehicle | 0 (0.0%) | 0 (0.0%) |
| 2 Vehicles | 32 (62.7%) | 26 (100.0%) |
| 3 Vehicles | 19 (37.2%) | 0 (0.0%) |
| 4 Vehicles | 0 (0.0%) | 0 (0.0%) |
| 5 or more Vehicles | 0 (0.0%) | 0 (0.0%) |
| Total | 51 (100.0%) | 26 (100.0%) |
Commute Time in Cooper Landing
The most frequently occuring commute durations in Cooper Landing are less than 5 minutes (41 commuters, 65.1%), 15 to 19 minutes (19 commuters, 30.2%), and 5 to 9 minutes (3 commuters, 4.8%).
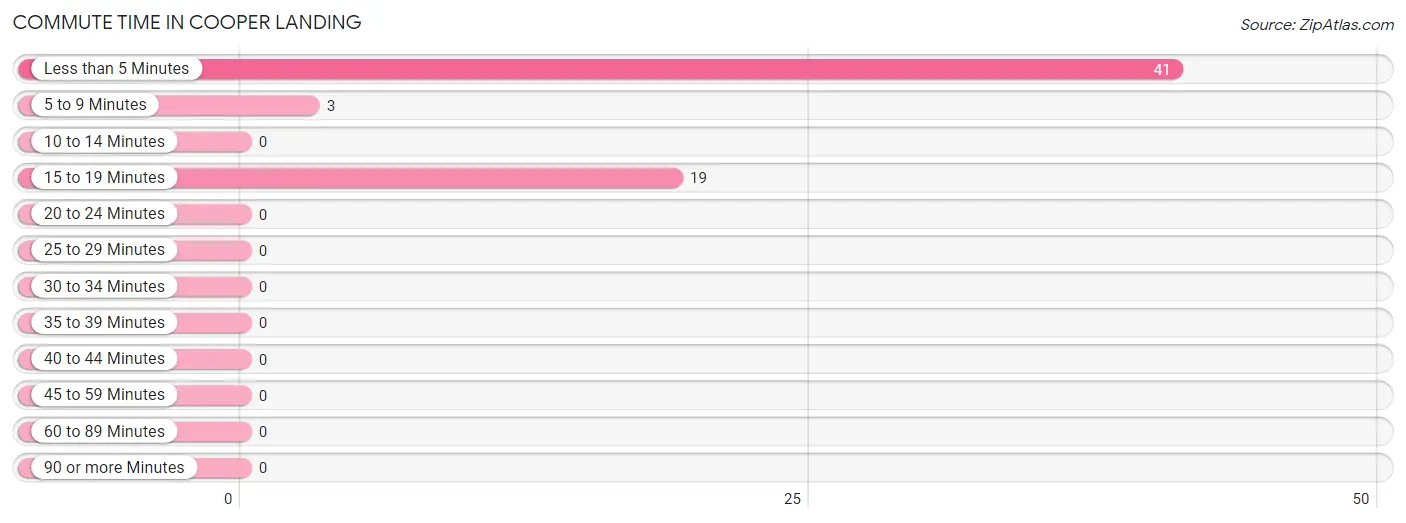
| Commute Time | # Commuters | % Commuters |
| Less than 5 Minutes | 41 | 65.1% |
| 5 to 9 Minutes | 3 | 4.8% |
| 10 to 14 Minutes | 0 | 0.0% |
| 15 to 19 Minutes | 19 | 30.2% |
| 20 to 24 Minutes | 0 | 0.0% |
| 25 to 29 Minutes | 0 | 0.0% |
| 30 to 34 Minutes | 0 | 0.0% |
| 35 to 39 Minutes | 0 | 0.0% |
| 40 to 44 Minutes | 0 | 0.0% |
| 45 to 59 Minutes | 0 | 0.0% |
| 60 to 89 Minutes | 0 | 0.0% |
| 90 or more Minutes | 0 | 0.0% |
Commute Time by Sex in Cooper Landing
The most common commute times in Cooper Landing are less than 5 minutes (24 commuters, 55.8%) for males and less than 5 minutes (17 commuters, 85.0%) for females.

| Commute Time | Male | Female |
| Less than 5 Minutes | 24 (55.8%) | 17 (85.0%) |
| 5 to 9 Minutes | 0 (0.0%) | 3 (15.0%) |
| 10 to 14 Minutes | 0 (0.0%) | 0 (0.0%) |
| 15 to 19 Minutes | 19 (44.2%) | 0 (0.0%) |
| 20 to 24 Minutes | 0 (0.0%) | 0 (0.0%) |
| 25 to 29 Minutes | 0 (0.0%) | 0 (0.0%) |
| 30 to 34 Minutes | 0 (0.0%) | 0 (0.0%) |
| 35 to 39 Minutes | 0 (0.0%) | 0 (0.0%) |
| 40 to 44 Minutes | 0 (0.0%) | 0 (0.0%) |
| 45 to 59 Minutes | 0 (0.0%) | 0 (0.0%) |
| 60 to 89 Minutes | 0 (0.0%) | 0 (0.0%) |
| 90 or more Minutes | 0 (0.0%) | 0 (0.0%) |
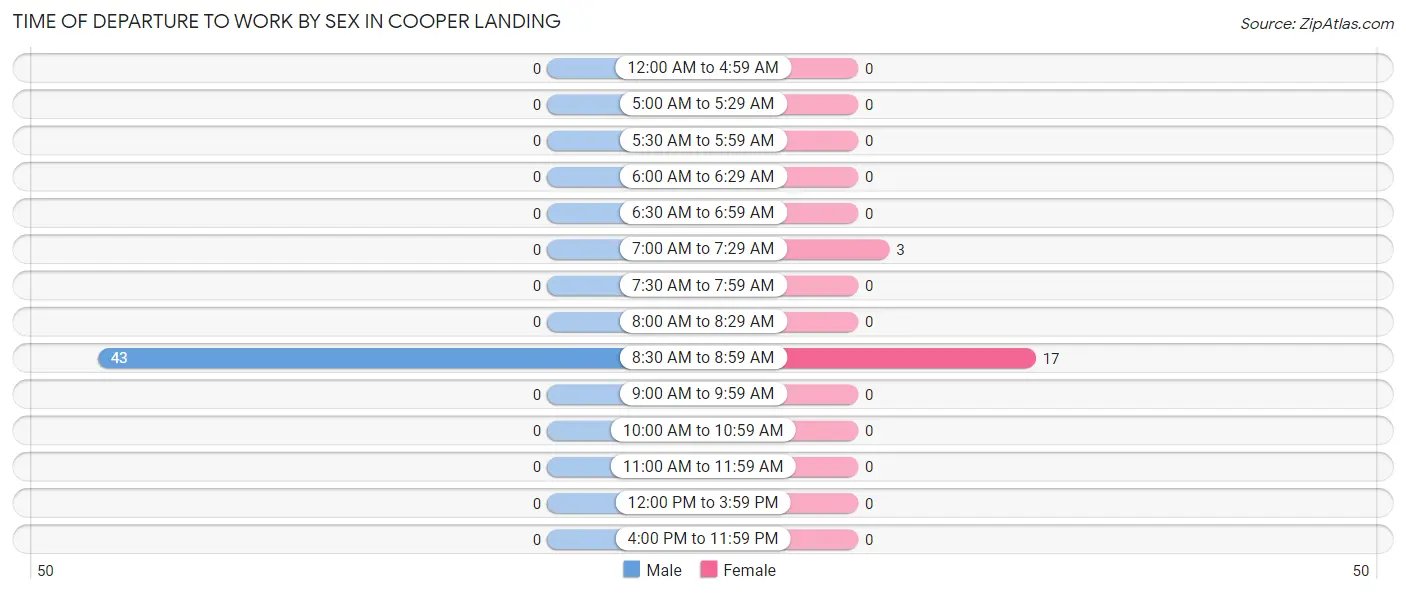
Time of Departure to Work by Sex in Cooper Landing
The most frequent times of departure to work in Cooper Landing are 8:30 AM to 8:59 AM (43, 100.0%) for males and 8:30 AM to 8:59 AM (17, 85.0%) for females.
| Time of Departure | Male | Female |
| 12:00 AM to 4:59 AM | 0 (0.0%) | 0 (0.0%) |
| 5:00 AM to 5:29 AM | 0 (0.0%) | 0 (0.0%) |
| 5:30 AM to 5:59 AM | 0 (0.0%) | 0 (0.0%) |
| 6:00 AM to 6:29 AM | 0 (0.0%) | 0 (0.0%) |
| 6:30 AM to 6:59 AM | 0 (0.0%) | 0 (0.0%) |
| 7:00 AM to 7:29 AM | 0 (0.0%) | 3 (15.0%) |
| 7:30 AM to 7:59 AM | 0 (0.0%) | 0 (0.0%) |
| 8:00 AM to 8:29 AM | 0 (0.0%) | 0 (0.0%) |
| 8:30 AM to 8:59 AM | 43 (100.0%) | 17 (85.0%) |
| 9:00 AM to 9:59 AM | 0 (0.0%) | 0 (0.0%) |
| 10:00 AM to 10:59 AM | 0 (0.0%) | 0 (0.0%) |
| 11:00 AM to 11:59 AM | 0 (0.0%) | 0 (0.0%) |
| 12:00 PM to 3:59 PM | 0 (0.0%) | 0 (0.0%) |
| 4:00 PM to 11:59 PM | 0 (0.0%) | 0 (0.0%) |
| Total | 43 (100.0%) | 20 (100.0%) |
Housing Occupancy in Cooper Landing
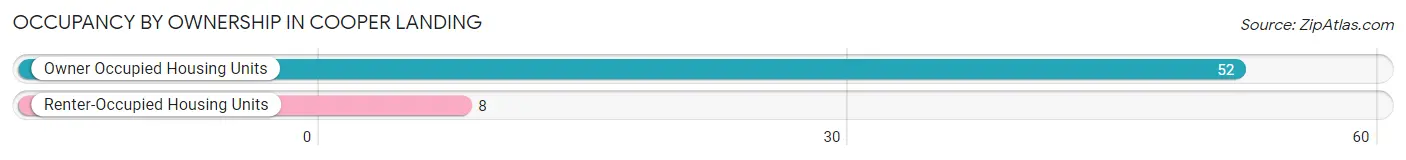
Occupancy by Ownership in Cooper Landing
Of the total 60 dwellings in Cooper Landing, owner-occupied units account for 52 (86.7%), while renter-occupied units make up 8 (13.3%).
| Occupancy | # Housing Units | % Housing Units |
| Owner Occupied Housing Units | 52 | 86.7% |
| Renter-Occupied Housing Units | 8 | 13.3% |
| Total Occupied Housing Units | 60 | 100.0% |
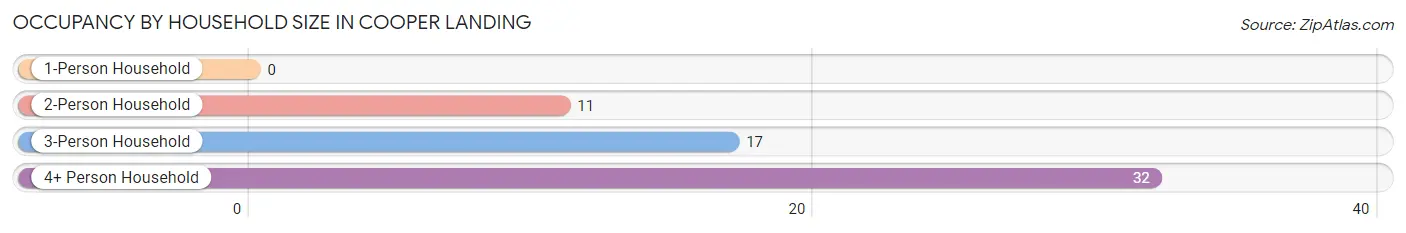
Occupancy by Household Size in Cooper Landing
| Household Size | # Housing Units | % Housing Units |
| 1-Person Household | 0 | 0.0% |
| 2-Person Household | 11 | 18.3% |
| 3-Person Household | 17 | 28.3% |
| 4+ Person Household | 32 | 53.3% |
| Total Housing Units | 60 | 100.0% |
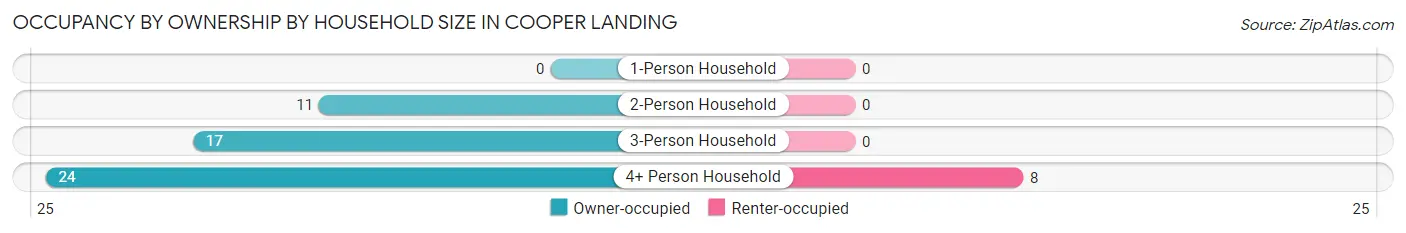
Occupancy by Ownership by Household Size in Cooper Landing
| Household Size | Owner-occupied | Renter-occupied |
| 1-Person Household | 0 (0.0%) | 0 (0.0%) |
| 2-Person Household | 11 (100.0%) | 0 (0.0%) |
| 3-Person Household | 17 (100.0%) | 0 (0.0%) |
| 4+ Person Household | 24 (75.0%) | 8 (25.0%) |
| Total Housing Units | 52 (86.7%) | 8 (13.3%) |
Occupancy by Educational Attainment in Cooper Landing
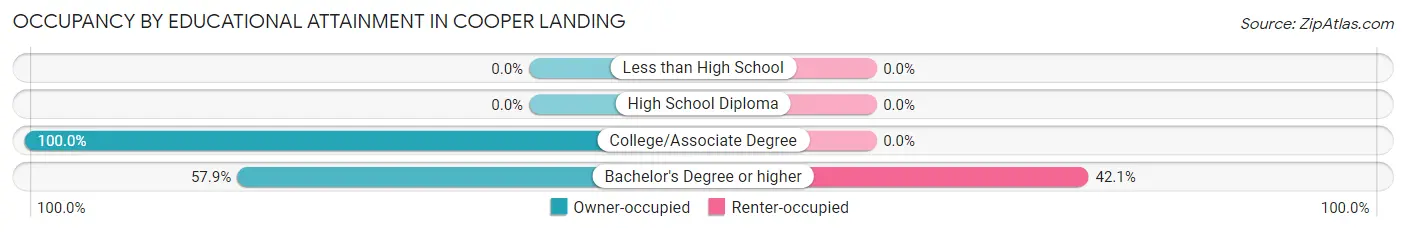
| Household Size | Owner-occupied | Renter-occupied |
| Less than High School | 0 (0.0%) | 0 (0.0%) |
| High School Diploma | 0 (0.0%) | 0 (0.0%) |
| College/Associate Degree | 41 (100.0%) | 0 (0.0%) |
| Bachelor's Degree or higher | 11 (57.9%) | 8 (42.1%) |
Occupancy by Age of Householder in Cooper Landing
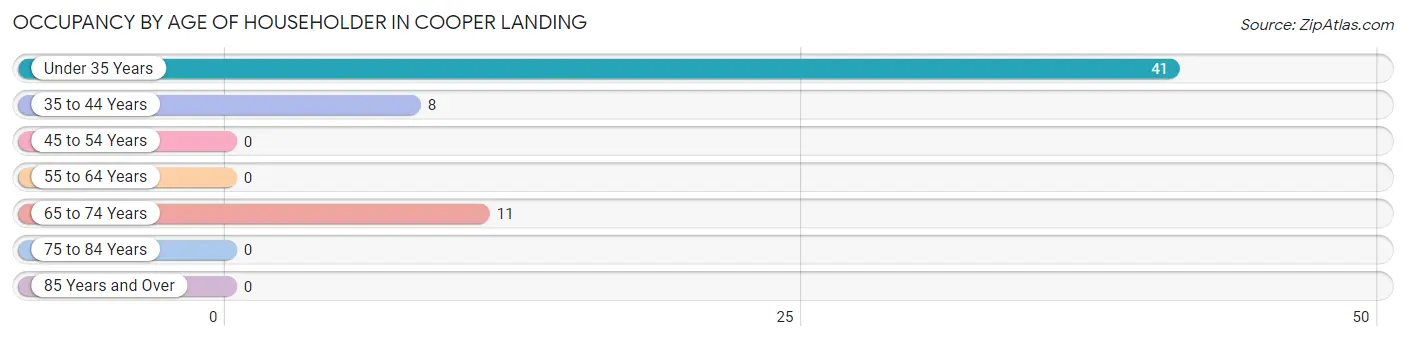
| Age Bracket | # Households | % Households |
| Under 35 Years | 41 | 68.3% |
| 35 to 44 Years | 8 | 13.3% |
| 45 to 54 Years | 0 | 0.0% |
| 55 to 64 Years | 0 | 0.0% |
| 65 to 74 Years | 11 | 18.3% |
| 75 to 84 Years | 0 | 0.0% |
| 85 Years and Over | 0 | 0.0% |
| Total | 60 | 100.0% |
Housing Finances in Cooper Landing
Median Income by Occupancy in Cooper Landing
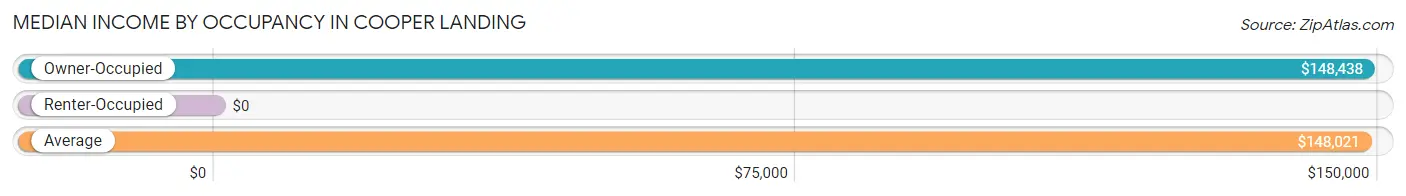
| Occupancy Type | # Households | Median Income |
| Owner-Occupied | 52 (86.7%) | $148,438 |
| Renter-Occupied | 8 (13.3%) | $0 |
| Average | 60 (100.0%) | $148,021 |
Occupancy by Householder Income Bracket in Cooper Landing
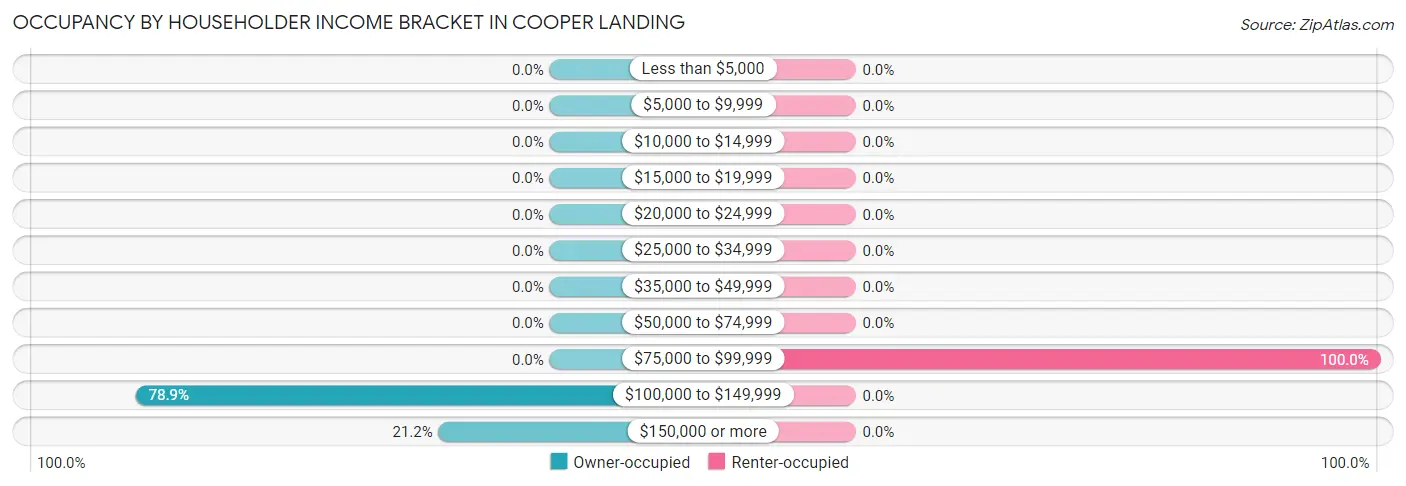
| Income Bracket | Owner-occupied | Renter-occupied |
| Less than $5,000 | 0 (0.0%) | 0 (0.0%) |
| $5,000 to $9,999 | 0 (0.0%) | 0 (0.0%) |
| $10,000 to $14,999 | 0 (0.0%) | 0 (0.0%) |
| $15,000 to $19,999 | 0 (0.0%) | 0 (0.0%) |
| $20,000 to $24,999 | 0 (0.0%) | 0 (0.0%) |
| $25,000 to $34,999 | 0 (0.0%) | 0 (0.0%) |
| $35,000 to $49,999 | 0 (0.0%) | 0 (0.0%) |
| $50,000 to $74,999 | 0 (0.0%) | 0 (0.0%) |
| $75,000 to $99,999 | 0 (0.0%) | 8 (100.0%) |
| $100,000 to $149,999 | 41 (78.8%) | 0 (0.0%) |
| $150,000 or more | 11 (21.1%) | 0 (0.0%) |
| Total | 52 (100.0%) | 8 (100.0%) |
Monthly Housing Cost Tiers in Cooper Landing
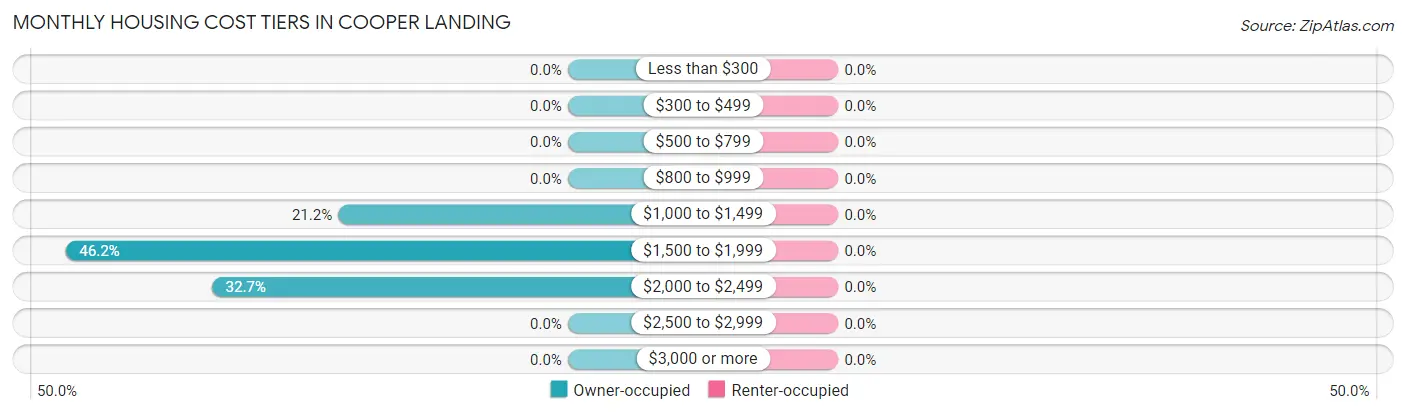
| Monthly Cost | Owner-occupied | Renter-occupied |
| Less than $300 | 0 (0.0%) | 0 (0.0%) |
| $300 to $499 | 0 (0.0%) | 0 (0.0%) |
| $500 to $799 | 0 (0.0%) | 0 (0.0%) |
| $800 to $999 | 0 (0.0%) | 0 (0.0%) |
| $1,000 to $1,499 | 11 (21.1%) | 0 (0.0%) |
| $1,500 to $1,999 | 24 (46.2%) | 0 (0.0%) |
| $2,000 to $2,499 | 17 (32.7%) | 0 (0.0%) |
| $2,500 to $2,999 | 0 (0.0%) | 0 (0.0%) |
| $3,000 or more | 0 (0.0%) | 0 (0.0%) |
| Total | 52 (100.0%) | 8 (100.0%) |
Physical Housing Characteristics in Cooper Landing
Housing Structures in Cooper Landing
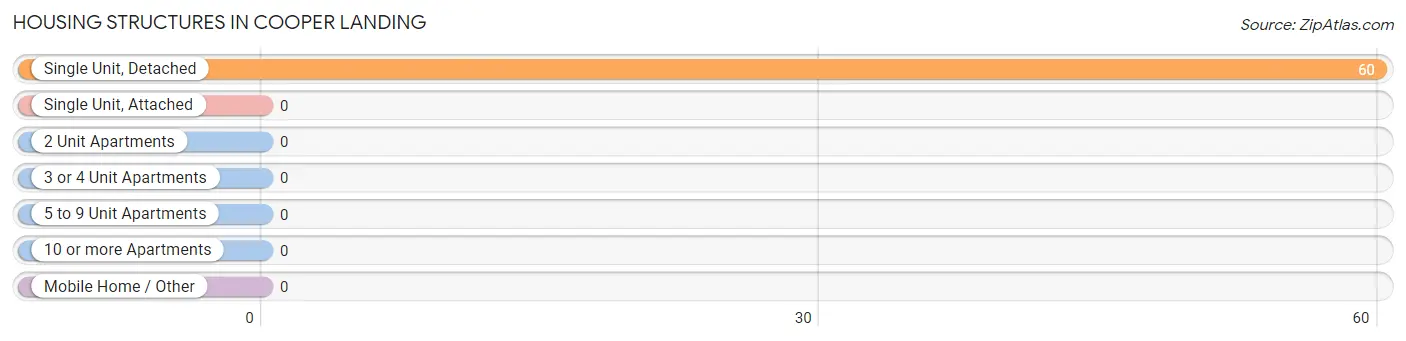
| Structure Type | # Housing Units | % Housing Units |
| Single Unit, Detached | 60 | 100.0% |
| Single Unit, Attached | 0 | 0.0% |
| 2 Unit Apartments | 0 | 0.0% |
| 3 or 4 Unit Apartments | 0 | 0.0% |
| 5 to 9 Unit Apartments | 0 | 0.0% |
| 10 or more Apartments | 0 | 0.0% |
| Mobile Home / Other | 0 | 0.0% |
| Total | 60 | 100.0% |
Housing Structures by Occupancy in Cooper Landing
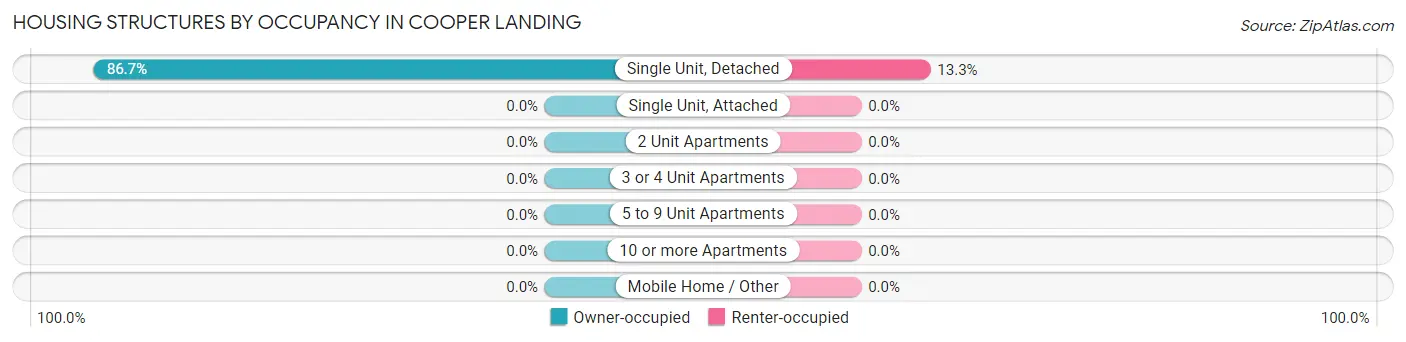
| Structure Type | Owner-occupied | Renter-occupied |
| Single Unit, Detached | 52 (86.7%) | 8 (13.3%) |
| Single Unit, Attached | 0 (0.0%) | 0 (0.0%) |
| 2 Unit Apartments | 0 (0.0%) | 0 (0.0%) |
| 3 or 4 Unit Apartments | 0 (0.0%) | 0 (0.0%) |
| 5 to 9 Unit Apartments | 0 (0.0%) | 0 (0.0%) |
| 10 or more Apartments | 0 (0.0%) | 0 (0.0%) |
| Mobile Home / Other | 0 (0.0%) | 0 (0.0%) |
| Total | 52 (86.7%) | 8 (13.3%) |
Housing Structures by Number of Rooms in Cooper Landing
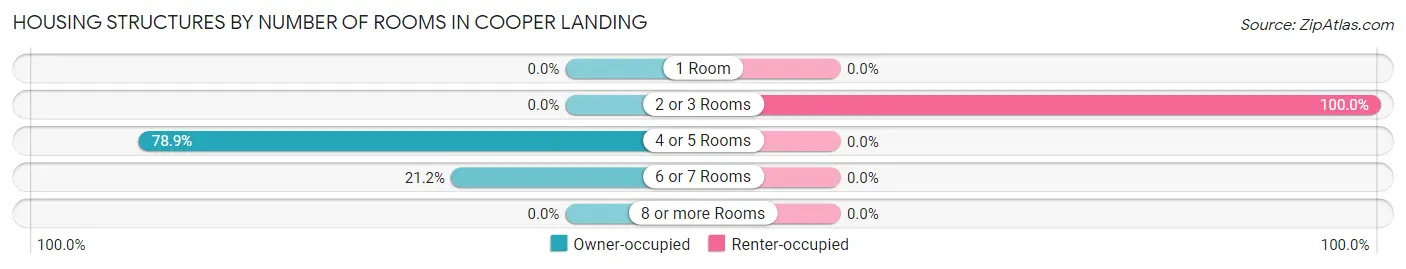
| Number of Rooms | Owner-occupied | Renter-occupied |
| 1 Room | 0 (0.0%) | 0 (0.0%) |
| 2 or 3 Rooms | 0 (0.0%) | 8 (100.0%) |
| 4 or 5 Rooms | 41 (78.8%) | 0 (0.0%) |
| 6 or 7 Rooms | 11 (21.1%) | 0 (0.0%) |
| 8 or more Rooms | 0 (0.0%) | 0 (0.0%) |
| Total | 52 (100.0%) | 8 (100.0%) |
Housing Structure by Heating Type in Cooper Landing
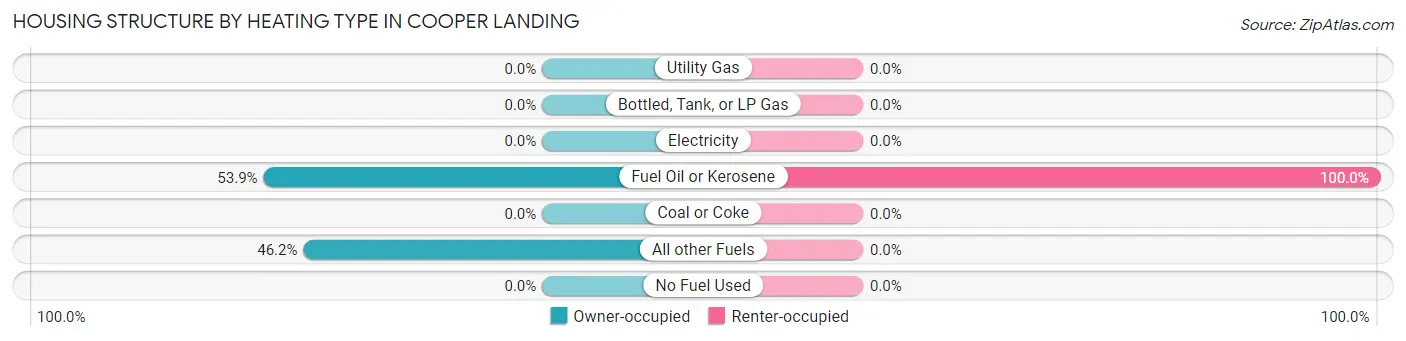
| Heating Type | Owner-occupied | Renter-occupied |
| Utility Gas | 0 (0.0%) | 0 (0.0%) |
| Bottled, Tank, or LP Gas | 0 (0.0%) | 0 (0.0%) |
| Electricity | 0 (0.0%) | 0 (0.0%) |
| Fuel Oil or Kerosene | 28 (53.8%) | 8 (100.0%) |
| Coal or Coke | 0 (0.0%) | 0 (0.0%) |
| All other Fuels | 24 (46.2%) | 0 (0.0%) |
| No Fuel Used | 0 (0.0%) | 0 (0.0%) |
| Total | 52 (100.0%) | 8 (100.0%) |
Household Vehicle Usage in Cooper Landing
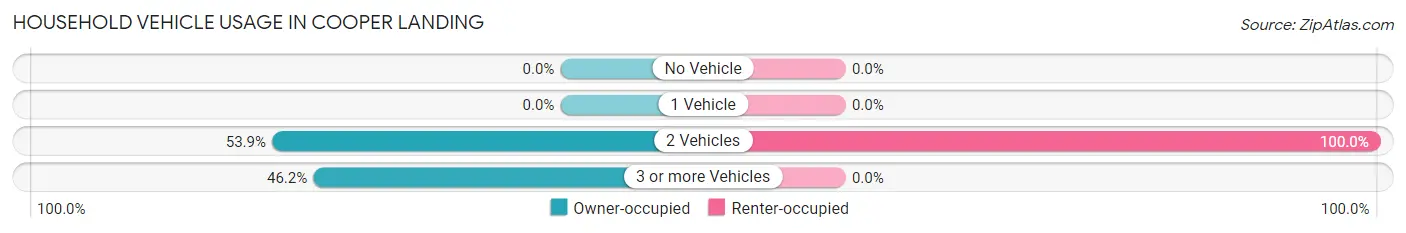
| Vehicles per Household | Owner-occupied | Renter-occupied |
| No Vehicle | 0 (0.0%) | 0 (0.0%) |
| 1 Vehicle | 0 (0.0%) | 0 (0.0%) |
| 2 Vehicles | 28 (53.8%) | 8 (100.0%) |
| 3 or more Vehicles | 24 (46.2%) | 0 (0.0%) |
| Total | 52 (100.0%) | 8 (100.0%) |
Real Estate & Mortgages in Cooper Landing
Real Estate and Mortgage Overview in Cooper Landing
| Characteristic | Without Mortgage | With Mortgage |
| Housing Units | 11 | 41 |
| Median Property Value | - | - |
| Median Household Income | - | - |
| Monthly Housing Costs | - | - |
| Real Estate Taxes | - | - |
Property Value by Mortgage Status in Cooper Landing
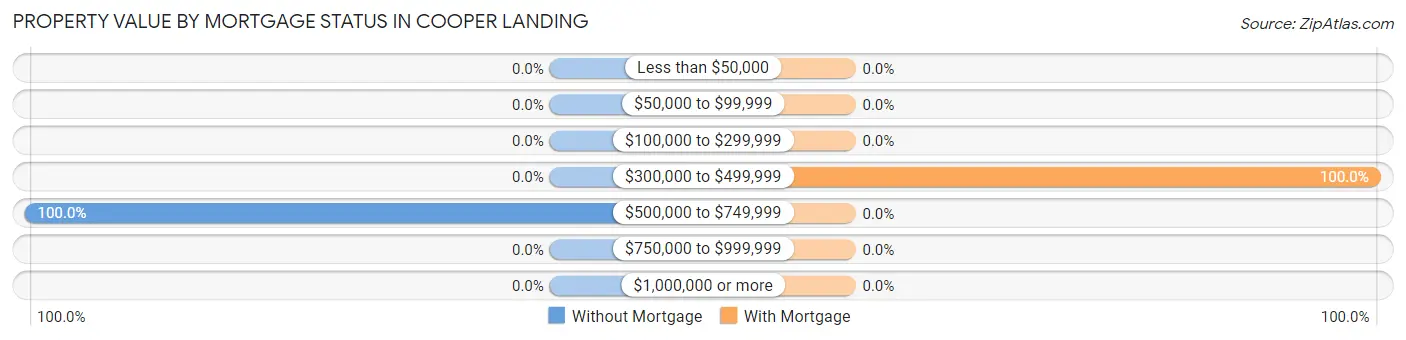
| Property Value | Without Mortgage | With Mortgage |
| Less than $50,000 | 0 (0.0%) | 0 (0.0%) |
| $50,000 to $99,999 | 0 (0.0%) | 0 (0.0%) |
| $100,000 to $299,999 | 0 (0.0%) | 0 (0.0%) |
| $300,000 to $499,999 | 0 (0.0%) | 41 (100.0%) |
| $500,000 to $749,999 | 11 (100.0%) | 0 (0.0%) |
| $750,000 to $999,999 | 0 (0.0%) | 0 (0.0%) |
| $1,000,000 or more | 0 (0.0%) | 0 (0.0%) |
| Total | 11 (100.0%) | 41 (100.0%) |
Household Income by Mortgage Status in Cooper Landing
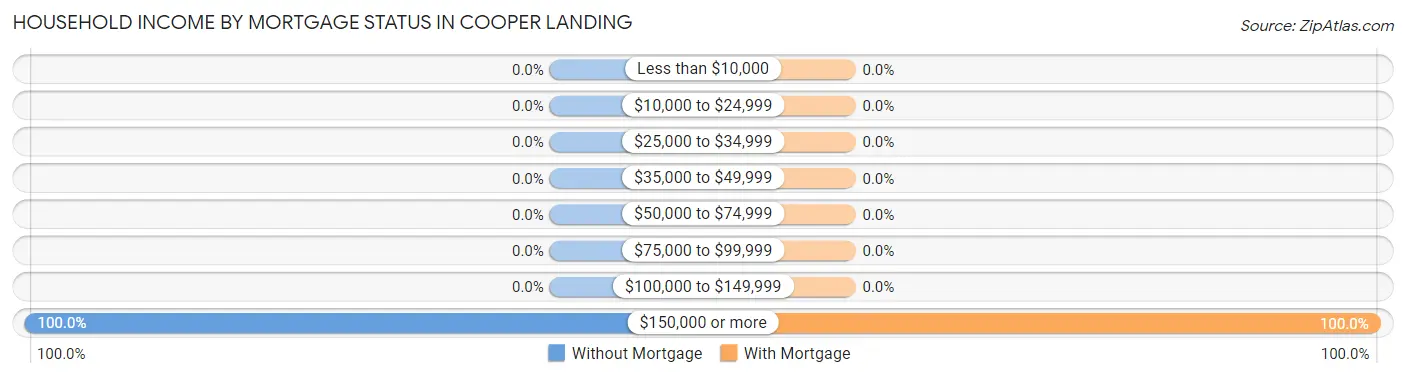
| Household Income | Without Mortgage | With Mortgage |
| Less than $10,000 | 0 (0.0%) | 0 (0.0%) |
| $10,000 to $24,999 | 0 (0.0%) | 0 (0.0%) |
| $25,000 to $34,999 | 0 (0.0%) | 0 (0.0%) |
| $35,000 to $49,999 | 0 (0.0%) | 0 (0.0%) |
| $50,000 to $74,999 | 0 (0.0%) | 0 (0.0%) |
| $75,000 to $99,999 | 0 (0.0%) | 0 (0.0%) |
| $100,000 to $149,999 | 0 (0.0%) | 0 (0.0%) |
| $150,000 or more | 11 (100.0%) | 41 (100.0%) |
| Total | 11 (100.0%) | 41 (100.0%) |
Property Value to Household Income Ratio in Cooper Landing
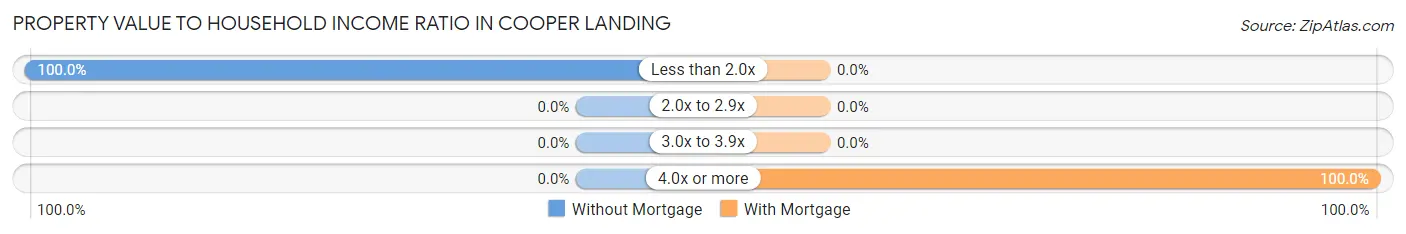
| Value-to-Income Ratio | Without Mortgage | With Mortgage |
| Less than 2.0x | 11 (100.0%) | 0 (0.0%) |
| 2.0x to 2.9x | 0 (0.0%) | 0 (0.0%) |
| 3.0x to 3.9x | 0 (0.0%) | 0 (0.0%) |
| 4.0x or more | 0 (0.0%) | 41 (100.0%) |
| Total | 11 (100.0%) | 41 (100.0%) |
Real Estate Taxes by Mortgage Status in Cooper Landing
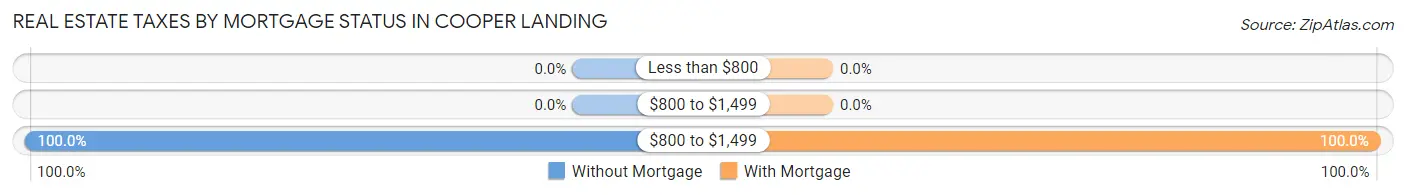
| Property Taxes | Without Mortgage | With Mortgage |
| Less than $800 | 0 (0.0%) | 0 (0.0%) |
| $800 to $1,499 | 0 (0.0%) | 0 (0.0%) |
| $800 to $1,499 | 11 (100.0%) | 41 (100.0%) |
| Total | 11 (100.0%) | 41 (100.0%) |
Health & Disability in Cooper Landing
Health Insurance Coverage by Age in Cooper Landing
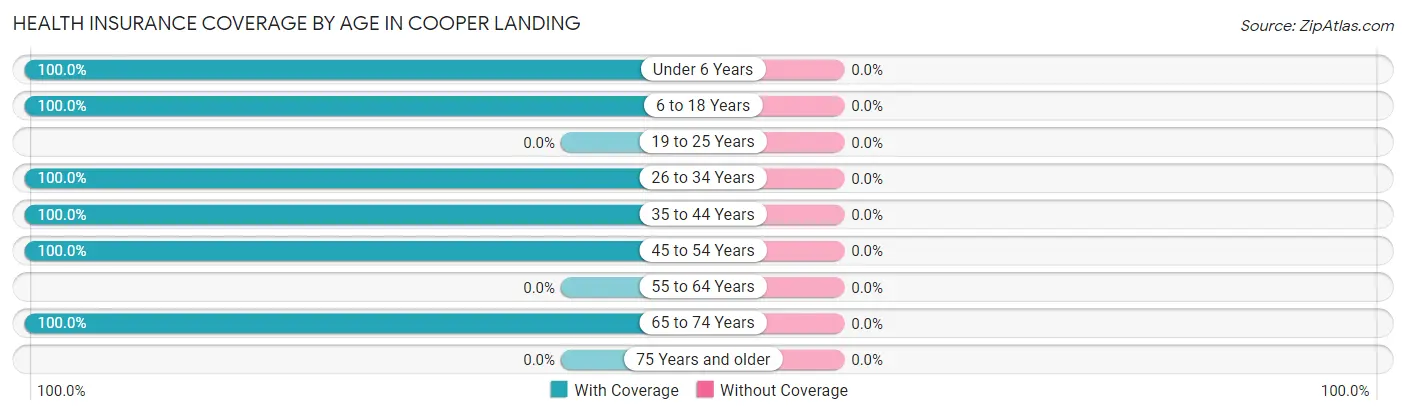
| Age Bracket | With Coverage | Without Coverage |
| Under 6 Years | 80 (100.0%) | 0 (0.0%) |
| 6 to 18 Years | 17 (100.0%) | 0 (0.0%) |
| 19 to 25 Years | 0 (0.0%) | 0 (0.0%) |
| 26 to 34 Years | 41 (100.0%) | 0 (0.0%) |
| 35 to 44 Years | 44 (100.0%) | 0 (0.0%) |
| 45 to 54 Years | 19 (100.0%) | 0 (0.0%) |
| 55 to 64 Years | 0 (0.0%) | 0 (0.0%) |
| 65 to 74 Years | 23 (100.0%) | 0 (0.0%) |
| 75 Years and older | 0 (0.0%) | 0 (0.0%) |
| Total | 224 (100.0%) | 0 (0.0%) |
Health Insurance Coverage by Citizenship Status in Cooper Landing
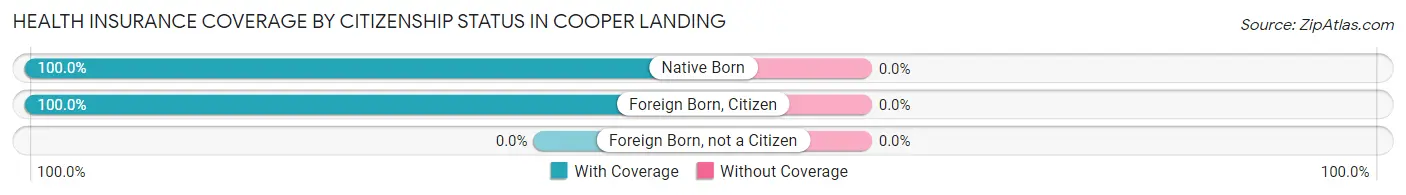
| Citizenship Status | With Coverage | Without Coverage |
| Native Born | 80 (100.0%) | 0 (0.0%) |
| Foreign Born, Citizen | 17 (100.0%) | 0 (0.0%) |
| Foreign Born, not a Citizen | 0 (0.0%) | 0 (0.0%) |
Health Insurance Coverage by Household Income in Cooper Landing
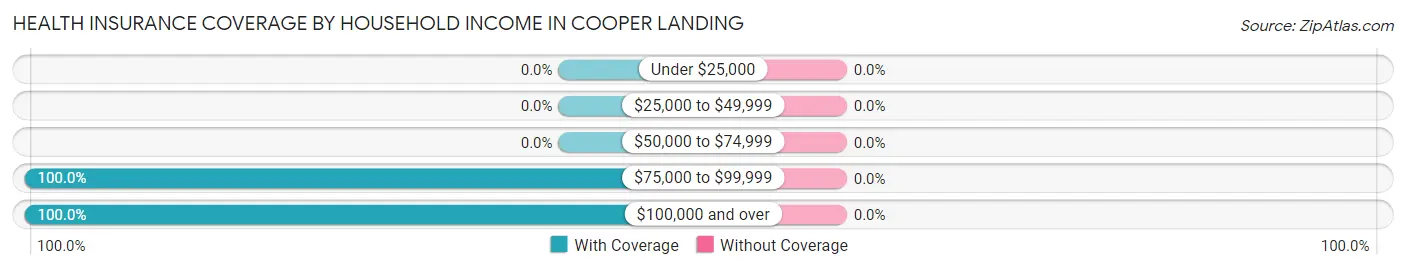
| Household Income | With Coverage | Without Coverage |
| Under $25,000 | 0 (0.0%) | 0 (0.0%) |
| $25,000 to $49,999 | 0 (0.0%) | 0 (0.0%) |
| $50,000 to $74,999 | 0 (0.0%) | 0 (0.0%) |
| $75,000 to $99,999 | 42 (100.0%) | 0 (0.0%) |
| $100,000 and over | 179 (100.0%) | 0 (0.0%) |
Public vs Private Health Insurance Coverage by Age in Cooper Landing
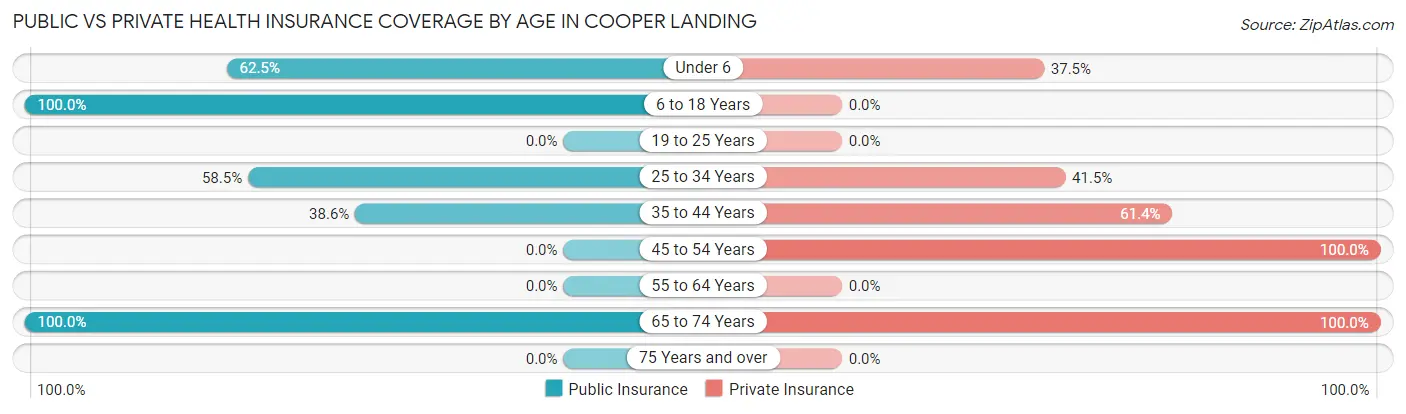
| Age Bracket | Public Insurance | Private Insurance |
| Under 6 | 50 (62.5%) | 30 (37.5%) |
| 6 to 18 Years | 17 (100.0%) | 0 (0.0%) |
| 19 to 25 Years | 0 (0.0%) | 0 (0.0%) |
| 25 to 34 Years | 24 (58.5%) | 17 (41.5%) |
| 35 to 44 Years | 17 (38.6%) | 27 (61.4%) |
| 45 to 54 Years | 0 (0.0%) | 19 (100.0%) |
| 55 to 64 Years | 0 (0.0%) | 0 (0.0%) |
| 65 to 74 Years | 23 (100.0%) | 23 (100.0%) |
| 75 Years and over | 0 (0.0%) | 0 (0.0%) |
| Total | 131 (58.5%) | 116 (51.8%) |
Disability Status by Sex by Age in Cooper Landing
| Age Bracket | Male | Female |
| Under 5 Years | 0 (0.0%) | 0 (0.0%) |
| 5 to 17 Years | 0 (0.0%) | 0 (0.0%) |
| 18 to 34 Years | 0 (0.0%) | 0 (0.0%) |
| 35 to 64 Years | 0 (0.0%) | 0 (0.0%) |
| 65 to 74 Years | 0 (0.0%) | 0 (0.0%) |
| 75 Years and over | 0 (0.0%) | 0 (0.0%) |
Disability Class by Sex by Age in Cooper Landing
Disability Class: Hearing Difficulty
| Age Bracket | Male | Female |
| Under 5 Years | 0 (0.0%) | 0 (0.0%) |
| 5 to 17 Years | 0 (0.0%) | 0 (0.0%) |
| 18 to 34 Years | 0 (0.0%) | 0 (0.0%) |
| 35 to 64 Years | 0 (0.0%) | 0 (0.0%) |
| 65 to 74 Years | 0 (0.0%) | 0 (0.0%) |
| 75 Years and over | 0 (0.0%) | 0 (0.0%) |
Disability Class: Vision Difficulty
| Age Bracket | Male | Female |
| Under 5 Years | 0 (0.0%) | 0 (0.0%) |
| 5 to 17 Years | 0 (0.0%) | 0 (0.0%) |
| 18 to 34 Years | 0 (0.0%) | 0 (0.0%) |
| 35 to 64 Years | 0 (0.0%) | 0 (0.0%) |
| 65 to 74 Years | 0 (0.0%) | 0 (0.0%) |
| 75 Years and over | 0 (0.0%) | 0 (0.0%) |
Disability Class: Cognitive Difficulty
| Age Bracket | Male | Female |
| 5 to 17 Years | 0 (0.0%) | 0 (0.0%) |
| 18 to 34 Years | 0 (0.0%) | 0 (0.0%) |
| 35 to 64 Years | 0 (0.0%) | 0 (0.0%) |
| 65 to 74 Years | 0 (0.0%) | 0 (0.0%) |
| 75 Years and over | 0 (0.0%) | 0 (0.0%) |
Disability Class: Ambulatory Difficulty
| Age Bracket | Male | Female |
| 5 to 17 Years | 0 (0.0%) | 0 (0.0%) |
| 18 to 34 Years | 0 (0.0%) | 0 (0.0%) |
| 35 to 64 Years | 0 (0.0%) | 0 (0.0%) |
| 65 to 74 Years | 0 (0.0%) | 0 (0.0%) |
| 75 Years and over | 0 (0.0%) | 0 (0.0%) |
Disability Class: Self-Care Difficulty
| Age Bracket | Male | Female |
| 5 to 17 Years | 0 (0.0%) | 0 (0.0%) |
| 18 to 34 Years | 0 (0.0%) | 0 (0.0%) |
| 35 to 64 Years | 0 (0.0%) | 0 (0.0%) |
| 65 to 74 Years | 0 (0.0%) | 0 (0.0%) |
| 75 Years and over | 0 (0.0%) | 0 (0.0%) |
Technology Access in Cooper Landing
Computing Device Access in Cooper Landing
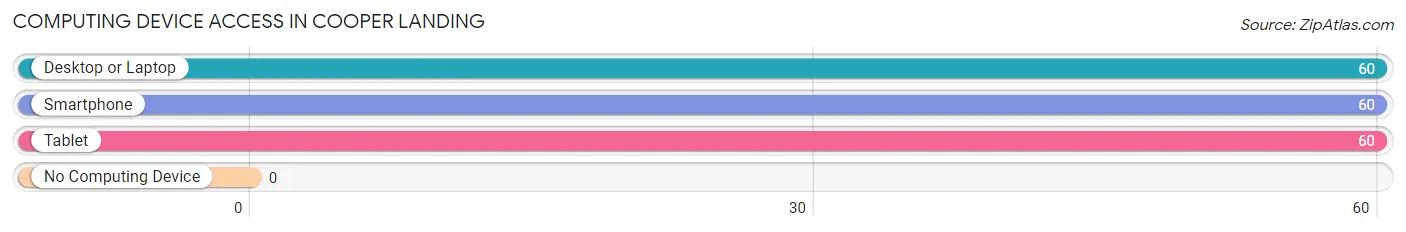
| Device Type | # Households | % Households |
| Desktop or Laptop | 60 | 100.0% |
| Smartphone | 60 | 100.0% |
| Tablet | 60 | 100.0% |
| No Computing Device | 0 | 0.0% |
| Total | 60 | 100.0% |
Internet Access in Cooper Landing
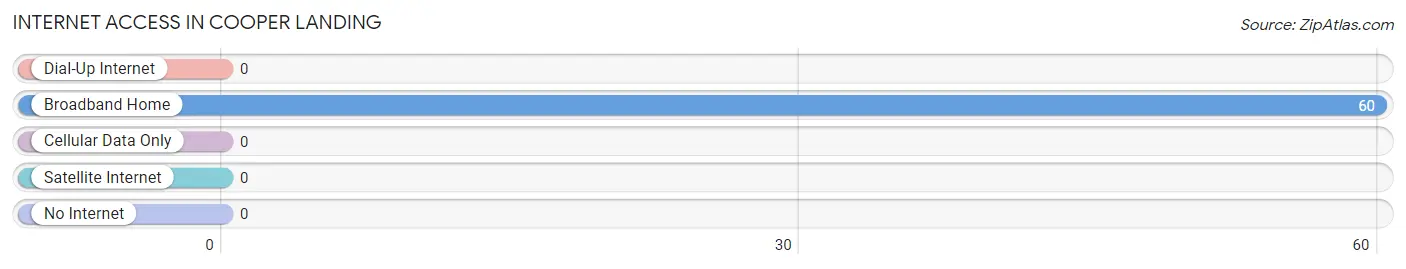
| Internet Type | # Households | % Households |
| Dial-Up Internet | 0 | 0.0% |
| Broadband Home | 60 | 100.0% |
| Cellular Data Only | 0 | 0.0% |
| Satellite Internet | 0 | 0.0% |
| No Internet | 0 | 0.0% |
| Total | 60 | 100.0% |
Cooper Landing Summary
Cooper Landing is a small unincorporated community located in the Kenai Peninsula Borough of Alaska. It is situated at the confluence of the Kenai and Russian Rivers, approximately 75 miles south of Anchorage. The community is named after Joseph Cooper, an early settler who established a trading post in the area in the late 1800s.
History
The area around Cooper Landing has been inhabited by the Dena’ina Athabascan people for thousands of years. The Dena’ina people were semi-nomadic, living off the land and fishing in the rivers. In the late 1800s, the area was explored by Russian fur traders and gold prospectors. In 1891, Joseph Cooper established a trading post in the area, which became the nucleus of the present-day community.
In the early 1900s, the area was settled by homesteaders, who established farms and ranches. The community was connected to the outside world by the Alaska Railroad in 1915. In the 1950s, the area was developed for tourism, and the first lodge was built in Cooper Landing in 1954.
Geography
Cooper Landing is located in the Kenai Peninsula Borough of Alaska, approximately 75 miles south of Anchorage. It is situated at the confluence of the Kenai and Russian Rivers, at an elevation of approximately 300 feet. The area is surrounded by mountains, including the Kenai Mountains to the east and the Chugach Mountains to the west. The climate is mild, with temperatures ranging from the mid-30s in the winter to the mid-60s in the summer.
Economy
The economy of Cooper Landing is largely based on tourism. The area is a popular destination for fishing, hiking, and camping. There are several lodges and resorts in the area, as well as a number of restaurants and shops. The community is also home to several small businesses, including a general store, a gas station, and a post office.
Demographics
As of the 2010 census, the population of Cooper Landing was 545. The racial makeup of the community was 95.3% White, 0.7% Native American, 0.4% Asian, 0.2% Pacific Islander, and 3.4% from other races. The median household income was $50,000, and the median age was 44.
Cooper Landing is a small, rural community with a strong sense of community. The area is known for its natural beauty and outdoor recreation opportunities, and is a popular destination for tourists and outdoor enthusiasts.
Common Questions
What is Per Capita Income in Cooper Landing?
Per Capita income in Cooper Landing is $47,029.
What is the Median Family Income in Cooper Landing?
Median Family Income in Cooper Landing is $148,021.
What is the Median Household income in Cooper Landing?
Median Household Income in Cooper Landing is $148,021.
What is Income or Wage Gap in Cooper Landing?
Income or Wage Gap in Cooper Landing is 46.9%.
Women in Cooper Landing earn 53.1 cents for every dollar earned by a man.
What is Inequality or Gini Index in Cooper Landing?
Inequality or Gini Index in Cooper Landing is 0.25.
What is the Total Population of Cooper Landing?
Total Population of Cooper Landing is 224.
What is the Total Male Population of Cooper Landing?
Total Male Population of Cooper Landing is 132.
What is the Total Female Population of Cooper Landing?
Total Female Population of Cooper Landing is 92.
What is the Ratio of Males per 100 Females in Cooper Landing?
There are 143.48 Males per 100 Females in Cooper Landing.
What is the Ratio of Females per 100 Males in Cooper Landing?
There are 69.70 Females per 100 Males in Cooper Landing.
What is the Median Population Age in Cooper Landing?
Median Population Age in Cooper Landing is 28.9 Years.
What is the Average Family Size in Cooper Landing
Average Family Size in Cooper Landing is 3.7 People.
What is the Average Household Size in Cooper Landing
Average Household Size in Cooper Landing is 3.7 People.
How Large is the Labor Force in Cooper Landing?
There are 104 People in the Labor Forcein in Cooper Landing.
What is the Percentage of People in the Labor Force in Cooper Landing?
81.9% of People are in the Labor Force in Cooper Landing.