Zimbabwean vs Immigrants from Germany No Vehicles in Household
COMPARE
Zimbabwean
Immigrants from Germany
No Vehicles in Household
No Vehicles in Household Comparison
Zimbabweans
Immigrants from Germany
9.0%
NO VEHICLES IN HOUSEHOLD
98.0/ 100
METRIC RATING
104th/ 347
METRIC RANK
8.7%
NO VEHICLES IN HOUSEHOLD
99.1/ 100
METRIC RATING
91st/ 347
METRIC RANK
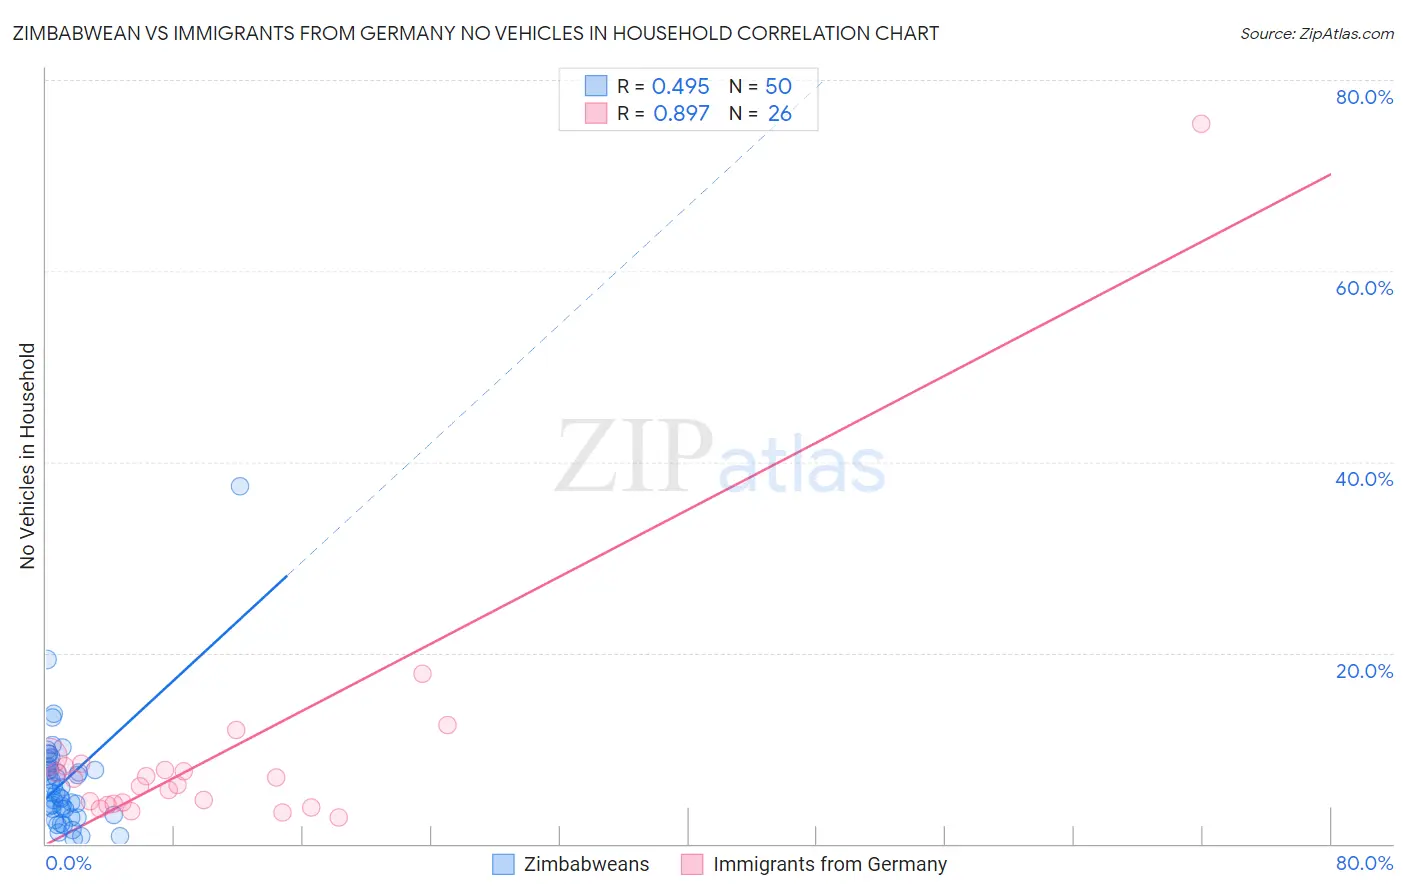
Zimbabwean vs Immigrants from Germany No Vehicles in Household Correlation Chart
The statistical analysis conducted on geographies consisting of 69,183,978 people shows a moderate positive correlation between the proportion of Zimbabweans and percentage of households with no vehicle available in the United States with a correlation coefficient (R) of 0.495 and weighted average of 9.0%. Similarly, the statistical analysis conducted on geographies consisting of 462,346,961 people shows a very strong positive correlation between the proportion of Immigrants from Germany and percentage of households with no vehicle available in the United States with a correlation coefficient (R) of 0.897 and weighted average of 8.7%, a difference of 3.5%.
No Vehicles in Household Correlation Summary
| Measurement | Zimbabwean | Immigrants from Germany |
| Minimum | 0.49% | 2.8% |
| Maximum | 37.5% | 75.4% |
| Range | 37.0% | 72.6% |
| Mean | 6.6% | 9.4% |
| Median | 5.6% | 6.4% |
| Interquartile 25% (IQ1) | 3.6% | 4.2% |
| Interquartile 75% (IQ3) | 8.1% | 8.1% |
| Interquartile Range (IQR) | 4.5% | 3.9% |
| Standard Deviation (Sample) | 5.8% | 13.9% |
| Standard Deviation (Population) | 5.7% | 13.6% |
Demographics Similar to Zimbabweans and Immigrants from Germany by No Vehicles in Household
In terms of no vehicles in household, the demographic groups most similar to Zimbabweans are Spanish American (9.1%, a difference of 0.16%), Laotian (9.1%, a difference of 0.25%), Hispanic or Latino (9.1%, a difference of 0.52%), Seminole (9.0%, a difference of 0.63%), and Yugoslavian (9.0%, a difference of 0.64%). Similarly, the demographic groups most similar to Immigrants from Germany are Immigrants from Canada (8.7%, a difference of 0.030%), Immigrants from North America (8.7%, a difference of 0.17%), Bhutanese (8.7%, a difference of 0.19%), Immigrants from Cuba (8.7%, a difference of 0.28%), and Osage (8.7%, a difference of 0.42%).
| Demographics | Rating | Rank | No Vehicles in Household |
| Immigrants | England | 99.2 /100 | #87 | Exceptional 8.7% |
| Osage | 99.2 /100 | #88 | Exceptional 8.7% |
| Immigrants | Cuba | 99.2 /100 | #89 | Exceptional 8.7% |
| Bhutanese | 99.2 /100 | #90 | Exceptional 8.7% |
| Immigrants | Germany | 99.1 /100 | #91 | Exceptional 8.7% |
| Immigrants | Canada | 99.1 /100 | #92 | Exceptional 8.7% |
| Immigrants | North America | 99.1 /100 | #93 | Exceptional 8.7% |
| Austrians | 98.9 /100 | #94 | Exceptional 8.8% |
| Potawatomi | 98.8 /100 | #95 | Exceptional 8.8% |
| Immigrants | Bolivia | 98.7 /100 | #96 | Exceptional 8.9% |
| Immigrants | Central America | 98.5 /100 | #97 | Exceptional 8.9% |
| Slavs | 98.4 /100 | #98 | Exceptional 9.0% |
| Bulgarians | 98.4 /100 | #99 | Exceptional 9.0% |
| Asians | 98.3 /100 | #100 | Exceptional 9.0% |
| Pakistanis | 98.3 /100 | #101 | Exceptional 9.0% |
| Yugoslavians | 98.3 /100 | #102 | Exceptional 9.0% |
| Seminole | 98.3 /100 | #103 | Exceptional 9.0% |
| Zimbabweans | 98.0 /100 | #104 | Exceptional 9.0% |
| Spanish Americans | 97.9 /100 | #105 | Exceptional 9.1% |
| Laotians | 97.8 /100 | #106 | Exceptional 9.1% |
| Hispanics or Latinos | 97.7 /100 | #107 | Exceptional 9.1% |