Immigrants from Uganda vs Immigrants from Germany No Vehicles in Household
COMPARE
Immigrants from Uganda
Immigrants from Germany
No Vehicles in Household
No Vehicles in Household Comparison
Immigrants from Uganda
Immigrants from Germany
10.0%
NO VEHICLES IN HOUSEHOLD
76.1/ 100
METRIC RATING
149th/ 347
METRIC RANK
8.7%
NO VEHICLES IN HOUSEHOLD
99.1/ 100
METRIC RATING
91st/ 347
METRIC RANK
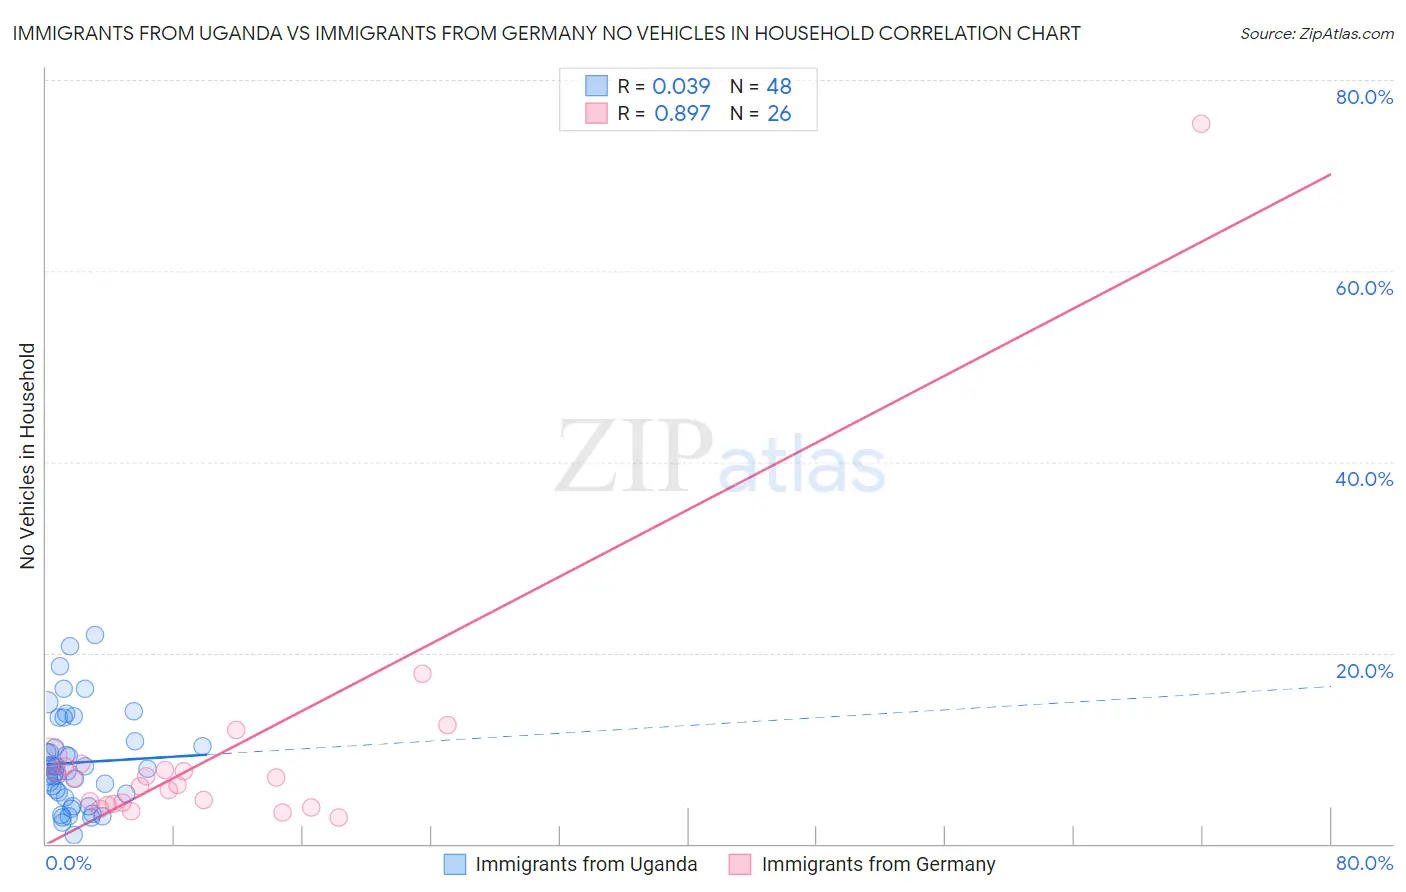
Immigrants from Uganda vs Immigrants from Germany No Vehicles in Household Correlation Chart
The statistical analysis conducted on geographies consisting of 125,911,604 people shows no correlation between the proportion of Immigrants from Uganda and percentage of households with no vehicle available in the United States with a correlation coefficient (R) of 0.039 and weighted average of 10.0%. Similarly, the statistical analysis conducted on geographies consisting of 462,346,961 people shows a very strong positive correlation between the proportion of Immigrants from Germany and percentage of households with no vehicle available in the United States with a correlation coefficient (R) of 0.897 and weighted average of 8.7%, a difference of 14.5%.
No Vehicles in Household Correlation Summary
| Measurement | Immigrants from Uganda | Immigrants from Germany |
| Minimum | 0.97% | 2.8% |
| Maximum | 21.9% | 75.4% |
| Range | 20.9% | 72.6% |
| Mean | 8.5% | 9.4% |
| Median | 7.7% | 6.4% |
| Interquartile 25% (IQ1) | 5.0% | 4.2% |
| Interquartile 75% (IQ3) | 10.5% | 8.1% |
| Interquartile Range (IQR) | 5.5% | 3.9% |
| Standard Deviation (Sample) | 4.9% | 13.9% |
| Standard Deviation (Population) | 4.9% | 13.6% |
Similar Demographics by No Vehicles in Household
Demographics Similar to Immigrants from Uganda by No Vehicles in Household
In terms of no vehicles in household, the demographic groups most similar to Immigrants from Uganda are Colombian (10.0%, a difference of 0.41%), Immigrants from Eastern Africa (10.0%, a difference of 0.42%), Immigrants from Congo (10.1%, a difference of 0.56%), Immigrants from Bosnia and Herzegovina (9.9%, a difference of 0.62%), and Tlingit-Haida (10.1%, a difference of 0.65%).
| Demographics | Rating | Rank | No Vehicles in Household |
| Immigrants | Zimbabwe | 82.6 /100 | #142 | Excellent 9.9% |
| Chileans | 81.2 /100 | #143 | Excellent 9.9% |
| Immigrants | Bahamas | 81.2 /100 | #144 | Excellent 9.9% |
| Bahamians | 81.0 /100 | #145 | Excellent 9.9% |
| Hungarians | 80.0 /100 | #146 | Excellent 9.9% |
| Immigrants | Nicaragua | 79.8 /100 | #147 | Good 9.9% |
| Immigrants | Bosnia and Herzegovina | 79.1 /100 | #148 | Good 9.9% |
| Immigrants | Uganda | 76.1 /100 | #149 | Good 10.0% |
| Colombians | 73.9 /100 | #150 | Good 10.0% |
| Immigrants | Eastern Africa | 73.8 /100 | #151 | Good 10.0% |
| Immigrants | Congo | 73.0 /100 | #152 | Good 10.1% |
| Tlingit-Haida | 72.5 /100 | #153 | Good 10.1% |
| Sioux | 72.4 /100 | #154 | Good 10.1% |
| Salvadorans | 72.4 /100 | #155 | Good 10.1% |
| Immigrants | Micronesia | 70.9 /100 | #156 | Good 10.1% |
Demographics Similar to Immigrants from Germany by No Vehicles in Household
In terms of no vehicles in household, the demographic groups most similar to Immigrants from Germany are Immigrants from Canada (8.7%, a difference of 0.030%), Immigrants from North America (8.7%, a difference of 0.17%), Bhutanese (8.7%, a difference of 0.19%), Immigrants from Cuba (8.7%, a difference of 0.28%), and Osage (8.7%, a difference of 0.42%).
| Demographics | Rating | Rank | No Vehicles in Household |
| Immigrants | Jordan | 99.3 /100 | #84 | Exceptional 8.7% |
| Lebanese | 99.3 /100 | #85 | Exceptional 8.7% |
| Bangladeshis | 99.3 /100 | #86 | Exceptional 8.7% |
| Immigrants | England | 99.2 /100 | #87 | Exceptional 8.7% |
| Osage | 99.2 /100 | #88 | Exceptional 8.7% |
| Immigrants | Cuba | 99.2 /100 | #89 | Exceptional 8.7% |
| Bhutanese | 99.2 /100 | #90 | Exceptional 8.7% |
| Immigrants | Germany | 99.1 /100 | #91 | Exceptional 8.7% |
| Immigrants | Canada | 99.1 /100 | #92 | Exceptional 8.7% |
| Immigrants | North America | 99.1 /100 | #93 | Exceptional 8.7% |
| Austrians | 98.9 /100 | #94 | Exceptional 8.8% |
| Potawatomi | 98.8 /100 | #95 | Exceptional 8.8% |
| Immigrants | Bolivia | 98.7 /100 | #96 | Exceptional 8.9% |
| Immigrants | Central America | 98.5 /100 | #97 | Exceptional 8.9% |
| Slavs | 98.4 /100 | #98 | Exceptional 9.0% |