Yup'ik vs British 4 or more Vehicles in Household
COMPARE
Yup'ik
British
4 or more Vehicles in Household
4 or more Vehicles in Household Comparison
Yup'ik
British
5.7%
4 OR MORE VEHICLES IN HOUSEHOLD
1.5/ 100
METRIC RATING
255th/ 347
METRIC RANK
7.2%
4 OR MORE VEHICLES IN HOUSEHOLD
99.6/ 100
METRIC RATING
89th/ 347
METRIC RANK
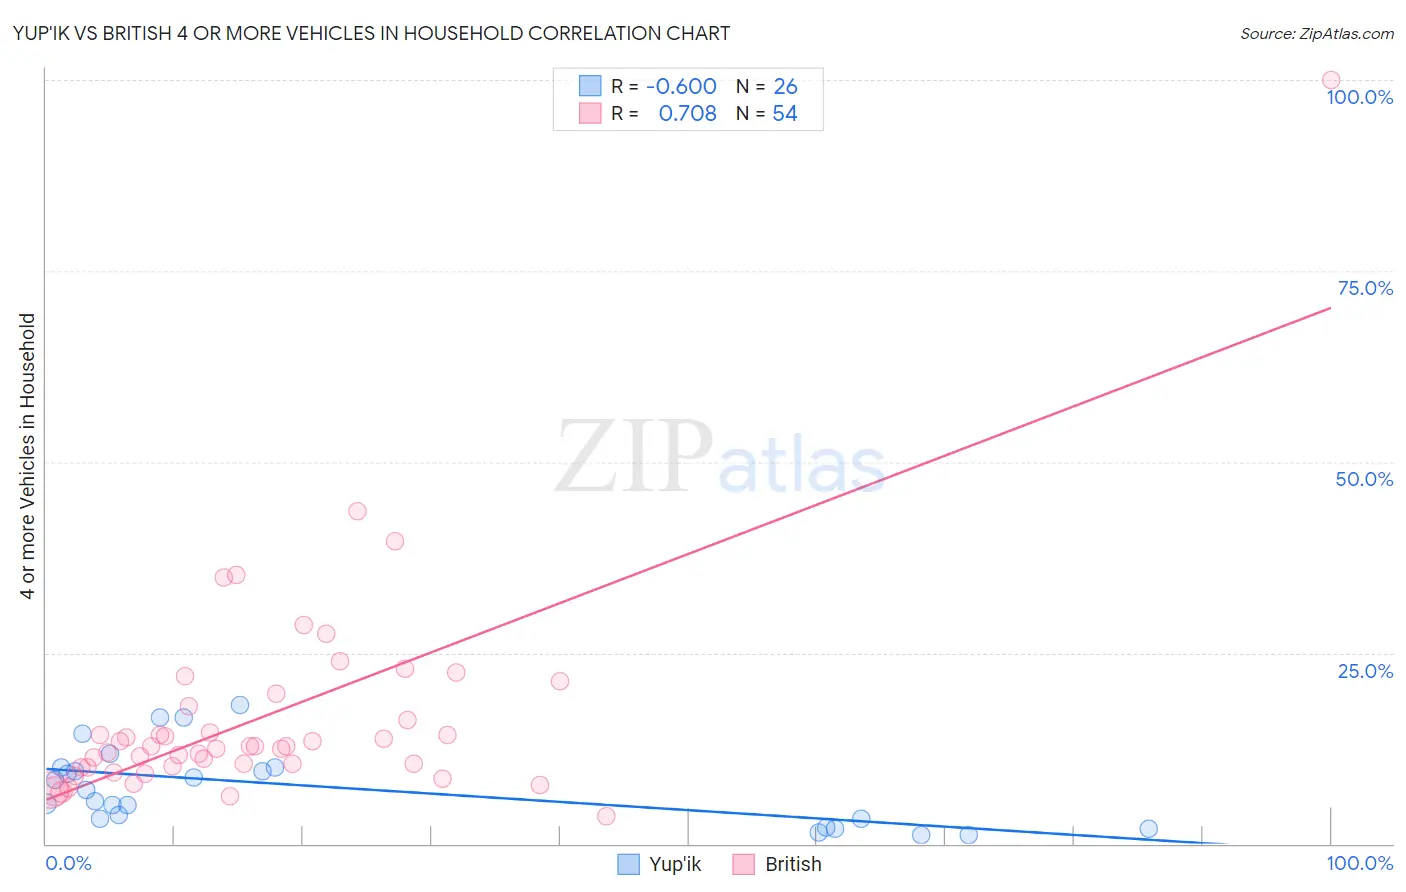
Yup'ik vs British 4 or more Vehicles in Household Correlation Chart
The statistical analysis conducted on geographies consisting of 39,858,552 people shows a significant negative correlation between the proportion of Yup'ik and percentage of households with 4 or more vehicles available in the United States with a correlation coefficient (R) of -0.600 and weighted average of 5.7%. Similarly, the statistical analysis conducted on geographies consisting of 528,748,745 people shows a strong positive correlation between the proportion of British and percentage of households with 4 or more vehicles available in the United States with a correlation coefficient (R) of 0.708 and weighted average of 7.2%, a difference of 27.3%.
4 or more Vehicles in Household Correlation Summary
| Measurement | Yup'ik | British |
| Minimum | 1.1% | 3.5% |
| Maximum | 18.2% | 100.0% |
| Range | 17.1% | 96.5% |
| Mean | 7.3% | 16.6% |
| Median | 6.2% | 12.7% |
| Interquartile 25% (IQ1) | 3.2% | 10.0% |
| Interquartile 75% (IQ3) | 10.0% | 18.0% |
| Interquartile Range (IQR) | 6.8% | 8.0% |
| Standard Deviation (Sample) | 5.1% | 14.4% |
| Standard Deviation (Population) | 5.0% | 14.2% |
Similar Demographics by 4 or more Vehicles in Household
Demographics Similar to Yup'ik by 4 or more Vehicles in Household
In terms of 4 or more vehicles in household, the demographic groups most similar to Yup'ik are Immigrants from Turkey (5.7%, a difference of 0.040%), Immigrants from Panama (5.7%, a difference of 0.090%), Immigrants from Northern Africa (5.6%, a difference of 0.12%), Immigrants from Cuba (5.7%, a difference of 0.22%), and Immigrants from Lithuania (5.6%, a difference of 0.25%).
| Demographics | Rating | Rank | 4 or more Vehicles in Household |
| Immigrants | Eastern Africa | 2.4 /100 | #248 | Tragic 5.7% |
| Immigrants | Southern Europe | 2.3 /100 | #249 | Tragic 5.7% |
| Immigrants | Europe | 2.3 /100 | #250 | Tragic 5.7% |
| Ugandans | 2.2 /100 | #251 | Tragic 5.7% |
| Sub-Saharan Africans | 2.1 /100 | #252 | Tragic 5.7% |
| Immigrants | Cuba | 1.6 /100 | #253 | Tragic 5.7% |
| Immigrants | Panama | 1.5 /100 | #254 | Tragic 5.7% |
| Yup'ik | 1.5 /100 | #255 | Tragic 5.7% |
| Immigrants | Turkey | 1.5 /100 | #256 | Tragic 5.7% |
| Immigrants | Northern Africa | 1.4 /100 | #257 | Tragic 5.6% |
| Immigrants | Lithuania | 1.4 /100 | #258 | Tragic 5.6% |
| Immigrants | France | 1.3 /100 | #259 | Tragic 5.6% |
| Uruguayans | 1.3 /100 | #260 | Tragic 5.6% |
| Sudanese | 1.2 /100 | #261 | Tragic 5.6% |
| Bermudans | 1.2 /100 | #262 | Tragic 5.6% |
Demographics Similar to British by 4 or more Vehicles in Household
In terms of 4 or more vehicles in household, the demographic groups most similar to British are Creek (7.2%, a difference of 0.080%), Nonimmigrants (7.2%, a difference of 0.33%), Delaware (7.2%, a difference of 0.35%), Immigrants from Indonesia (7.2%, a difference of 0.41%), and Cree (7.2%, a difference of 0.59%).
| Demographics | Rating | Rank | 4 or more Vehicles in Household |
| Northern Europeans | 99.8 /100 | #82 | Exceptional 7.3% |
| Potawatomi | 99.7 /100 | #83 | Exceptional 7.3% |
| Afghans | 99.7 /100 | #84 | Exceptional 7.3% |
| Cree | 99.7 /100 | #85 | Exceptional 7.2% |
| Immigrants | Indonesia | 99.6 /100 | #86 | Exceptional 7.2% |
| Delaware | 99.6 /100 | #87 | Exceptional 7.2% |
| Immigrants | Nonimmigrants | 99.6 /100 | #88 | Exceptional 7.2% |
| British | 99.6 /100 | #89 | Exceptional 7.2% |
| Creek | 99.6 /100 | #90 | Exceptional 7.2% |
| Assyrians/Chaldeans/Syriacs | 99.4 /100 | #91 | Exceptional 7.2% |
| Immigrants | Latin America | 99.4 /100 | #92 | Exceptional 7.1% |
| Immigrants | Afghanistan | 99.3 /100 | #93 | Exceptional 7.1% |
| Dutch West Indians | 99.3 /100 | #94 | Exceptional 7.1% |
| Czechoslovakians | 99.3 /100 | #95 | Exceptional 7.1% |
| Central Americans | 99.3 /100 | #96 | Exceptional 7.1% |