Yup'ik vs Crow 4 or more Vehicles in Household
COMPARE
Yup'ik
Crow
4 or more Vehicles in Household
4 or more Vehicles in Household Comparison
Yup'ik
Crow
5.7%
4 OR MORE VEHICLES IN HOUSEHOLD
1.5/ 100
METRIC RATING
255th/ 347
METRIC RANK
7.8%
4 OR MORE VEHICLES IN HOUSEHOLD
100.0/ 100
METRIC RATING
46th/ 347
METRIC RANK
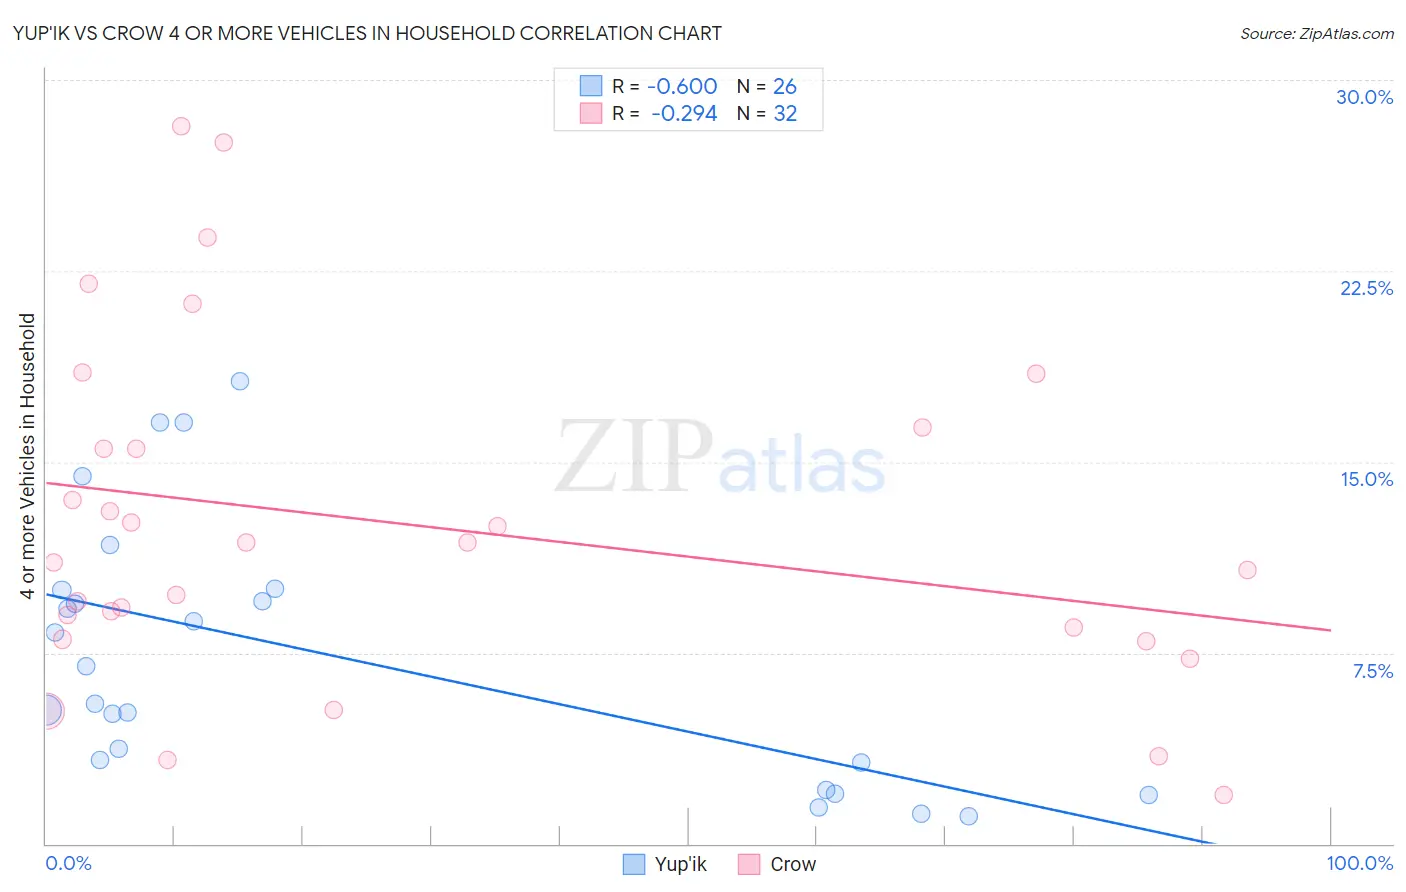
Yup'ik vs Crow 4 or more Vehicles in Household Correlation Chart
The statistical analysis conducted on geographies consisting of 39,858,552 people shows a significant negative correlation between the proportion of Yup'ik and percentage of households with 4 or more vehicles available in the United States with a correlation coefficient (R) of -0.600 and weighted average of 5.7%. Similarly, the statistical analysis conducted on geographies consisting of 59,198,453 people shows a weak negative correlation between the proportion of Crow and percentage of households with 4 or more vehicles available in the United States with a correlation coefficient (R) of -0.294 and weighted average of 7.8%, a difference of 37.6%.
4 or more Vehicles in Household Correlation Summary
| Measurement | Yup'ik | Crow |
| Minimum | 1.1% | 1.9% |
| Maximum | 18.2% | 28.2% |
| Range | 17.1% | 26.3% |
| Mean | 7.3% | 12.6% |
| Median | 6.2% | 11.4% |
| Interquartile 25% (IQ1) | 3.2% | 8.3% |
| Interquartile 75% (IQ3) | 10.0% | 15.9% |
| Interquartile Range (IQR) | 6.8% | 7.7% |
| Standard Deviation (Sample) | 5.1% | 6.7% |
| Standard Deviation (Population) | 5.0% | 6.6% |
Similar Demographics by 4 or more Vehicles in Household
Demographics Similar to Yup'ik by 4 or more Vehicles in Household
In terms of 4 or more vehicles in household, the demographic groups most similar to Yup'ik are Immigrants from Turkey (5.7%, a difference of 0.040%), Immigrants from Panama (5.7%, a difference of 0.090%), Immigrants from Northern Africa (5.6%, a difference of 0.12%), Immigrants from Cuba (5.7%, a difference of 0.22%), and Immigrants from Lithuania (5.6%, a difference of 0.25%).
| Demographics | Rating | Rank | 4 or more Vehicles in Household |
| Immigrants | Eastern Africa | 2.4 /100 | #248 | Tragic 5.7% |
| Immigrants | Southern Europe | 2.3 /100 | #249 | Tragic 5.7% |
| Immigrants | Europe | 2.3 /100 | #250 | Tragic 5.7% |
| Ugandans | 2.2 /100 | #251 | Tragic 5.7% |
| Sub-Saharan Africans | 2.1 /100 | #252 | Tragic 5.7% |
| Immigrants | Cuba | 1.6 /100 | #253 | Tragic 5.7% |
| Immigrants | Panama | 1.5 /100 | #254 | Tragic 5.7% |
| Yup'ik | 1.5 /100 | #255 | Tragic 5.7% |
| Immigrants | Turkey | 1.5 /100 | #256 | Tragic 5.7% |
| Immigrants | Northern Africa | 1.4 /100 | #257 | Tragic 5.6% |
| Immigrants | Lithuania | 1.4 /100 | #258 | Tragic 5.6% |
| Immigrants | France | 1.3 /100 | #259 | Tragic 5.6% |
| Uruguayans | 1.3 /100 | #260 | Tragic 5.6% |
| Sudanese | 1.2 /100 | #261 | Tragic 5.6% |
| Bermudans | 1.2 /100 | #262 | Tragic 5.6% |
Demographics Similar to Crow by 4 or more Vehicles in Household
In terms of 4 or more vehicles in household, the demographic groups most similar to Crow are Osage (7.8%, a difference of 0.16%), Choctaw (7.8%, a difference of 0.17%), Bhutanese (7.8%, a difference of 0.22%), Swiss (7.8%, a difference of 0.34%), and Fijian (7.8%, a difference of 0.49%).
| Demographics | Rating | Rank | 4 or more Vehicles in Household |
| Spanish Americans | 100.0 /100 | #39 | Exceptional 8.0% |
| Spanish | 100.0 /100 | #40 | Exceptional 7.9% |
| Pima | 100.0 /100 | #41 | Exceptional 7.9% |
| Salvadorans | 100.0 /100 | #42 | Exceptional 7.8% |
| Fijians | 100.0 /100 | #43 | Exceptional 7.8% |
| Bhutanese | 100.0 /100 | #44 | Exceptional 7.8% |
| Choctaw | 100.0 /100 | #45 | Exceptional 7.8% |
| Crow | 100.0 /100 | #46 | Exceptional 7.8% |
| Osage | 100.0 /100 | #47 | Exceptional 7.8% |
| Swiss | 100.0 /100 | #48 | Exceptional 7.8% |
| Cherokee | 100.0 /100 | #49 | Exceptional 7.7% |
| Immigrants | El Salvador | 100.0 /100 | #50 | Exceptional 7.7% |
| Immigrants | Laos | 100.0 /100 | #51 | Exceptional 7.7% |
| Japanese | 100.0 /100 | #52 | Exceptional 7.7% |
| Malaysians | 100.0 /100 | #53 | Exceptional 7.7% |