Iroquois vs British 4 or more Vehicles in Household
COMPARE
Iroquois
British
4 or more Vehicles in Household
4 or more Vehicles in Household Comparison
Iroquois
British
6.5%
4 OR MORE VEHICLES IN HOUSEHOLD
70.4/ 100
METRIC RATING
155th/ 347
METRIC RANK
7.2%
4 OR MORE VEHICLES IN HOUSEHOLD
99.6/ 100
METRIC RATING
89th/ 347
METRIC RANK
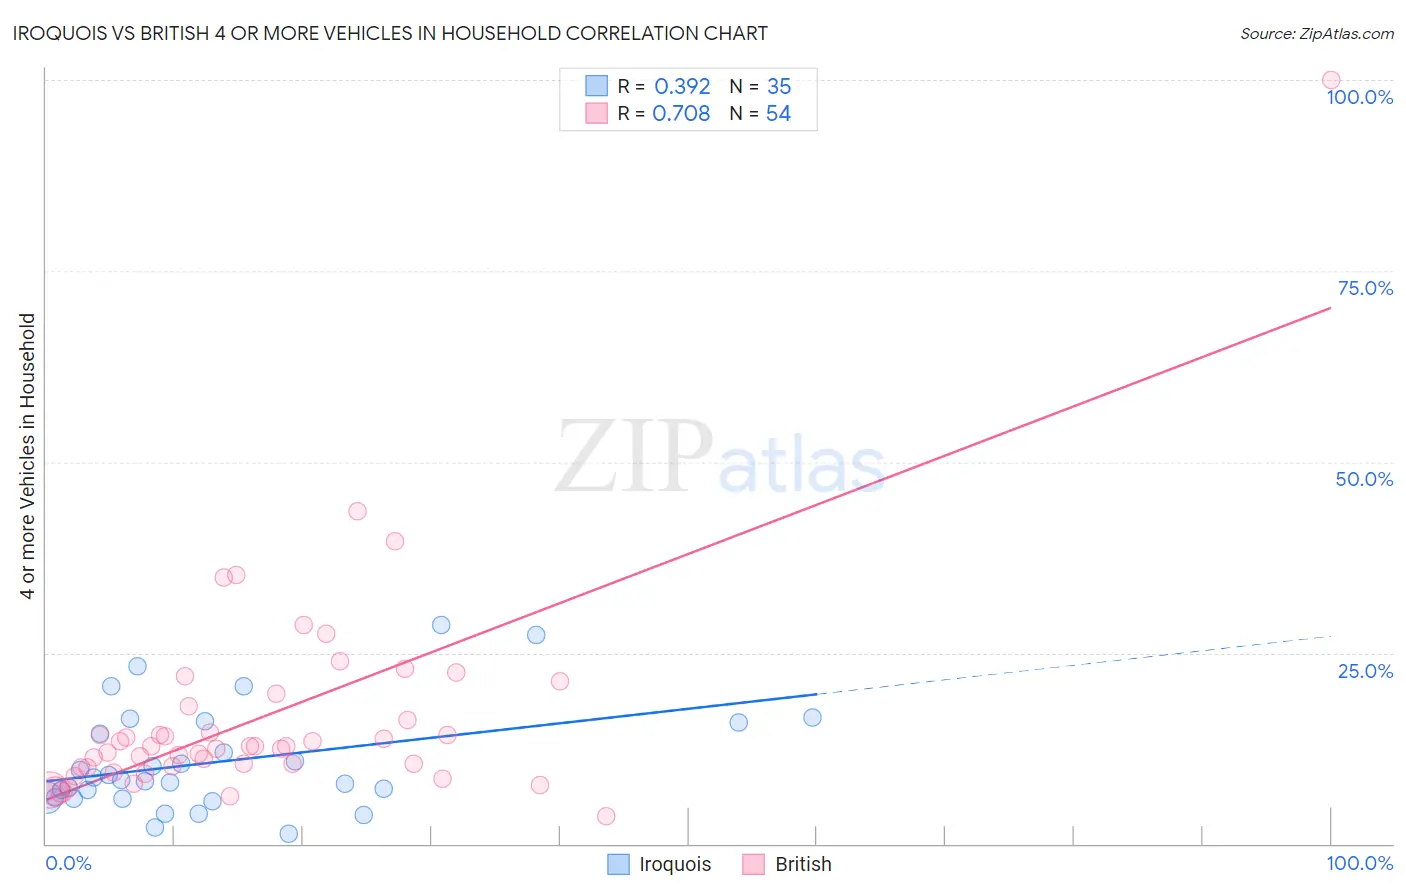
Iroquois vs British 4 or more Vehicles in Household Correlation Chart
The statistical analysis conducted on geographies consisting of 206,658,365 people shows a mild positive correlation between the proportion of Iroquois and percentage of households with 4 or more vehicles available in the United States with a correlation coefficient (R) of 0.392 and weighted average of 6.5%. Similarly, the statistical analysis conducted on geographies consisting of 528,748,745 people shows a strong positive correlation between the proportion of British and percentage of households with 4 or more vehicles available in the United States with a correlation coefficient (R) of 0.708 and weighted average of 7.2%, a difference of 11.4%.
4 or more Vehicles in Household Correlation Summary
| Measurement | Iroquois | British |
| Minimum | 1.3% | 3.5% |
| Maximum | 28.6% | 100.0% |
| Range | 27.3% | 96.5% |
| Mean | 10.7% | 16.6% |
| Median | 8.3% | 12.7% |
| Interquartile 25% (IQ1) | 6.0% | 10.0% |
| Interquartile 75% (IQ3) | 15.9% | 18.0% |
| Interquartile Range (IQR) | 9.9% | 8.0% |
| Standard Deviation (Sample) | 6.9% | 14.4% |
| Standard Deviation (Population) | 6.8% | 14.2% |
Similar Demographics by 4 or more Vehicles in Household
Demographics Similar to Iroquois by 4 or more Vehicles in Household
In terms of 4 or more vehicles in household, the demographic groups most similar to Iroquois are Iranian (6.5%, a difference of 0.060%), Central American Indian (6.5%, a difference of 0.080%), Immigrants from Armenia (6.5%, a difference of 0.090%), Peruvian (6.5%, a difference of 0.11%), and Yuman (6.5%, a difference of 0.21%).
| Demographics | Rating | Rank | 4 or more Vehicles in Household |
| Immigrants | Jordan | 73.7 /100 | #148 | Good 6.5% |
| Greeks | 73.6 /100 | #149 | Good 6.5% |
| New Zealanders | 73.3 /100 | #150 | Good 6.5% |
| Immigrants | Hong Kong | 72.2 /100 | #151 | Good 6.5% |
| Yuman | 72.1 /100 | #152 | Good 6.5% |
| Immigrants | Armenia | 71.2 /100 | #153 | Good 6.5% |
| Central American Indians | 71.1 /100 | #154 | Good 6.5% |
| Iroquois | 70.4 /100 | #155 | Good 6.5% |
| Iranians | 69.9 /100 | #156 | Good 6.5% |
| Peruvians | 69.4 /100 | #157 | Good 6.5% |
| Zimbabweans | 67.1 /100 | #158 | Good 6.4% |
| Indians (Asian) | 66.3 /100 | #159 | Good 6.4% |
| Palestinians | 65.8 /100 | #160 | Good 6.4% |
| Immigrants | Cameroon | 64.4 /100 | #161 | Good 6.4% |
| Immigrants | Pakistan | 63.2 /100 | #162 | Good 6.4% |
Demographics Similar to British by 4 or more Vehicles in Household
In terms of 4 or more vehicles in household, the demographic groups most similar to British are Creek (7.2%, a difference of 0.080%), Nonimmigrants (7.2%, a difference of 0.33%), Delaware (7.2%, a difference of 0.35%), Immigrants from Indonesia (7.2%, a difference of 0.41%), and Cree (7.2%, a difference of 0.59%).
| Demographics | Rating | Rank | 4 or more Vehicles in Household |
| Northern Europeans | 99.8 /100 | #82 | Exceptional 7.3% |
| Potawatomi | 99.7 /100 | #83 | Exceptional 7.3% |
| Afghans | 99.7 /100 | #84 | Exceptional 7.3% |
| Cree | 99.7 /100 | #85 | Exceptional 7.2% |
| Immigrants | Indonesia | 99.6 /100 | #86 | Exceptional 7.2% |
| Delaware | 99.6 /100 | #87 | Exceptional 7.2% |
| Immigrants | Nonimmigrants | 99.6 /100 | #88 | Exceptional 7.2% |
| British | 99.6 /100 | #89 | Exceptional 7.2% |
| Creek | 99.6 /100 | #90 | Exceptional 7.2% |
| Assyrians/Chaldeans/Syriacs | 99.4 /100 | #91 | Exceptional 7.2% |
| Immigrants | Latin America | 99.4 /100 | #92 | Exceptional 7.1% |
| Immigrants | Afghanistan | 99.3 /100 | #93 | Exceptional 7.1% |
| Dutch West Indians | 99.3 /100 | #94 | Exceptional 7.1% |
| Czechoslovakians | 99.3 /100 | #95 | Exceptional 7.1% |
| Central Americans | 99.3 /100 | #96 | Exceptional 7.1% |