Yaqui vs Menominee 1 or more Vehicles in Household
COMPARE
Yaqui
Menominee
1 or more Vehicles in Household
1 or more Vehicles in Household Comparison
Yaqui
Menominee
92.6%
1 OR MORE VEHICLES IN HOUSEHOLD
100.0/ 100
METRIC RATING
24th/ 347
METRIC RANK
88.3%
1 OR MORE VEHICLES IN HOUSEHOLD
1.9/ 100
METRIC RATING
246th/ 347
METRIC RANK
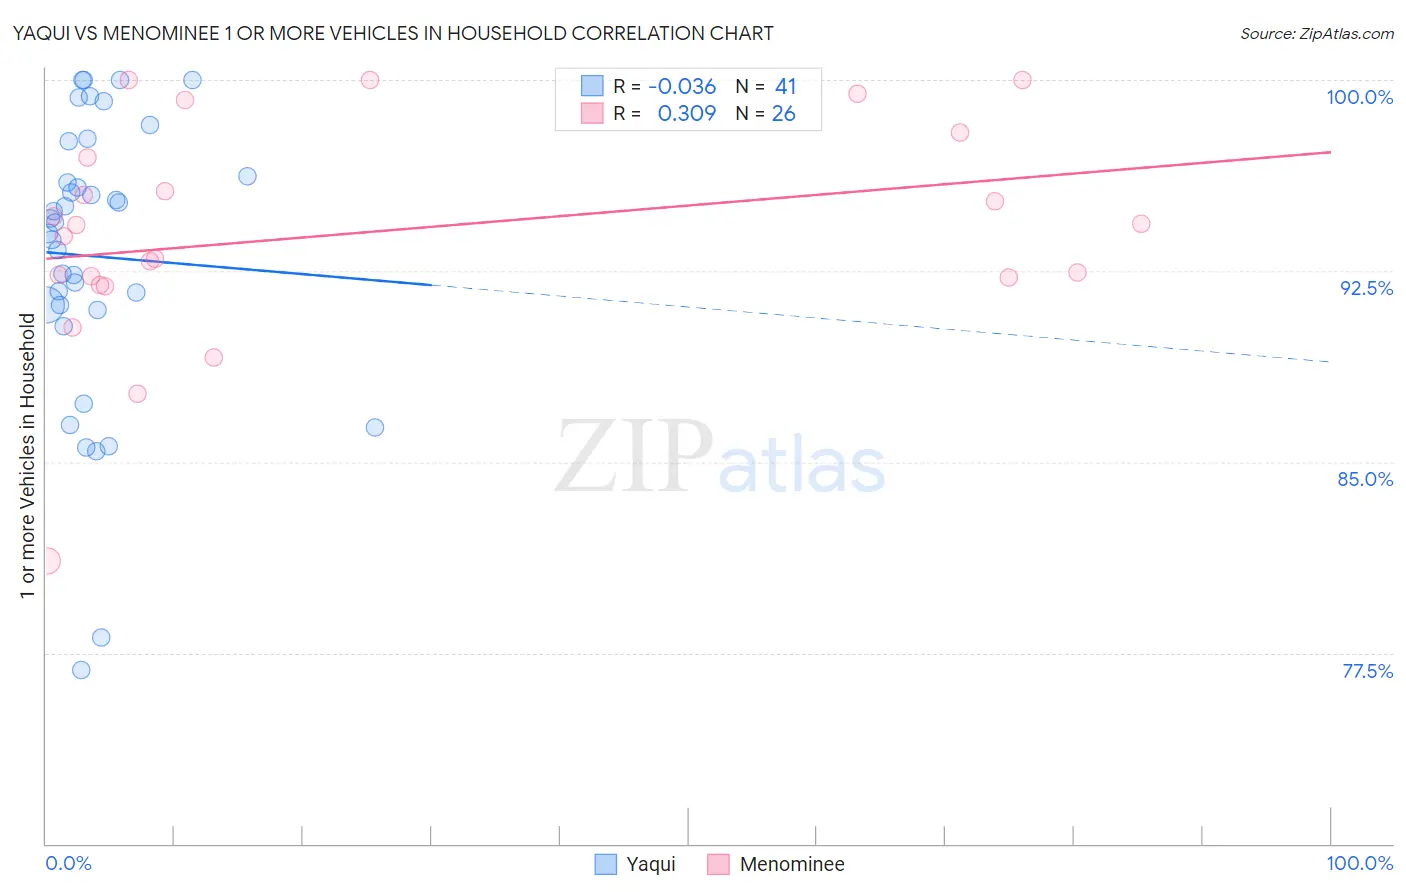
Yaqui vs Menominee 1 or more Vehicles in Household Correlation Chart
The statistical analysis conducted on geographies consisting of 107,720,236 people shows no correlation between the proportion of Yaqui and percentage of households with 1 or more vehicles available in the United States with a correlation coefficient (R) of -0.036 and weighted average of 92.6%. Similarly, the statistical analysis conducted on geographies consisting of 45,777,849 people shows a mild positive correlation between the proportion of Menominee and percentage of households with 1 or more vehicles available in the United States with a correlation coefficient (R) of 0.309 and weighted average of 88.3%, a difference of 4.8%.
1 or more Vehicles in Household Correlation Summary
| Measurement | Yaqui | Menominee |
| Minimum | 76.8% | 81.1% |
| Maximum | 100.0% | 100.0% |
| Range | 23.2% | 18.9% |
| Mean | 93.1% | 94.0% |
| Median | 94.4% | 94.1% |
| Interquartile 25% (IQ1) | 91.1% | 92.2% |
| Interquartile 75% (IQ3) | 96.9% | 97.0% |
| Interquartile Range (IQR) | 5.8% | 4.7% |
| Standard Deviation (Sample) | 5.6% | 4.3% |
| Standard Deviation (Population) | 5.5% | 4.2% |
Similar Demographics by 1 or more Vehicles in Household
Demographics Similar to Yaqui by 1 or more Vehicles in Household
In terms of 1 or more vehicles in household, the demographic groups most similar to Yaqui are Immigrants from Iraq (92.5%, a difference of 0.020%), British (92.5%, a difference of 0.040%), Nepalese (92.6%, a difference of 0.070%), American (92.5%, a difference of 0.090%), and Sri Lankan (92.5%, a difference of 0.12%).
| Demographics | Rating | Rank | 1 or more Vehicles in Household |
| Europeans | 100.0 /100 | #17 | Exceptional 93.0% |
| Welsh | 100.0 /100 | #18 | Exceptional 93.0% |
| Tongans | 100.0 /100 | #19 | Exceptional 92.9% |
| Arapaho | 100.0 /100 | #20 | Exceptional 92.7% |
| Ottawa | 100.0 /100 | #21 | Exceptional 92.7% |
| French | 100.0 /100 | #22 | Exceptional 92.7% |
| Nepalese | 100.0 /100 | #23 | Exceptional 92.6% |
| Yaqui | 100.0 /100 | #24 | Exceptional 92.6% |
| Immigrants | Iraq | 100.0 /100 | #25 | Exceptional 92.5% |
| British | 100.0 /100 | #26 | Exceptional 92.5% |
| Americans | 100.0 /100 | #27 | Exceptional 92.5% |
| Sri Lankans | 100.0 /100 | #28 | Exceptional 92.5% |
| Native Hawaiians | 100.0 /100 | #29 | Exceptional 92.4% |
| Finns | 100.0 /100 | #30 | Exceptional 92.4% |
| Samoans | 100.0 /100 | #31 | Exceptional 92.4% |
Demographics Similar to Menominee by 1 or more Vehicles in Household
In terms of 1 or more vehicles in household, the demographic groups most similar to Menominee are Immigrants from Czechoslovakia (88.3%, a difference of 0.010%), Immigrants from Portugal (88.3%, a difference of 0.030%), Immigrants from Honduras (88.3%, a difference of 0.040%), Immigrants from Belgium (88.4%, a difference of 0.050%), and Immigrants from Nigeria (88.2%, a difference of 0.080%).
| Demographics | Rating | Rank | 1 or more Vehicles in Household |
| Kiowa | 3.8 /100 | #239 | Tragic 88.6% |
| Eastern Europeans | 3.0 /100 | #240 | Tragic 88.5% |
| Taiwanese | 2.6 /100 | #241 | Tragic 88.4% |
| Turks | 2.5 /100 | #242 | Tragic 88.4% |
| Immigrants | Belgium | 2.1 /100 | #243 | Tragic 88.4% |
| Immigrants | Portugal | 2.0 /100 | #244 | Tragic 88.3% |
| Immigrants | Czechoslovakia | 1.9 /100 | #245 | Tragic 88.3% |
| Menominee | 1.9 /100 | #246 | Tragic 88.3% |
| Immigrants | Honduras | 1.7 /100 | #247 | Tragic 88.3% |
| Immigrants | Nigeria | 1.5 /100 | #248 | Tragic 88.2% |
| Blacks/African Americans | 1.4 /100 | #249 | Tragic 88.2% |
| Egyptians | 1.2 /100 | #250 | Tragic 88.2% |
| Immigrants | Serbia | 1.2 /100 | #251 | Tragic 88.2% |
| Immigrants | Uruguay | 1.1 /100 | #252 | Tragic 88.1% |
| Hondurans | 1.0 /100 | #253 | Tragic 88.1% |