Soviet Union vs Menominee 1 or more Vehicles in Household
COMPARE
Soviet Union
Menominee
1 or more Vehicles in Household
1 or more Vehicles in Household Comparison
Soviet Union
Menominee
82.7%
1 OR MORE VEHICLES IN HOUSEHOLD
0.0/ 100
METRIC RATING
320th/ 347
METRIC RANK
88.3%
1 OR MORE VEHICLES IN HOUSEHOLD
1.9/ 100
METRIC RATING
246th/ 347
METRIC RANK
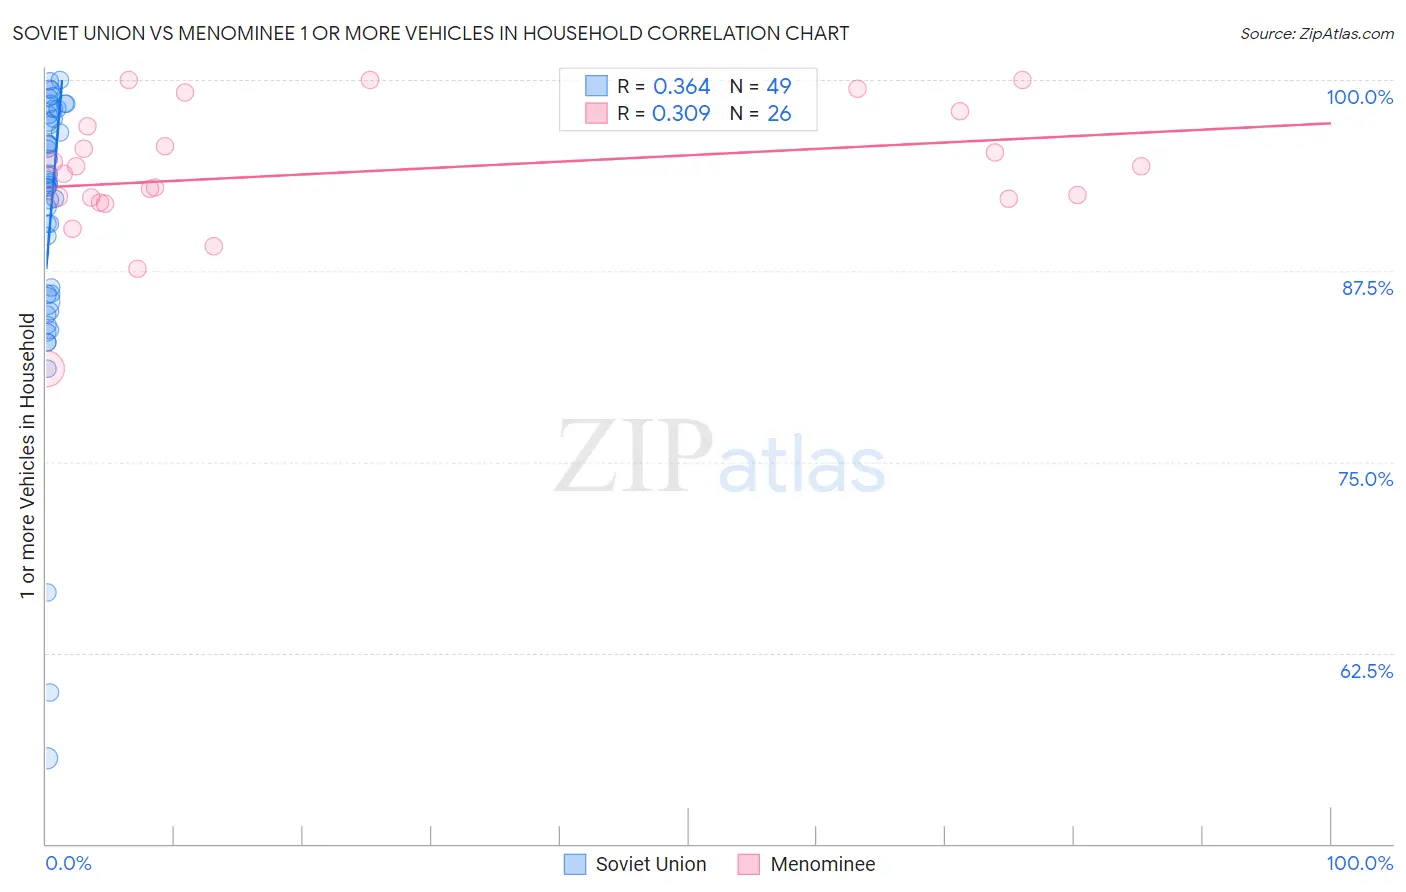
Soviet Union vs Menominee 1 or more Vehicles in Household Correlation Chart
The statistical analysis conducted on geographies consisting of 43,492,822 people shows a mild positive correlation between the proportion of Soviet Union and percentage of households with 1 or more vehicles available in the United States with a correlation coefficient (R) of 0.364 and weighted average of 82.7%. Similarly, the statistical analysis conducted on geographies consisting of 45,777,849 people shows a mild positive correlation between the proportion of Menominee and percentage of households with 1 or more vehicles available in the United States with a correlation coefficient (R) of 0.309 and weighted average of 88.3%, a difference of 6.8%.
1 or more Vehicles in Household Correlation Summary
| Measurement | Soviet Union | Menominee |
| Minimum | 55.6% | 81.1% |
| Maximum | 100.0% | 100.0% |
| Range | 44.4% | 18.9% |
| Mean | 90.7% | 94.0% |
| Median | 93.3% | 94.1% |
| Interquartile 25% (IQ1) | 85.7% | 92.2% |
| Interquartile 75% (IQ3) | 97.6% | 97.0% |
| Interquartile Range (IQR) | 11.8% | 4.7% |
| Standard Deviation (Sample) | 9.6% | 4.3% |
| Standard Deviation (Population) | 9.5% | 4.2% |
Similar Demographics by 1 or more Vehicles in Household
Demographics Similar to Soviet Union by 1 or more Vehicles in Household
In terms of 1 or more vehicles in household, the demographic groups most similar to Soviet Union are Jamaican (82.1%, a difference of 0.64%), Immigrants from Belarus (83.3%, a difference of 0.81%), Immigrants from Ghana (83.4%, a difference of 0.94%), Ghanaian (83.6%, a difference of 1.1%), and Immigrants from Cabo Verde (81.6%, a difference of 1.3%).
| Demographics | Rating | Rank | 1 or more Vehicles in Household |
| Immigrants | Israel | 0.0 /100 | #313 | Tragic 84.5% |
| Albanians | 0.0 /100 | #314 | Tragic 84.4% |
| Cypriots | 0.0 /100 | #315 | Tragic 84.4% |
| Alaska Natives | 0.0 /100 | #316 | Tragic 83.8% |
| Ghanaians | 0.0 /100 | #317 | Tragic 83.6% |
| Immigrants | Ghana | 0.0 /100 | #318 | Tragic 83.4% |
| Immigrants | Belarus | 0.0 /100 | #319 | Tragic 83.3% |
| Soviet Union | 0.0 /100 | #320 | Tragic 82.7% |
| Jamaicans | 0.0 /100 | #321 | Tragic 82.1% |
| Immigrants | Cabo Verde | 0.0 /100 | #322 | Tragic 81.6% |
| Immigrants | Yemen | 0.0 /100 | #323 | Tragic 80.5% |
| Immigrants | Caribbean | 0.0 /100 | #324 | Tragic 80.4% |
| Senegalese | 0.0 /100 | #325 | Tragic 80.4% |
| Immigrants | West Indies | 0.0 /100 | #326 | Tragic 79.5% |
| Immigrants | Senegal | 0.0 /100 | #327 | Tragic 79.0% |
Demographics Similar to Menominee by 1 or more Vehicles in Household
In terms of 1 or more vehicles in household, the demographic groups most similar to Menominee are Immigrants from Czechoslovakia (88.3%, a difference of 0.010%), Immigrants from Portugal (88.3%, a difference of 0.030%), Immigrants from Honduras (88.3%, a difference of 0.040%), Immigrants from Belgium (88.4%, a difference of 0.050%), and Immigrants from Nigeria (88.2%, a difference of 0.080%).
| Demographics | Rating | Rank | 1 or more Vehicles in Household |
| Kiowa | 3.8 /100 | #239 | Tragic 88.6% |
| Eastern Europeans | 3.0 /100 | #240 | Tragic 88.5% |
| Taiwanese | 2.6 /100 | #241 | Tragic 88.4% |
| Turks | 2.5 /100 | #242 | Tragic 88.4% |
| Immigrants | Belgium | 2.1 /100 | #243 | Tragic 88.4% |
| Immigrants | Portugal | 2.0 /100 | #244 | Tragic 88.3% |
| Immigrants | Czechoslovakia | 1.9 /100 | #245 | Tragic 88.3% |
| Menominee | 1.9 /100 | #246 | Tragic 88.3% |
| Immigrants | Honduras | 1.7 /100 | #247 | Tragic 88.3% |
| Immigrants | Nigeria | 1.5 /100 | #248 | Tragic 88.2% |
| Blacks/African Americans | 1.4 /100 | #249 | Tragic 88.2% |
| Egyptians | 1.2 /100 | #250 | Tragic 88.2% |
| Immigrants | Serbia | 1.2 /100 | #251 | Tragic 88.2% |
| Immigrants | Uruguay | 1.1 /100 | #252 | Tragic 88.1% |
| Hondurans | 1.0 /100 | #253 | Tragic 88.1% |