Yaqui vs Menominee Average Family Size
COMPARE
Yaqui
Menominee
Average Family Size
Average Family Size Comparison
Yaqui
Menominee
3.32
AVERAGE FAMILY SIZE
99.9/ 100
METRIC RATING
73rd/ 347
METRIC RANK
3.30
AVERAGE FAMILY SIZE
99.4/ 100
METRIC RATING
90th/ 347
METRIC RANK
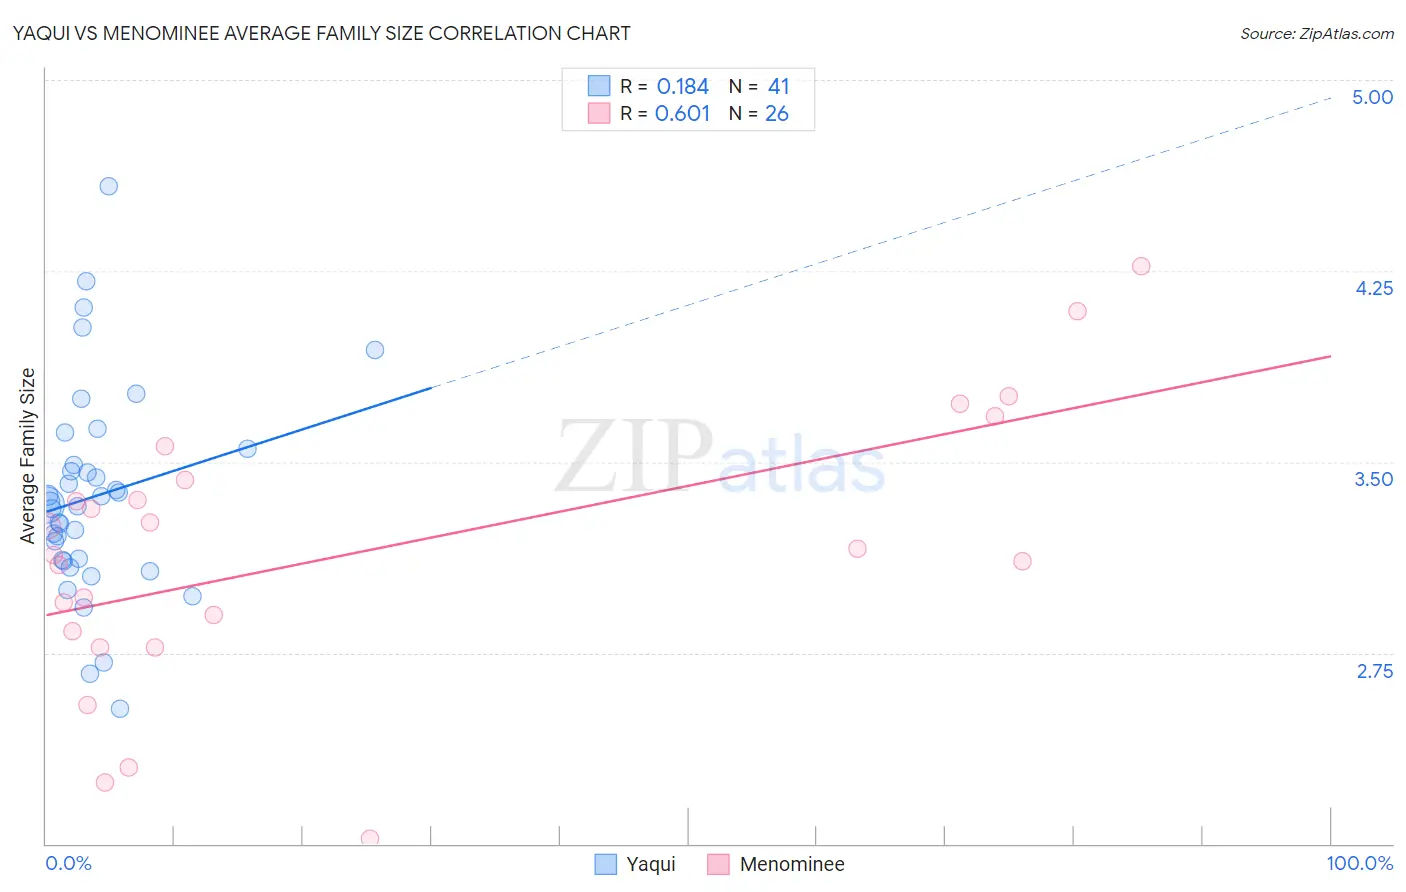
Yaqui vs Menominee Average Family Size Correlation Chart
The statistical analysis conducted on geographies consisting of 107,720,236 people shows a poor positive correlation between the proportion of Yaqui and average family size in the United States with a correlation coefficient (R) of 0.184 and weighted average of 3.32. Similarly, the statistical analysis conducted on geographies consisting of 45,777,849 people shows a significant positive correlation between the proportion of Menominee and average family size in the United States with a correlation coefficient (R) of 0.601 and weighted average of 3.30, a difference of 0.61%.
Average Family Size Correlation Summary
| Measurement | Yaqui | Menominee |
| Minimum | 2.53 | 2.02 |
| Maximum | 4.58 | 4.27 |
| Range | 2.05 | 2.25 |
| Mean | 3.37 | 3.15 |
| Median | 3.33 | 3.15 |
| Interquartile 25% (IQ1) | 3.11 | 2.83 |
| Interquartile 75% (IQ3) | 3.52 | 3.43 |
| Interquartile Range (IQR) | 0.41 | 0.60 |
| Standard Deviation (Sample) | 0.41 | 0.54 |
| Standard Deviation (Population) | 0.40 | 0.53 |
Demographics Similar to Yaqui and Menominee by Average Family Size
In terms of average family size, the demographic groups most similar to Yaqui are Immigrants from Caribbean (3.33, a difference of 0.030%), Immigrants from Sierra Leone (3.32, a difference of 0.030%), Immigrants from Barbados (3.32, a difference of 0.060%), Trinidadian and Tobagonian (3.32, a difference of 0.080%), and Immigrants from Ecuador (3.32, a difference of 0.090%). Similarly, the demographic groups most similar to Menominee are Malaysian (3.31, a difference of 0.11%), Immigrants from Bolivia (3.31, a difference of 0.12%), Immigrants from Pakistan (3.30, a difference of 0.15%), Immigrants from Peru (3.31, a difference of 0.21%), and Jamaican (3.31, a difference of 0.26%).
| Demographics | Rating | Rank | Average Family Size |
| Immigrants | West Indies | 99.9 /100 | #71 | Exceptional 3.33 |
| Immigrants | Caribbean | 99.9 /100 | #72 | Exceptional 3.33 |
| Yaqui | 99.9 /100 | #73 | Exceptional 3.32 |
| Immigrants | Sierra Leone | 99.9 /100 | #74 | Exceptional 3.32 |
| Immigrants | Barbados | 99.8 /100 | #75 | Exceptional 3.32 |
| Trinidadians and Tobagonians | 99.8 /100 | #76 | Exceptional 3.32 |
| Immigrants | Ecuador | 99.8 /100 | #77 | Exceptional 3.32 |
| Immigrants | Micronesia | 99.8 /100 | #78 | Exceptional 3.32 |
| British West Indians | 99.8 /100 | #79 | Exceptional 3.32 |
| Lumbee | 99.8 /100 | #80 | Exceptional 3.32 |
| Immigrants | Dominica | 99.8 /100 | #81 | Exceptional 3.32 |
| Ecuadorians | 99.8 /100 | #82 | Exceptional 3.32 |
| Immigrants | Afghanistan | 99.8 /100 | #83 | Exceptional 3.32 |
| Immigrants | Nigeria | 99.7 /100 | #84 | Exceptional 3.32 |
| Afghans | 99.7 /100 | #85 | Exceptional 3.31 |
| Jamaicans | 99.7 /100 | #86 | Exceptional 3.31 |
| Immigrants | Peru | 99.7 /100 | #87 | Exceptional 3.31 |
| Immigrants | Bolivia | 99.6 /100 | #88 | Exceptional 3.31 |
| Malaysians | 99.6 /100 | #89 | Exceptional 3.31 |
| Menominee | 99.4 /100 | #90 | Exceptional 3.30 |
| Immigrants | Pakistan | 99.2 /100 | #91 | Exceptional 3.30 |