Yakama vs Lebanese Single Mother Poverty
COMPARE
Yakama
Lebanese
Single Mother Poverty
Single Mother Poverty Comparison
Yakama
Lebanese
36.4%
SINGLE MOTHER POVERTY
0.0/ 100
METRIC RATING
327th/ 347
METRIC RANK
29.4%
SINGLE MOTHER POVERTY
32.5/ 100
METRIC RATING
187th/ 347
METRIC RANK
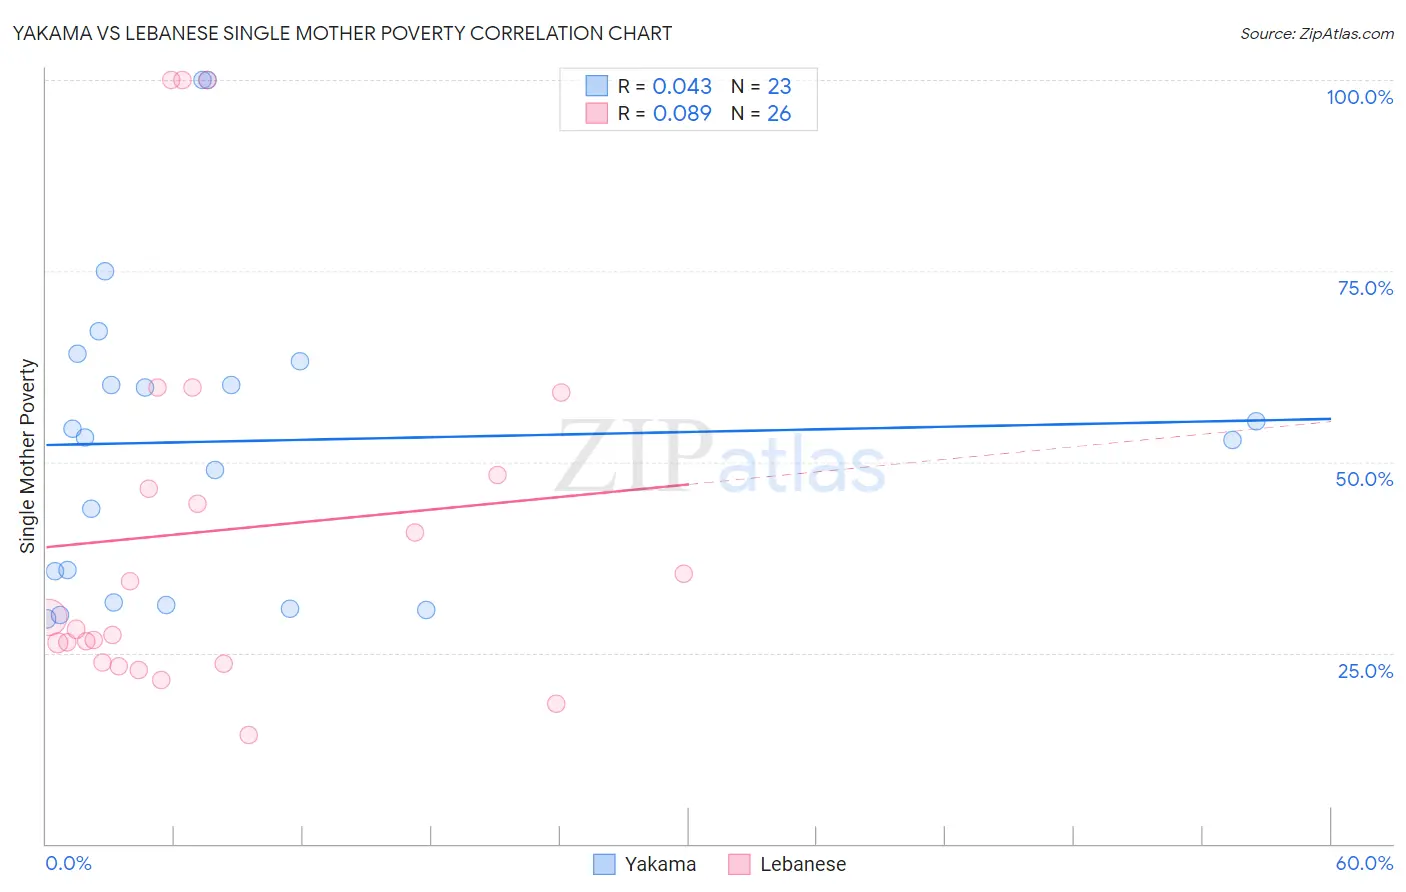
Yakama vs Lebanese Single Mother Poverty Correlation Chart
The statistical analysis conducted on geographies consisting of 19,786,189 people shows no correlation between the proportion of Yakama and poverty level among single mothers in the United States with a correlation coefficient (R) of 0.043 and weighted average of 36.4%. Similarly, the statistical analysis conducted on geographies consisting of 390,539,511 people shows a slight positive correlation between the proportion of Lebanese and poverty level among single mothers in the United States with a correlation coefficient (R) of 0.089 and weighted average of 29.4%, a difference of 23.7%.
Single Mother Poverty Correlation Summary
| Measurement | Yakama | Lebanese |
| Minimum | 29.5% | 14.3% |
| Maximum | 100.0% | 100.0% |
| Range | 70.5% | 85.7% |
| Mean | 52.7% | 41.0% |
| Median | 53.2% | 28.9% |
| Interquartile 25% (IQ1) | 31.6% | 23.8% |
| Interquartile 75% (IQ3) | 63.2% | 48.2% |
| Interquartile Range (IQR) | 31.6% | 24.4% |
| Standard Deviation (Sample) | 20.4% | 25.2% |
| Standard Deviation (Population) | 20.0% | 24.7% |
Similar Demographics by Single Mother Poverty
Demographics Similar to Yakama by Single Mother Poverty
In terms of single mother poverty, the demographic groups most similar to Yakama are Choctaw (36.4%, a difference of 0.060%), Apache (36.6%, a difference of 0.53%), Native/Alaskan (36.6%, a difference of 0.64%), Creek (36.7%, a difference of 0.79%), and Dutch West Indian (36.8%, a difference of 1.0%).
| Demographics | Rating | Rank | Single Mother Poverty |
| Iroquois | 0.0 /100 | #320 | Tragic 34.8% |
| Paiute | 0.0 /100 | #321 | Tragic 35.1% |
| Blacks/African Americans | 0.0 /100 | #322 | Tragic 35.2% |
| Kiowa | 0.0 /100 | #323 | Tragic 35.5% |
| Ottawa | 0.0 /100 | #324 | Tragic 35.5% |
| Ute | 0.0 /100 | #325 | Tragic 35.7% |
| Seminole | 0.0 /100 | #326 | Tragic 35.8% |
| Yakama | 0.0 /100 | #327 | Tragic 36.4% |
| Choctaw | 0.0 /100 | #328 | Tragic 36.4% |
| Apache | 0.0 /100 | #329 | Tragic 36.6% |
| Natives/Alaskans | 0.0 /100 | #330 | Tragic 36.6% |
| Creek | 0.0 /100 | #331 | Tragic 36.7% |
| Dutch West Indians | 0.0 /100 | #332 | Tragic 36.8% |
| Menominee | 0.0 /100 | #333 | Tragic 37.1% |
| Pueblo | 0.0 /100 | #334 | Tragic 37.2% |
Demographics Similar to Lebanese by Single Mother Poverty
In terms of single mother poverty, the demographic groups most similar to Lebanese are Guamanian/Chamorro (29.4%, a difference of 0.040%), Immigrants from Africa (29.4%, a difference of 0.050%), Immigrants from Germany (29.5%, a difference of 0.11%), Immigrants from Trinidad and Tobago (29.5%, a difference of 0.18%), and Yugoslavian (29.4%, a difference of 0.19%).
| Demographics | Rating | Rank | Single Mother Poverty |
| Immigrants | Norway | 41.5 /100 | #180 | Average 29.3% |
| Canadians | 40.4 /100 | #181 | Average 29.3% |
| Immigrants | Eastern Africa | 38.5 /100 | #182 | Fair 29.3% |
| Nepalese | 38.3 /100 | #183 | Fair 29.3% |
| Nigerians | 38.0 /100 | #184 | Fair 29.3% |
| Ghanaians | 36.8 /100 | #185 | Fair 29.4% |
| Yugoslavians | 36.0 /100 | #186 | Fair 29.4% |
| Lebanese | 32.5 /100 | #187 | Fair 29.4% |
| Guamanians/Chamorros | 31.8 /100 | #188 | Fair 29.4% |
| Immigrants | Africa | 31.6 /100 | #189 | Fair 29.4% |
| Immigrants | Germany | 30.4 /100 | #190 | Fair 29.5% |
| Immigrants | Trinidad and Tobago | 29.2 /100 | #191 | Fair 29.5% |
| Moroccans | 28.6 /100 | #192 | Fair 29.5% |
| Basques | 28.3 /100 | #193 | Fair 29.5% |
| Icelanders | 26.1 /100 | #194 | Fair 29.5% |