West Indian vs Argentinean 2 or more Vehicles in Household
COMPARE
West Indian
Argentinean
2 or more Vehicles in Household
2 or more Vehicles in Household Comparison
West Indians
Argentineans
41.3%
2 OR MORE VEHICLES IN HOUSEHOLD
0.0/ 100
METRIC RATING
331st/ 347
METRIC RANK
54.5%
2 OR MORE VEHICLES IN HOUSEHOLD
17.5/ 100
METRIC RATING
197th/ 347
METRIC RANK
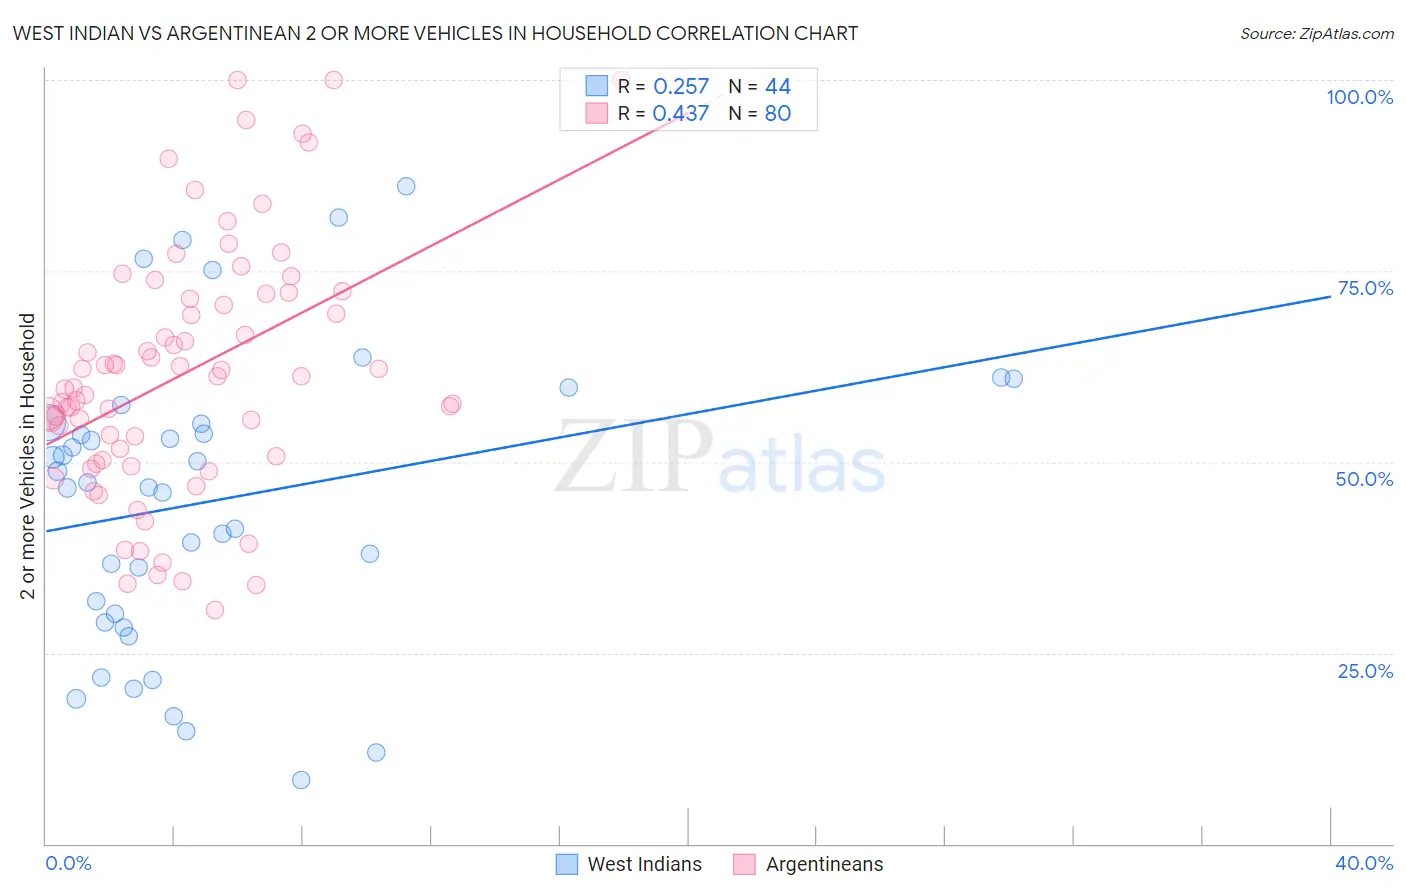
West Indian vs Argentinean 2 or more Vehicles in Household Correlation Chart
The statistical analysis conducted on geographies consisting of 253,888,227 people shows a weak positive correlation between the proportion of West Indians and percentage of households with 2 or more vehicles available in the United States with a correlation coefficient (R) of 0.257 and weighted average of 41.3%. Similarly, the statistical analysis conducted on geographies consisting of 297,010,599 people shows a moderate positive correlation between the proportion of Argentineans and percentage of households with 2 or more vehicles available in the United States with a correlation coefficient (R) of 0.437 and weighted average of 54.5%, a difference of 32.0%.
2 or more Vehicles in Household Correlation Summary
| Measurement | West Indian | Argentinean |
| Minimum | 8.3% | 30.7% |
| Maximum | 86.1% | 100.0% |
| Range | 77.8% | 69.3% |
| Mean | 44.9% | 61.6% |
| Median | 47.0% | 60.4% |
| Interquartile 25% (IQ1) | 29.6% | 50.4% |
| Interquartile 75% (IQ3) | 55.1% | 71.7% |
| Interquartile Range (IQR) | 25.5% | 21.3% |
| Standard Deviation (Sample) | 19.3% | 16.3% |
| Standard Deviation (Population) | 19.1% | 16.2% |
Similar Demographics by 2 or more Vehicles in Household
Demographics Similar to West Indians by 2 or more Vehicles in Household
In terms of 2 or more vehicles in household, the demographic groups most similar to West Indians are Immigrants from Dominica (41.6%, a difference of 0.85%), Trinidadian and Tobagonian (40.9%, a difference of 0.98%), Ecuadorian (42.0%, a difference of 1.7%), Immigrants from Ecuador (40.5%, a difference of 1.9%), and Immigrants from Trinidad and Tobago (40.3%, a difference of 2.5%).
| Demographics | Rating | Rank | 2 or more Vehicles in Household |
| Immigrants | Cabo Verde | 0.0 /100 | #324 | Tragic 43.3% |
| Immigrants | West Indies | 0.0 /100 | #325 | Tragic 43.1% |
| Immigrants | Senegal | 0.0 /100 | #326 | Tragic 43.0% |
| Immigrants | Yemen | 0.0 /100 | #327 | Tragic 42.8% |
| Inupiat | 0.0 /100 | #328 | Tragic 42.6% |
| Ecuadorians | 0.0 /100 | #329 | Tragic 42.0% |
| Immigrants | Dominica | 0.0 /100 | #330 | Tragic 41.6% |
| West Indians | 0.0 /100 | #331 | Tragic 41.3% |
| Trinidadians and Tobagonians | 0.0 /100 | #332 | Tragic 40.9% |
| Immigrants | Ecuador | 0.0 /100 | #333 | Tragic 40.5% |
| Immigrants | Trinidad and Tobago | 0.0 /100 | #334 | Tragic 40.3% |
| Immigrants | Bangladesh | 0.0 /100 | #335 | Tragic 38.8% |
| Vietnamese | 0.0 /100 | #336 | Tragic 38.5% |
| Barbadians | 0.0 /100 | #337 | Tragic 38.3% |
| Immigrants | Uzbekistan | 0.0 /100 | #338 | Tragic 37.9% |
Demographics Similar to Argentineans by 2 or more Vehicles in Household
In terms of 2 or more vehicles in household, the demographic groups most similar to Argentineans are Carpatho Rusyn (54.4%, a difference of 0.090%), Immigrants from Poland (54.6%, a difference of 0.12%), Immigrants from Norway (54.4%, a difference of 0.12%), Houma (54.4%, a difference of 0.12%), and Immigrants from Italy (54.4%, a difference of 0.15%).
| Demographics | Rating | Rank | 2 or more Vehicles in Household |
| Russians | 26.3 /100 | #190 | Fair 54.8% |
| Immigrants | Immigrants | 25.0 /100 | #191 | Fair 54.7% |
| Immigrants | Romania | 23.8 /100 | #192 | Fair 54.7% |
| Immigrants | Japan | 23.4 /100 | #193 | Fair 54.7% |
| Central Americans | 23.0 /100 | #194 | Fair 54.7% |
| Iroquois | 22.6 /100 | #195 | Fair 54.7% |
| Immigrants | Poland | 19.3 /100 | #196 | Poor 54.6% |
| Argentineans | 17.5 /100 | #197 | Poor 54.5% |
| Carpatho Rusyns | 16.2 /100 | #198 | Poor 54.4% |
| Immigrants | Norway | 15.9 /100 | #199 | Poor 54.4% |
| Houma | 15.8 /100 | #200 | Poor 54.4% |
| Immigrants | Italy | 15.5 /100 | #201 | Poor 54.4% |
| Immigrants | North Macedonia | 14.9 /100 | #202 | Poor 54.4% |
| Immigrants | Peru | 14.3 /100 | #203 | Poor 54.4% |
| Immigrants | Belgium | 13.7 /100 | #204 | Poor 54.3% |