Immigrants from Vietnam vs Argentinean 2 or more Vehicles in Household
COMPARE
Immigrants from Vietnam
Argentinean
2 or more Vehicles in Household
2 or more Vehicles in Household Comparison
Immigrants from Vietnam
Argentineans
60.9%
2 OR MORE VEHICLES IN HOUSEHOLD
100.0/ 100
METRIC RATING
24th/ 347
METRIC RANK
54.5%
2 OR MORE VEHICLES IN HOUSEHOLD
17.5/ 100
METRIC RATING
197th/ 347
METRIC RANK
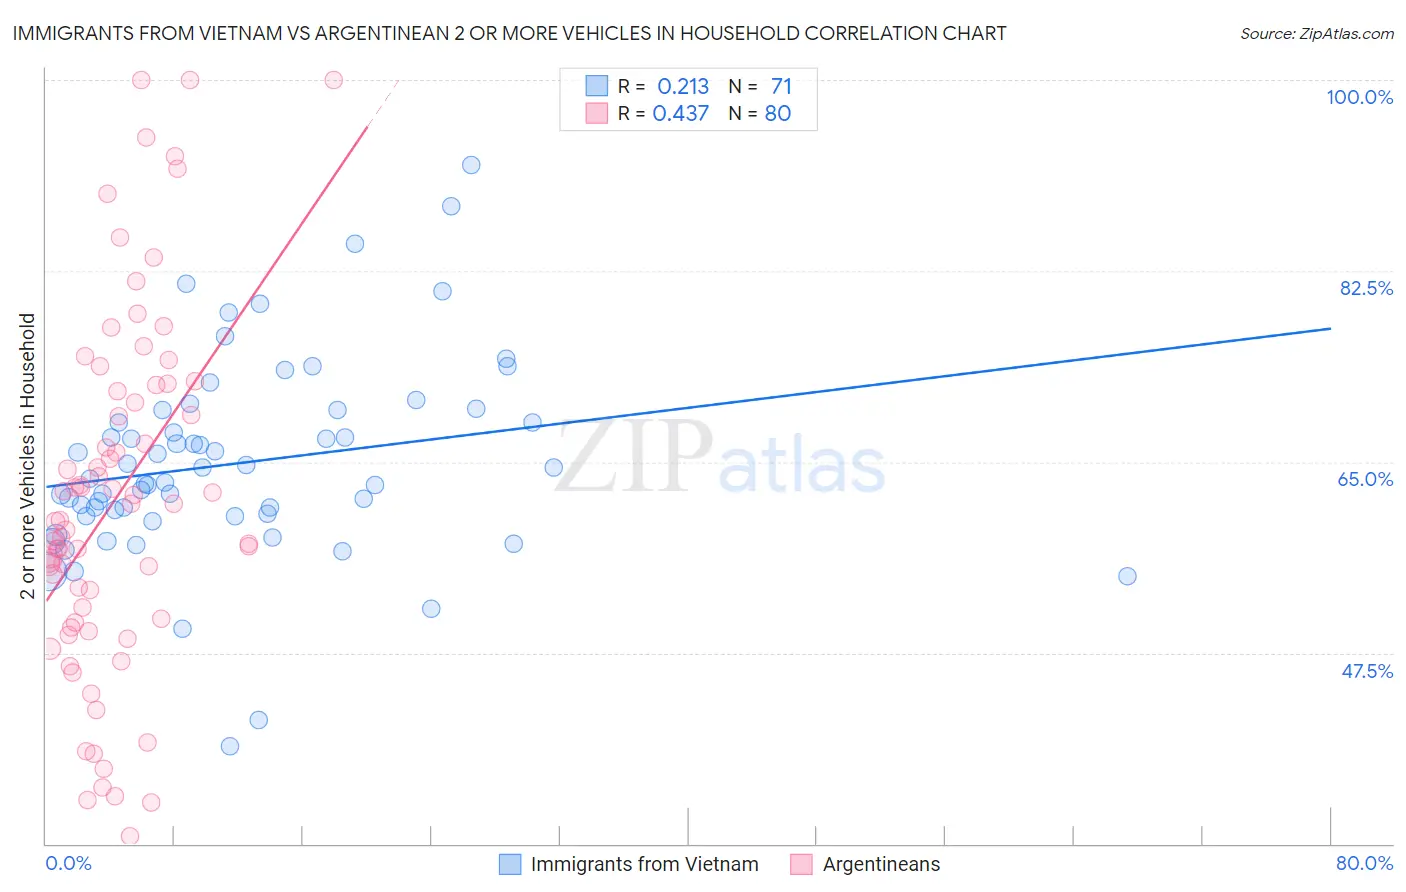
Immigrants from Vietnam vs Argentinean 2 or more Vehicles in Household Correlation Chart
The statistical analysis conducted on geographies consisting of 404,606,887 people shows a weak positive correlation between the proportion of Immigrants from Vietnam and percentage of households with 2 or more vehicles available in the United States with a correlation coefficient (R) of 0.213 and weighted average of 60.9%. Similarly, the statistical analysis conducted on geographies consisting of 297,010,599 people shows a moderate positive correlation between the proportion of Argentineans and percentage of households with 2 or more vehicles available in the United States with a correlation coefficient (R) of 0.437 and weighted average of 54.5%, a difference of 11.8%.
2 or more Vehicles in Household Correlation Summary
| Measurement | Immigrants from Vietnam | Argentinean |
| Minimum | 38.9% | 30.7% |
| Maximum | 92.3% | 100.0% |
| Range | 53.4% | 69.3% |
| Mean | 64.9% | 61.6% |
| Median | 63.5% | 60.4% |
| Interquartile 25% (IQ1) | 60.1% | 50.4% |
| Interquartile 75% (IQ3) | 69.7% | 71.7% |
| Interquartile Range (IQR) | 9.7% | 21.3% |
| Standard Deviation (Sample) | 9.2% | 16.3% |
| Standard Deviation (Population) | 9.2% | 16.2% |
Similar Demographics by 2 or more Vehicles in Household
Demographics Similar to Immigrants from Vietnam by 2 or more Vehicles in Household
In terms of 2 or more vehicles in household, the demographic groups most similar to Immigrants from Vietnam are Scotch-Irish (60.9%, a difference of 0.040%), Swiss (61.0%, a difference of 0.070%), Korean (61.0%, a difference of 0.11%), White/Caucasian (60.8%, a difference of 0.15%), and Sri Lankan (61.0%, a difference of 0.16%).
| Demographics | Rating | Rank | 2 or more Vehicles in Household |
| Basques | 100.0 /100 | #17 | Exceptional 61.4% |
| Europeans | 100.0 /100 | #18 | Exceptional 61.4% |
| Scottish | 100.0 /100 | #19 | Exceptional 61.2% |
| Sri Lankans | 100.0 /100 | #20 | Exceptional 61.0% |
| Koreans | 100.0 /100 | #21 | Exceptional 61.0% |
| Swiss | 100.0 /100 | #22 | Exceptional 61.0% |
| Scotch-Irish | 100.0 /100 | #23 | Exceptional 60.9% |
| Immigrants | Vietnam | 100.0 /100 | #24 | Exceptional 60.9% |
| Whites/Caucasians | 100.0 /100 | #25 | Exceptional 60.8% |
| Welsh | 100.0 /100 | #26 | Exceptional 60.8% |
| Assyrians/Chaldeans/Syriacs | 100.0 /100 | #27 | Exceptional 60.5% |
| Guamanians/Chamorros | 100.0 /100 | #28 | Exceptional 60.5% |
| Hawaiians | 100.0 /100 | #29 | Exceptional 60.4% |
| Finns | 100.0 /100 | #30 | Exceptional 60.3% |
| Spanish American Indians | 100.0 /100 | #31 | Exceptional 60.3% |
Demographics Similar to Argentineans by 2 or more Vehicles in Household
In terms of 2 or more vehicles in household, the demographic groups most similar to Argentineans are Carpatho Rusyn (54.4%, a difference of 0.090%), Immigrants from Poland (54.6%, a difference of 0.12%), Immigrants from Norway (54.4%, a difference of 0.12%), Houma (54.4%, a difference of 0.12%), and Immigrants from Italy (54.4%, a difference of 0.15%).
| Demographics | Rating | Rank | 2 or more Vehicles in Household |
| Russians | 26.3 /100 | #190 | Fair 54.8% |
| Immigrants | Immigrants | 25.0 /100 | #191 | Fair 54.7% |
| Immigrants | Romania | 23.8 /100 | #192 | Fair 54.7% |
| Immigrants | Japan | 23.4 /100 | #193 | Fair 54.7% |
| Central Americans | 23.0 /100 | #194 | Fair 54.7% |
| Iroquois | 22.6 /100 | #195 | Fair 54.7% |
| Immigrants | Poland | 19.3 /100 | #196 | Poor 54.6% |
| Argentineans | 17.5 /100 | #197 | Poor 54.5% |
| Carpatho Rusyns | 16.2 /100 | #198 | Poor 54.4% |
| Immigrants | Norway | 15.9 /100 | #199 | Poor 54.4% |
| Houma | 15.8 /100 | #200 | Poor 54.4% |
| Immigrants | Italy | 15.5 /100 | #201 | Poor 54.4% |
| Immigrants | North Macedonia | 14.9 /100 | #202 | Poor 54.4% |
| Immigrants | Peru | 14.3 /100 | #203 | Poor 54.4% |
| Immigrants | Belgium | 13.7 /100 | #204 | Poor 54.3% |