Welsh vs South American 1 or more Vehicles in Household
COMPARE
Welsh
South American
1 or more Vehicles in Household
1 or more Vehicles in Household Comparison
Welsh
South Americans
93.0%
1 OR MORE VEHICLES IN HOUSEHOLD
100.0/ 100
METRIC RATING
18th/ 347
METRIC RANK
89.5%
1 OR MORE VEHICLES IN HOUSEHOLD
39.6/ 100
METRIC RATING
187th/ 347
METRIC RANK
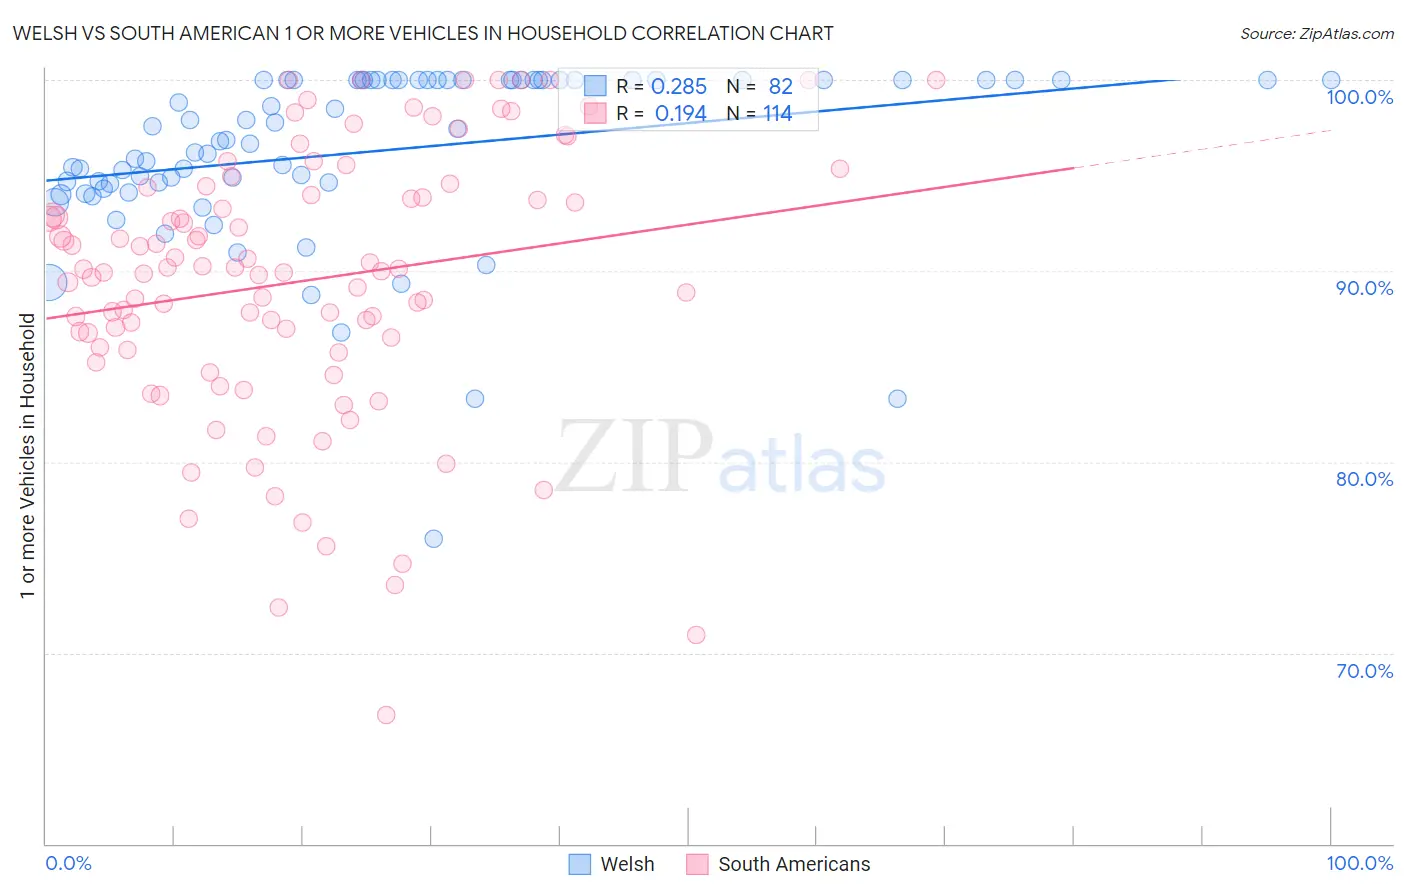
Welsh vs South American 1 or more Vehicles in Household Correlation Chart
The statistical analysis conducted on geographies consisting of 528,258,241 people shows a weak positive correlation between the proportion of Welsh and percentage of households with 1 or more vehicles available in the United States with a correlation coefficient (R) of 0.285 and weighted average of 93.0%. Similarly, the statistical analysis conducted on geographies consisting of 482,231,258 people shows a poor positive correlation between the proportion of South Americans and percentage of households with 1 or more vehicles available in the United States with a correlation coefficient (R) of 0.194 and weighted average of 89.5%, a difference of 3.8%.
1 or more Vehicles in Household Correlation Summary
| Measurement | Welsh | South American |
| Minimum | 75.9% | 66.8% |
| Maximum | 100.0% | 100.0% |
| Range | 24.1% | 33.2% |
| Mean | 96.3% | 89.4% |
| Median | 97.1% | 90.0% |
| Interquartile 25% (IQ1) | 94.6% | 86.0% |
| Interquartile 75% (IQ3) | 100.0% | 94.0% |
| Interquartile Range (IQR) | 5.4% | 8.0% |
| Standard Deviation (Sample) | 4.6% | 7.0% |
| Standard Deviation (Population) | 4.5% | 7.0% |
Similar Demographics by 1 or more Vehicles in Household
Demographics Similar to Welsh by 1 or more Vehicles in Household
In terms of 1 or more vehicles in household, the demographic groups most similar to Welsh are European (93.0%, a difference of 0.040%), Mexican (93.0%, a difference of 0.060%), Assyrian/Chaldean/Syriac (93.0%, a difference of 0.060%), Irish (93.1%, a difference of 0.080%), and White/Caucasian (93.1%, a difference of 0.12%).
| Demographics | Rating | Rank | 1 or more Vehicles in Household |
| Czechs | 100.0 /100 | #11 | Exceptional 93.3% |
| Scandinavians | 100.0 /100 | #12 | Exceptional 93.1% |
| Whites/Caucasians | 100.0 /100 | #13 | Exceptional 93.1% |
| Irish | 100.0 /100 | #14 | Exceptional 93.1% |
| Mexicans | 100.0 /100 | #15 | Exceptional 93.0% |
| Assyrians/Chaldeans/Syriacs | 100.0 /100 | #16 | Exceptional 93.0% |
| Europeans | 100.0 /100 | #17 | Exceptional 93.0% |
| Welsh | 100.0 /100 | #18 | Exceptional 93.0% |
| Tongans | 100.0 /100 | #19 | Exceptional 92.9% |
| Arapaho | 100.0 /100 | #20 | Exceptional 92.7% |
| Ottawa | 100.0 /100 | #21 | Exceptional 92.7% |
| French | 100.0 /100 | #22 | Exceptional 92.7% |
| Nepalese | 100.0 /100 | #23 | Exceptional 92.6% |
| Yaqui | 100.0 /100 | #24 | Exceptional 92.6% |
| Immigrants | Iraq | 100.0 /100 | #25 | Exceptional 92.5% |
Demographics Similar to South Americans by 1 or more Vehicles in Household
In terms of 1 or more vehicles in household, the demographic groups most similar to South Americans are Immigrants from Brazil (89.6%, a difference of 0.010%), Pueblo (89.6%, a difference of 0.010%), Immigrants from Nepal (89.5%, a difference of 0.010%), Immigrants from Bulgaria (89.6%, a difference of 0.020%), and Ethiopian (89.6%, a difference of 0.030%).
| Demographics | Rating | Rank | 1 or more Vehicles in Household |
| Arabs | 43.3 /100 | #180 | Average 89.6% |
| Immigrants | Ethiopia | 42.5 /100 | #181 | Average 89.6% |
| Ukrainians | 42.4 /100 | #182 | Average 89.6% |
| Ethiopians | 41.2 /100 | #183 | Average 89.6% |
| Immigrants | Bulgaria | 40.7 /100 | #184 | Average 89.6% |
| Immigrants | Brazil | 40.1 /100 | #185 | Average 89.6% |
| Pueblo | 39.9 /100 | #186 | Fair 89.6% |
| South Americans | 39.6 /100 | #187 | Fair 89.5% |
| Immigrants | Nepal | 38.9 /100 | #188 | Fair 89.5% |
| Carpatho Rusyns | 37.8 /100 | #189 | Fair 89.5% |
| Shoshone | 37.5 /100 | #190 | Fair 89.5% |
| Immigrants | Poland | 37.1 /100 | #191 | Fair 89.5% |
| Immigrants | North Macedonia | 36.5 /100 | #192 | Fair 89.5% |
| Immigrants | Northern Europe | 35.5 /100 | #193 | Fair 89.5% |
| Immigrants | Eritrea | 33.2 /100 | #194 | Fair 89.4% |