Welsh vs South American Male Unemployment
COMPARE
Welsh
South American
Male Unemployment
Male Unemployment Comparison
Welsh
South Americans
4.8%
MALE UNEMPLOYMENT
99.7/ 100
METRIC RATING
34th/ 347
METRIC RANK
5.3%
MALE UNEMPLOYMENT
60.6/ 100
METRIC RATING
165th/ 347
METRIC RANK
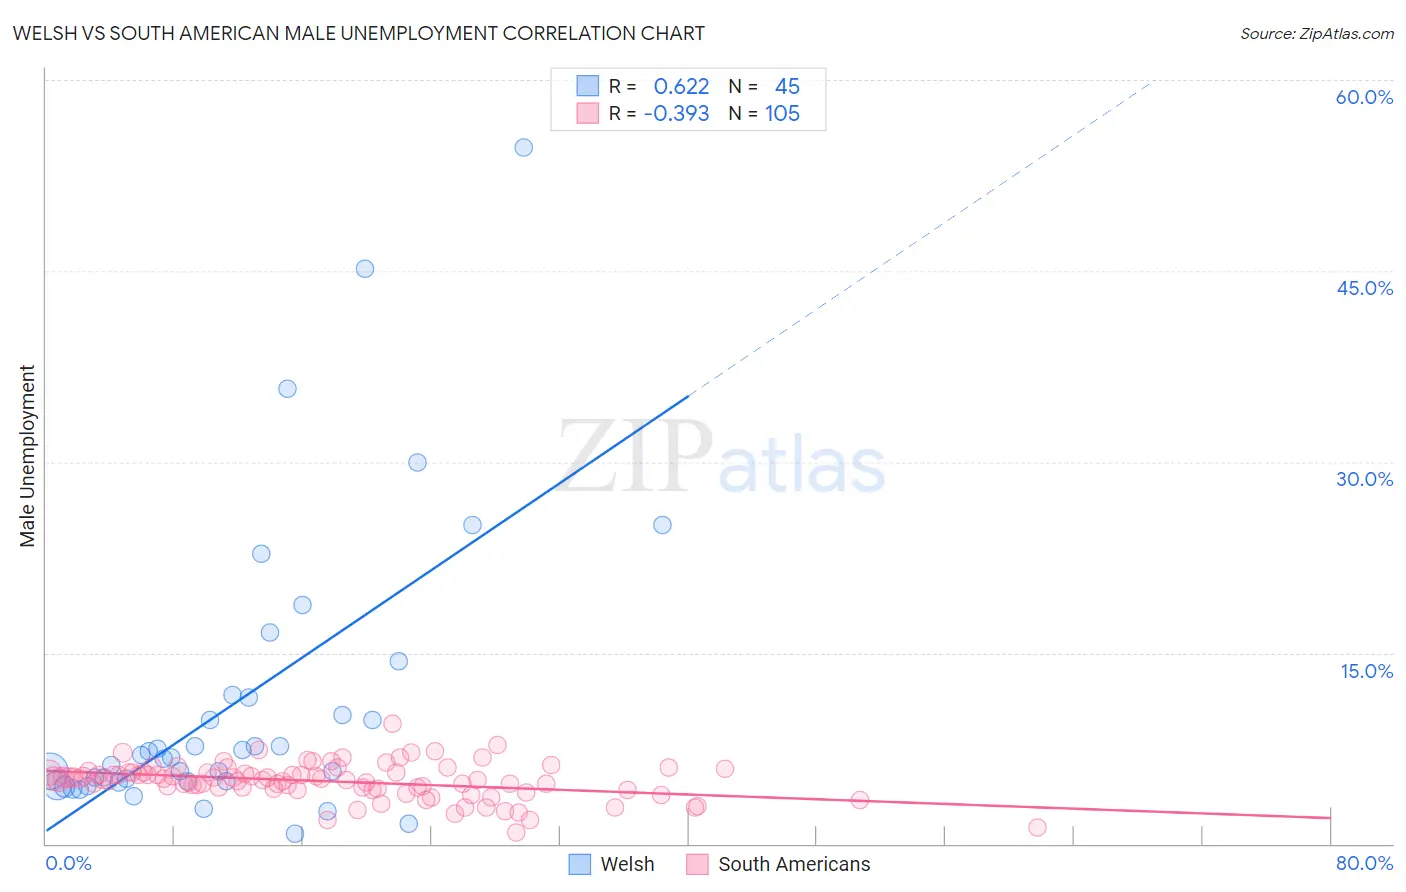
Welsh vs South American Male Unemployment Correlation Chart
The statistical analysis conducted on geographies consisting of 521,279,877 people shows a significant positive correlation between the proportion of Welsh and unemployment rate among males in the United States with a correlation coefficient (R) of 0.622 and weighted average of 4.8%. Similarly, the statistical analysis conducted on geographies consisting of 490,586,093 people shows a mild negative correlation between the proportion of South Americans and unemployment rate among males in the United States with a correlation coefficient (R) of -0.393 and weighted average of 5.3%, a difference of 8.5%.
Male Unemployment Correlation Summary
| Measurement | Welsh | South American |
| Minimum | 0.80% | 0.90% |
| Maximum | 54.7% | 9.5% |
| Range | 53.9% | 8.6% |
| Mean | 11.1% | 4.9% |
| Median | 6.8% | 5.1% |
| Interquartile 25% (IQ1) | 4.9% | 4.3% |
| Interquartile 75% (IQ3) | 11.6% | 5.6% |
| Interquartile Range (IQR) | 6.7% | 1.3% |
| Standard Deviation (Sample) | 11.5% | 1.4% |
| Standard Deviation (Population) | 11.3% | 1.4% |
Similar Demographics by Male Unemployment
Demographics Similar to Welsh by Male Unemployment
In terms of male unemployment, the demographic groups most similar to Welsh are Latvian (4.8%, a difference of 0.080%), Immigrants from Nepal (4.8%, a difference of 0.38%), Sudanese (4.8%, a difference of 0.40%), British (4.8%, a difference of 0.65%), and Paraguayan (4.9%, a difference of 0.85%).
| Demographics | Rating | Rank | Male Unemployment |
| Belgians | 99.9 /100 | #27 | Exceptional 4.8% |
| Bulgarians | 99.8 /100 | #28 | Exceptional 4.8% |
| Scottish | 99.8 /100 | #29 | Exceptional 4.8% |
| British | 99.8 /100 | #30 | Exceptional 4.8% |
| Sudanese | 99.8 /100 | #31 | Exceptional 4.8% |
| Immigrants | Nepal | 99.8 /100 | #32 | Exceptional 4.8% |
| Latvians | 99.7 /100 | #33 | Exceptional 4.8% |
| Welsh | 99.7 /100 | #34 | Exceptional 4.8% |
| Paraguayans | 99.5 /100 | #35 | Exceptional 4.9% |
| Immigrants | Singapore | 99.4 /100 | #36 | Exceptional 4.9% |
| Scotch-Irish | 99.4 /100 | #37 | Exceptional 4.9% |
| Immigrants | Bosnia and Herzegovina | 99.4 /100 | #38 | Exceptional 4.9% |
| Burmese | 99.3 /100 | #39 | Exceptional 4.9% |
| Northern Europeans | 99.3 /100 | #40 | Exceptional 4.9% |
| Chinese | 99.3 /100 | #41 | Exceptional 4.9% |
Demographics Similar to South Americans by Male Unemployment
In terms of male unemployment, the demographic groups most similar to South Americans are Immigrants from Morocco (5.3%, a difference of 0.030%), Afghan (5.3%, a difference of 0.080%), Immigrants from Vietnam (5.3%, a difference of 0.15%), Immigrants from Ireland (5.3%, a difference of 0.18%), and Immigrants from Congo (5.3%, a difference of 0.20%).
| Demographics | Rating | Rank | Male Unemployment |
| Immigrants | Indonesia | 71.5 /100 | #158 | Good 5.2% |
| Indonesians | 71.2 /100 | #159 | Good 5.2% |
| Immigrants | Norway | 71.0 /100 | #160 | Good 5.2% |
| Immigrants | China | 70.6 /100 | #161 | Good 5.2% |
| Immigrants | Egypt | 65.9 /100 | #162 | Good 5.2% |
| Immigrants | Hong Kong | 65.7 /100 | #163 | Good 5.2% |
| Afghans | 62.0 /100 | #164 | Good 5.3% |
| South Americans | 60.6 /100 | #165 | Good 5.3% |
| Immigrants | Morocco | 60.2 /100 | #166 | Good 5.3% |
| Immigrants | Vietnam | 58.1 /100 | #167 | Average 5.3% |
| Immigrants | Ireland | 57.7 /100 | #168 | Average 5.3% |
| Immigrants | Congo | 57.4 /100 | #169 | Average 5.3% |
| Immigrants | Eastern Europe | 54.1 /100 | #170 | Average 5.3% |
| Peruvians | 51.9 /100 | #171 | Average 5.3% |
| Immigrants | Kazakhstan | 50.8 /100 | #172 | Average 5.3% |