U.S. Virgin Islander vs Immigrants from Poland 1 or more Vehicles in Household
COMPARE
U.S. Virgin Islander
Immigrants from Poland
1 or more Vehicles in Household
1 or more Vehicles in Household Comparison
U.S. Virgin Islanders
Immigrants from Poland
84.6%
1 OR MORE VEHICLES IN HOUSEHOLD
0.0/ 100
METRIC RATING
310th/ 347
METRIC RANK
89.5%
1 OR MORE VEHICLES IN HOUSEHOLD
37.1/ 100
METRIC RATING
191st/ 347
METRIC RANK
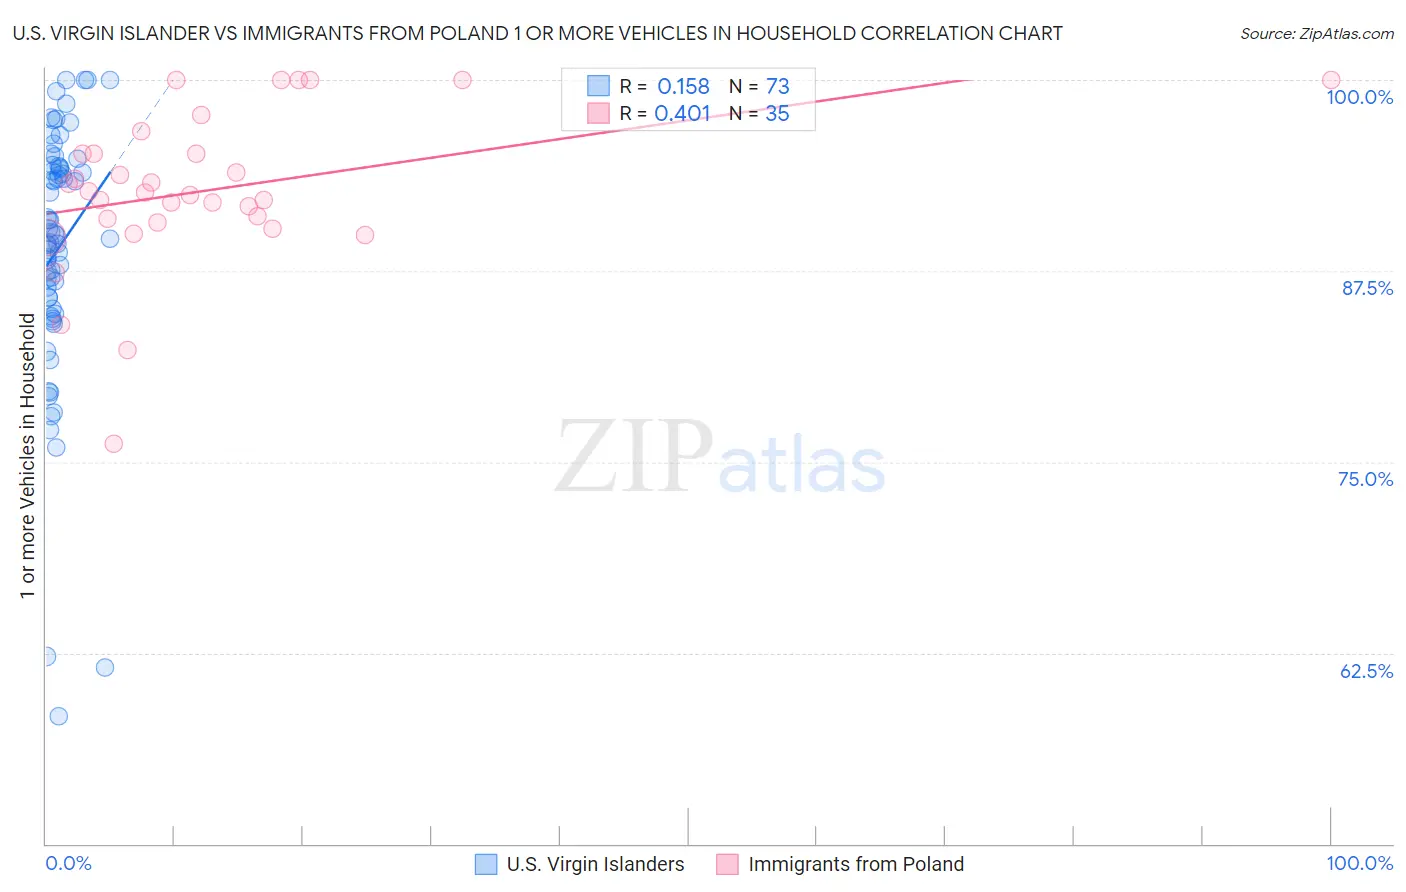
U.S. Virgin Islander vs Immigrants from Poland 1 or more Vehicles in Household Correlation Chart
The statistical analysis conducted on geographies consisting of 87,430,721 people shows a poor positive correlation between the proportion of U.S. Virgin Islanders and percentage of households with 1 or more vehicles available in the United States with a correlation coefficient (R) of 0.158 and weighted average of 84.6%. Similarly, the statistical analysis conducted on geographies consisting of 304,721,875 people shows a moderate positive correlation between the proportion of Immigrants from Poland and percentage of households with 1 or more vehicles available in the United States with a correlation coefficient (R) of 0.401 and weighted average of 89.5%, a difference of 5.8%.
1 or more Vehicles in Household Correlation Summary
| Measurement | U.S. Virgin Islander | Immigrants from Poland |
| Minimum | 58.3% | 76.2% |
| Maximum | 100.0% | 100.0% |
| Range | 41.7% | 23.8% |
| Mean | 88.9% | 92.8% |
| Median | 89.9% | 92.6% |
| Interquartile 25% (IQ1) | 85.4% | 90.7% |
| Interquartile 75% (IQ3) | 94.3% | 95.2% |
| Interquartile Range (IQR) | 8.9% | 4.5% |
| Standard Deviation (Sample) | 8.4% | 5.2% |
| Standard Deviation (Population) | 8.3% | 5.1% |
Similar Demographics by 1 or more Vehicles in Household
Demographics Similar to U.S. Virgin Islanders by 1 or more Vehicles in Household
In terms of 1 or more vehicles in household, the demographic groups most similar to U.S. Virgin Islanders are Immigrants from Haiti (84.7%, a difference of 0.030%), Immigrants from Belize (84.7%, a difference of 0.040%), Puerto Rican (84.6%, a difference of 0.040%), Tohono O'odham (84.7%, a difference of 0.070%), and Cape Verdean (84.5%, a difference of 0.15%).
| Demographics | Rating | Rank | 1 or more Vehicles in Household |
| Immigrants | Greece | 0.0 /100 | #303 | Tragic 85.4% |
| Immigrants | Ukraine | 0.0 /100 | #304 | Tragic 85.2% |
| Immigrants | China | 0.0 /100 | #305 | Tragic 84.9% |
| Immigrants | Western Africa | 0.0 /100 | #306 | Tragic 84.9% |
| Tohono O'odham | 0.0 /100 | #307 | Tragic 84.7% |
| Immigrants | Belize | 0.0 /100 | #308 | Tragic 84.7% |
| Immigrants | Haiti | 0.0 /100 | #309 | Tragic 84.7% |
| U.S. Virgin Islanders | 0.0 /100 | #310 | Tragic 84.6% |
| Puerto Ricans | 0.0 /100 | #311 | Tragic 84.6% |
| Cape Verdeans | 0.0 /100 | #312 | Tragic 84.5% |
| Immigrants | Israel | 0.0 /100 | #313 | Tragic 84.5% |
| Albanians | 0.0 /100 | #314 | Tragic 84.4% |
| Cypriots | 0.0 /100 | #315 | Tragic 84.4% |
| Alaska Natives | 0.0 /100 | #316 | Tragic 83.8% |
| Ghanaians | 0.0 /100 | #317 | Tragic 83.6% |
Demographics Similar to Immigrants from Poland by 1 or more Vehicles in Household
In terms of 1 or more vehicles in household, the demographic groups most similar to Immigrants from Poland are Carpatho Rusyn (89.5%, a difference of 0.010%), Shoshone (89.5%, a difference of 0.010%), Immigrants from North Macedonia (89.5%, a difference of 0.010%), Immigrants from Nepal (89.5%, a difference of 0.030%), and Immigrants from Northern Europe (89.5%, a difference of 0.030%).
| Demographics | Rating | Rank | 1 or more Vehicles in Household |
| Immigrants | Bulgaria | 40.7 /100 | #184 | Average 89.6% |
| Immigrants | Brazil | 40.1 /100 | #185 | Average 89.6% |
| Pueblo | 39.9 /100 | #186 | Fair 89.6% |
| South Americans | 39.6 /100 | #187 | Fair 89.5% |
| Immigrants | Nepal | 38.9 /100 | #188 | Fair 89.5% |
| Carpatho Rusyns | 37.8 /100 | #189 | Fair 89.5% |
| Shoshone | 37.5 /100 | #190 | Fair 89.5% |
| Immigrants | Poland | 37.1 /100 | #191 | Fair 89.5% |
| Immigrants | North Macedonia | 36.5 /100 | #192 | Fair 89.5% |
| Immigrants | Northern Europe | 35.5 /100 | #193 | Fair 89.5% |
| Immigrants | Eritrea | 33.2 /100 | #194 | Fair 89.4% |
| Immigrants | Armenia | 31.8 /100 | #195 | Fair 89.4% |
| Crow | 24.3 /100 | #196 | Fair 89.3% |
| Immigrants | Sweden | 23.6 /100 | #197 | Fair 89.3% |
| Pennsylvania Germans | 22.9 /100 | #198 | Fair 89.3% |