Uruguayan vs Immigrants from England 1 or more Vehicles in Household
COMPARE
Uruguayan
Immigrants from England
1 or more Vehicles in Household
1 or more Vehicles in Household Comparison
Uruguayans
Immigrants from England
88.8%
1 OR MORE VEHICLES IN HOUSEHOLD
7.0/ 100
METRIC RATING
222nd/ 347
METRIC RANK
91.4%
1 OR MORE VEHICLES IN HOUSEHOLD
99.3/ 100
METRIC RATING
83rd/ 347
METRIC RANK
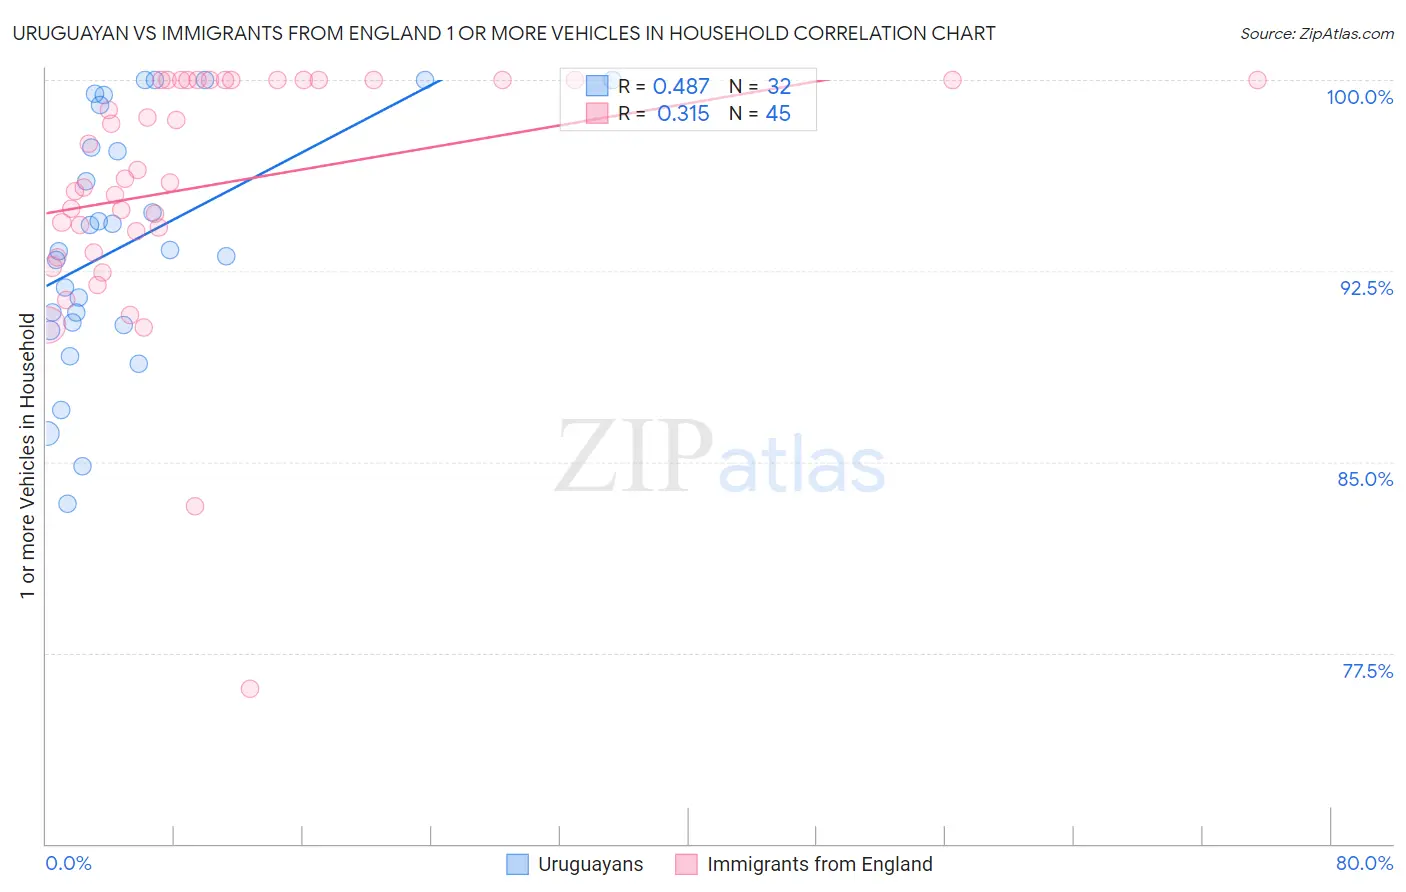
Uruguayan vs Immigrants from England 1 or more Vehicles in Household Correlation Chart
The statistical analysis conducted on geographies consisting of 144,759,773 people shows a moderate positive correlation between the proportion of Uruguayans and percentage of households with 1 or more vehicles available in the United States with a correlation coefficient (R) of 0.487 and weighted average of 88.8%. Similarly, the statistical analysis conducted on geographies consisting of 391,777,115 people shows a mild positive correlation between the proportion of Immigrants from England and percentage of households with 1 or more vehicles available in the United States with a correlation coefficient (R) of 0.315 and weighted average of 91.4%, a difference of 3.0%.
1 or more Vehicles in Household Correlation Summary
| Measurement | Uruguayan | Immigrants from England |
| Minimum | 83.3% | 76.1% |
| Maximum | 100.0% | 100.0% |
| Range | 16.7% | 23.9% |
| Mean | 93.6% | 95.9% |
| Median | 93.3% | 96.1% |
| Interquartile 25% (IQ1) | 90.4% | 93.6% |
| Interquartile 75% (IQ3) | 98.2% | 100.0% |
| Interquartile Range (IQR) | 7.7% | 6.4% |
| Standard Deviation (Sample) | 4.8% | 4.8% |
| Standard Deviation (Population) | 4.7% | 4.8% |
Similar Demographics by 1 or more Vehicles in Household
Demographics Similar to Uruguayans by 1 or more Vehicles in Household
In terms of 1 or more vehicles in household, the demographic groups most similar to Uruguayans are Immigrants from South America (88.8%, a difference of 0.0%), Peruvian (88.8%, a difference of 0.050%), Immigrants from Hong Kong (88.7%, a difference of 0.050%), Cree (88.7%, a difference of 0.060%), and Immigrants from Zaire (88.8%, a difference of 0.070%).
| Demographics | Rating | Rank | 1 or more Vehicles in Household |
| Immigrants | Sri Lanka | 10.2 /100 | #215 | Poor 88.9% |
| Immigrants | Argentina | 9.4 /100 | #216 | Tragic 88.9% |
| Argentineans | 8.8 /100 | #217 | Tragic 88.9% |
| Ugandans | 8.7 /100 | #218 | Tragic 88.9% |
| Immigrants | Guatemala | 8.6 /100 | #219 | Tragic 88.9% |
| Immigrants | Zaire | 8.1 /100 | #220 | Tragic 88.8% |
| Peruvians | 7.9 /100 | #221 | Tragic 88.8% |
| Uruguayans | 7.0 /100 | #222 | Tragic 88.8% |
| Immigrants | South America | 7.0 /100 | #223 | Tragic 88.8% |
| Immigrants | Hong Kong | 6.2 /100 | #224 | Tragic 88.7% |
| Cree | 6.0 /100 | #225 | Tragic 88.7% |
| Cheyenne | 5.7 /100 | #226 | Tragic 88.7% |
| Ute | 5.6 /100 | #227 | Tragic 88.7% |
| Immigrants | Norway | 5.5 /100 | #228 | Tragic 88.7% |
| Immigrants | Romania | 5.4 /100 | #229 | Tragic 88.7% |
Demographics Similar to Immigrants from England by 1 or more Vehicles in Household
In terms of 1 or more vehicles in household, the demographic groups most similar to Immigrants from England are Lebanese (91.4%, a difference of 0.0%), Immigrants from South Eastern Asia (91.4%, a difference of 0.010%), Jordanian (91.4%, a difference of 0.010%), Tsimshian (91.4%, a difference of 0.020%), and Bolivian (91.5%, a difference of 0.040%).
| Demographics | Rating | Rank | 1 or more Vehicles in Household |
| Cubans | 99.5 /100 | #76 | Exceptional 91.5% |
| Immigrants | Philippines | 99.4 /100 | #77 | Exceptional 91.5% |
| Iranians | 99.4 /100 | #78 | Exceptional 91.5% |
| Immigrants | South Central Asia | 99.4 /100 | #79 | Exceptional 91.5% |
| Bolivians | 99.4 /100 | #80 | Exceptional 91.5% |
| Immigrants | South Eastern Asia | 99.3 /100 | #81 | Exceptional 91.4% |
| Lebanese | 99.3 /100 | #82 | Exceptional 91.4% |
| Immigrants | England | 99.3 /100 | #83 | Exceptional 91.4% |
| Jordanians | 99.3 /100 | #84 | Exceptional 91.4% |
| Tsimshian | 99.3 /100 | #85 | Exceptional 91.4% |
| Osage | 99.2 /100 | #86 | Exceptional 91.4% |
| Immigrants | Germany | 99.2 /100 | #87 | Exceptional 91.4% |
| Spanish Americans | 99.2 /100 | #88 | Exceptional 91.4% |
| Bangladeshis | 99.2 /100 | #89 | Exceptional 91.4% |
| Immigrants | Canada | 99.2 /100 | #90 | Exceptional 91.4% |