Maltese vs Cape Verdean 1 or more Vehicles in Household
COMPARE
Maltese
Cape Verdean
1 or more Vehicles in Household
1 or more Vehicles in Household Comparison
Maltese
Cape Verdeans
91.0%
1 OR MORE VEHICLES IN HOUSEHOLD
97.7/ 100
METRIC RATING
107th/ 347
METRIC RANK
84.5%
1 OR MORE VEHICLES IN HOUSEHOLD
0.0/ 100
METRIC RATING
312th/ 347
METRIC RANK
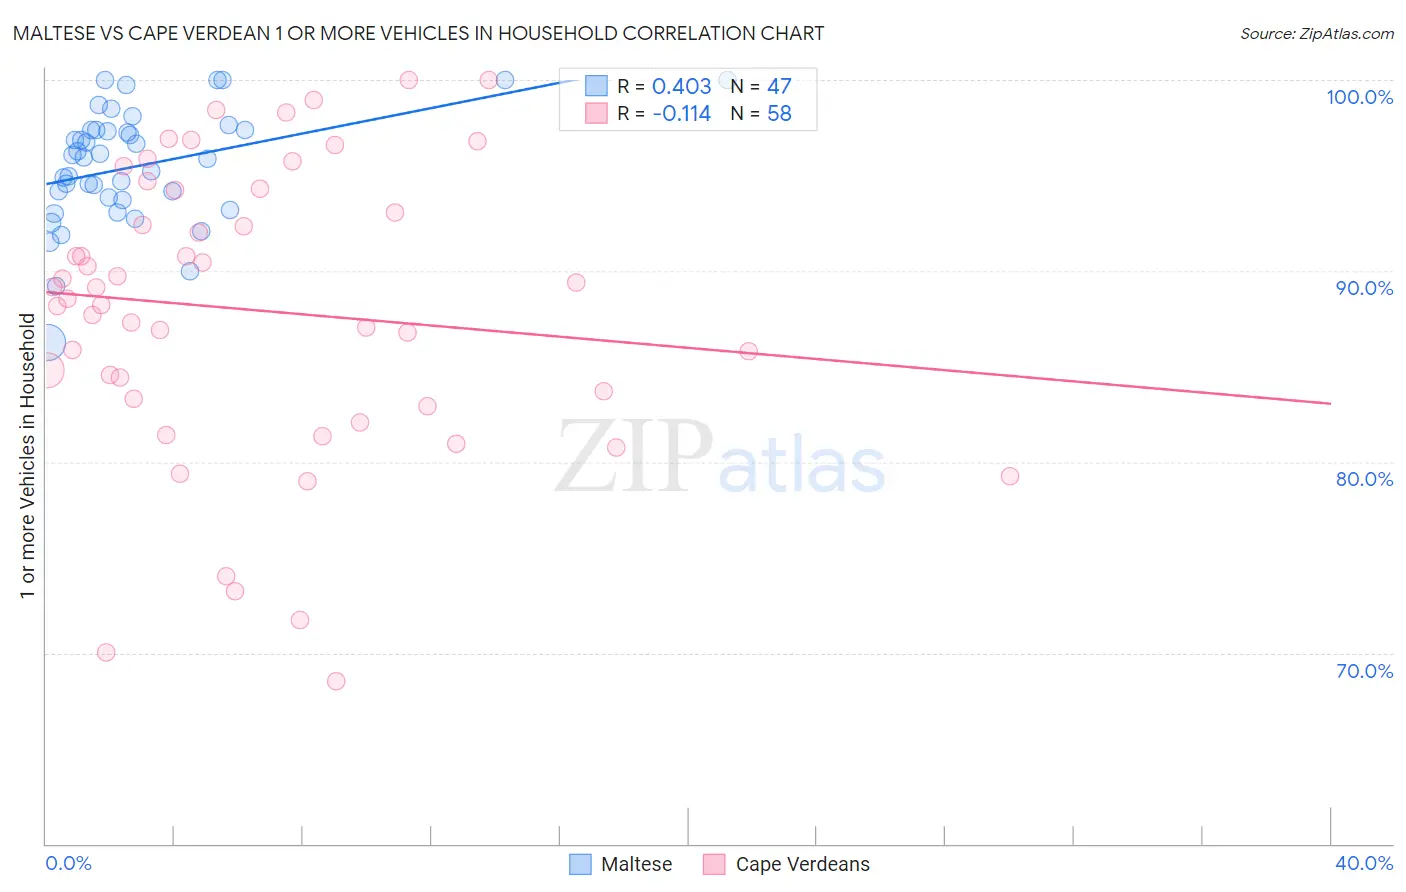
Maltese vs Cape Verdean 1 or more Vehicles in Household Correlation Chart
The statistical analysis conducted on geographies consisting of 126,283,538 people shows a moderate positive correlation between the proportion of Maltese and percentage of households with 1 or more vehicles available in the United States with a correlation coefficient (R) of 0.403 and weighted average of 91.0%. Similarly, the statistical analysis conducted on geographies consisting of 107,533,487 people shows a poor negative correlation between the proportion of Cape Verdeans and percentage of households with 1 or more vehicles available in the United States with a correlation coefficient (R) of -0.114 and weighted average of 84.5%, a difference of 7.7%.
1 or more Vehicles in Household Correlation Summary
| Measurement | Maltese | Cape Verdean |
| Minimum | 86.3% | 68.5% |
| Maximum | 100.0% | 100.0% |
| Range | 13.7% | 31.5% |
| Mean | 95.5% | 87.9% |
| Median | 95.9% | 88.8% |
| Interquartile 25% (IQ1) | 93.7% | 83.3% |
| Interquartile 75% (IQ3) | 97.4% | 94.3% |
| Interquartile Range (IQR) | 3.7% | 10.9% |
| Standard Deviation (Sample) | 3.0% | 7.6% |
| Standard Deviation (Population) | 3.0% | 7.6% |
Similar Demographics by 1 or more Vehicles in Household
Demographics Similar to Maltese by 1 or more Vehicles in Household
In terms of 1 or more vehicles in household, the demographic groups most similar to Maltese are Hispanic or Latino (91.0%, a difference of 0.0%), Delaware (91.0%, a difference of 0.010%), Zimbabwean (91.0%, a difference of 0.020%), Mexican American Indian (91.0%, a difference of 0.030%), and Laotian (91.0%, a difference of 0.060%).
| Demographics | Rating | Rank | 1 or more Vehicles in Household |
| Immigrants | Central America | 98.4 /100 | #100 | Exceptional 91.1% |
| Bulgarians | 98.4 /100 | #101 | Exceptional 91.1% |
| Seminole | 98.3 /100 | #102 | Exceptional 91.1% |
| Yugoslavians | 98.3 /100 | #103 | Exceptional 91.1% |
| Asians | 98.2 /100 | #104 | Exceptional 91.1% |
| Laotians | 98.0 /100 | #105 | Exceptional 91.0% |
| Zimbabweans | 97.7 /100 | #106 | Exceptional 91.0% |
| Maltese | 97.7 /100 | #107 | Exceptional 91.0% |
| Hispanics or Latinos | 97.6 /100 | #108 | Exceptional 91.0% |
| Delaware | 97.6 /100 | #109 | Exceptional 91.0% |
| Mexican American Indians | 97.4 /100 | #110 | Exceptional 91.0% |
| Navajo | 95.8 /100 | #111 | Exceptional 90.8% |
| Immigrants | Netherlands | 95.7 /100 | #112 | Exceptional 90.8% |
| Immigrants | Kuwait | 94.7 /100 | #113 | Exceptional 90.7% |
| Armenians | 94.5 /100 | #114 | Exceptional 90.7% |
Demographics Similar to Cape Verdeans by 1 or more Vehicles in Household
In terms of 1 or more vehicles in household, the demographic groups most similar to Cape Verdeans are Immigrants from Israel (84.5%, a difference of 0.020%), Albanian (84.4%, a difference of 0.090%), Puerto Rican (84.6%, a difference of 0.11%), U.S. Virgin Islander (84.6%, a difference of 0.15%), and Cypriot (84.4%, a difference of 0.16%).
| Demographics | Rating | Rank | 1 or more Vehicles in Household |
| Immigrants | China | 0.0 /100 | #305 | Tragic 84.9% |
| Immigrants | Western Africa | 0.0 /100 | #306 | Tragic 84.9% |
| Tohono O'odham | 0.0 /100 | #307 | Tragic 84.7% |
| Immigrants | Belize | 0.0 /100 | #308 | Tragic 84.7% |
| Immigrants | Haiti | 0.0 /100 | #309 | Tragic 84.7% |
| U.S. Virgin Islanders | 0.0 /100 | #310 | Tragic 84.6% |
| Puerto Ricans | 0.0 /100 | #311 | Tragic 84.6% |
| Cape Verdeans | 0.0 /100 | #312 | Tragic 84.5% |
| Immigrants | Israel | 0.0 /100 | #313 | Tragic 84.5% |
| Albanians | 0.0 /100 | #314 | Tragic 84.4% |
| Cypriots | 0.0 /100 | #315 | Tragic 84.4% |
| Alaska Natives | 0.0 /100 | #316 | Tragic 83.8% |
| Ghanaians | 0.0 /100 | #317 | Tragic 83.6% |
| Immigrants | Ghana | 0.0 /100 | #318 | Tragic 83.4% |
| Immigrants | Belarus | 0.0 /100 | #319 | Tragic 83.3% |