Immigrants from Sierra Leone vs Palestinian 1 or more Vehicles in Household
COMPARE
Immigrants from Sierra Leone
Palestinian
1 or more Vehicles in Household
1 or more Vehicles in Household Comparison
Immigrants from Sierra Leone
Palestinians
88.7%
1 OR MORE VEHICLES IN HOUSEHOLD
5.2/ 100
METRIC RATING
230th/ 347
METRIC RANK
91.7%
1 OR MORE VEHICLES IN HOUSEHOLD
99.7/ 100
METRIC RATING
69th/ 347
METRIC RANK
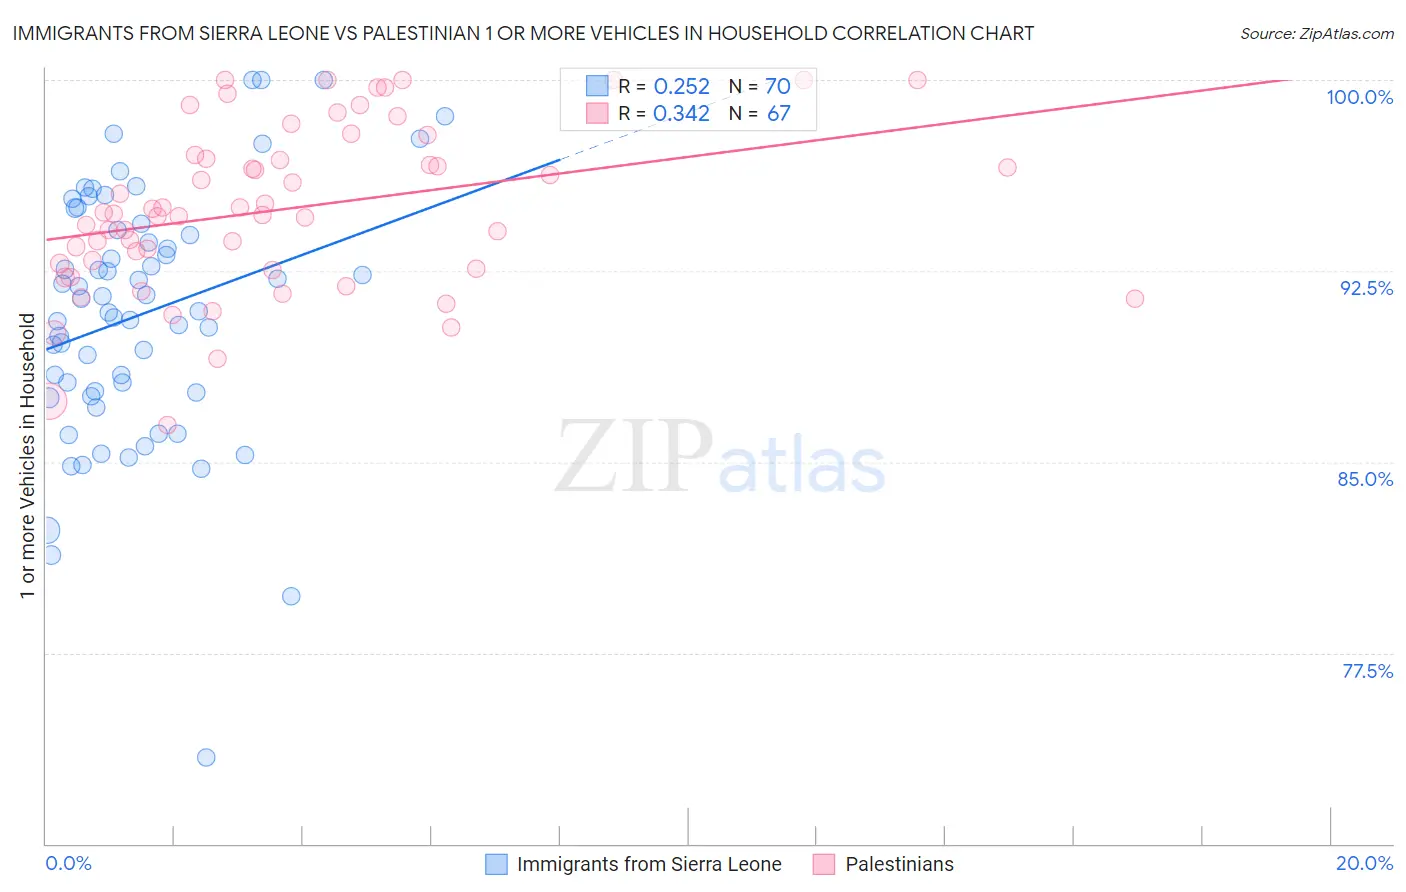
Immigrants from Sierra Leone vs Palestinian 1 or more Vehicles in Household Correlation Chart
The statistical analysis conducted on geographies consisting of 101,649,484 people shows a weak positive correlation between the proportion of Immigrants from Sierra Leone and percentage of households with 1 or more vehicles available in the United States with a correlation coefficient (R) of 0.252 and weighted average of 88.7%. Similarly, the statistical analysis conducted on geographies consisting of 216,371,451 people shows a mild positive correlation between the proportion of Palestinians and percentage of households with 1 or more vehicles available in the United States with a correlation coefficient (R) of 0.342 and weighted average of 91.7%, a difference of 3.4%.
1 or more Vehicles in Household Correlation Summary
| Measurement | Immigrants from Sierra Leone | Palestinian |
| Minimum | 73.4% | 86.4% |
| Maximum | 100.0% | 100.0% |
| Range | 26.6% | 13.6% |
| Mean | 90.8% | 94.9% |
| Median | 91.2% | 94.8% |
| Interquartile 25% (IQ1) | 87.7% | 92.6% |
| Interquartile 75% (IQ3) | 94.1% | 97.0% |
| Interquartile Range (IQR) | 6.4% | 4.4% |
| Standard Deviation (Sample) | 5.0% | 3.3% |
| Standard Deviation (Population) | 4.9% | 3.2% |
Similar Demographics by 1 or more Vehicles in Household
Demographics Similar to Immigrants from Sierra Leone by 1 or more Vehicles in Household
In terms of 1 or more vehicles in household, the demographic groups most similar to Immigrants from Sierra Leone are Immigrants from Romania (88.7%, a difference of 0.010%), Russian (88.7%, a difference of 0.020%), Immigrants from Japan (88.7%, a difference of 0.020%), Ute (88.7%, a difference of 0.030%), and Immigrants from Norway (88.7%, a difference of 0.030%).
| Demographics | Rating | Rank | 1 or more Vehicles in Household |
| Immigrants | South America | 7.0 /100 | #223 | Tragic 88.8% |
| Immigrants | Hong Kong | 6.2 /100 | #224 | Tragic 88.7% |
| Cree | 6.0 /100 | #225 | Tragic 88.7% |
| Cheyenne | 5.7 /100 | #226 | Tragic 88.7% |
| Ute | 5.6 /100 | #227 | Tragic 88.7% |
| Immigrants | Norway | 5.5 /100 | #228 | Tragic 88.7% |
| Immigrants | Romania | 5.4 /100 | #229 | Tragic 88.7% |
| Immigrants | Sierra Leone | 5.2 /100 | #230 | Tragic 88.7% |
| Russians | 5.0 /100 | #231 | Tragic 88.7% |
| Immigrants | Japan | 4.9 /100 | #232 | Tragic 88.7% |
| Houma | 4.8 /100 | #233 | Tragic 88.6% |
| Immigrants | Peru | 4.7 /100 | #234 | Tragic 88.6% |
| Paiute | 4.6 /100 | #235 | Tragic 88.6% |
| Immigrants | Pakistan | 4.5 /100 | #236 | Tragic 88.6% |
| Immigrants | Turkey | 4.4 /100 | #237 | Tragic 88.6% |
Demographics Similar to Palestinians by 1 or more Vehicles in Household
In terms of 1 or more vehicles in household, the demographic groups most similar to Palestinians are Lithuanian (91.7%, a difference of 0.020%), Immigrants from Scotland (91.8%, a difference of 0.040%), Polish (91.7%, a difference of 0.040%), Cajun (91.7%, a difference of 0.040%), and Immigrants from Iran (91.7%, a difference of 0.050%).
| Demographics | Rating | Rank | 1 or more Vehicles in Household |
| Thais | 99.8 /100 | #62 | Exceptional 91.9% |
| Chinese | 99.8 /100 | #63 | Exceptional 91.9% |
| Croatians | 99.8 /100 | #64 | Exceptional 91.9% |
| Immigrants | Laos | 99.8 /100 | #65 | Exceptional 91.8% |
| Canadians | 99.8 /100 | #66 | Exceptional 91.8% |
| Spaniards | 99.8 /100 | #67 | Exceptional 91.8% |
| Immigrants | Scotland | 99.7 /100 | #68 | Exceptional 91.8% |
| Palestinians | 99.7 /100 | #69 | Exceptional 91.7% |
| Lithuanians | 99.7 /100 | #70 | Exceptional 91.7% |
| Poles | 99.7 /100 | #71 | Exceptional 91.7% |
| Cajuns | 99.7 /100 | #72 | Exceptional 91.7% |
| Immigrants | Iran | 99.7 /100 | #73 | Exceptional 91.7% |
| Immigrants | Lebanon | 99.6 /100 | #74 | Exceptional 91.6% |
| Portuguese | 99.5 /100 | #75 | Exceptional 91.6% |
| Cubans | 99.5 /100 | #76 | Exceptional 91.5% |