Ugandan vs Palestinian Unemployment Among Seniors over 75 years
COMPARE
Ugandan
Palestinian
Unemployment Among Seniors over 75 years
Unemployment Among Seniors over 75 years Comparison
Ugandans
Palestinians
7.7%
UNEMPLOYMENT AMONG SENIORS OVER 75 YEARS
100.0/ 100
METRIC RATING
39th/ 347
METRIC RANK
9.3%
UNEMPLOYMENT AMONG SENIORS OVER 75 YEARS
0.6/ 100
METRIC RATING
265th/ 347
METRIC RANK
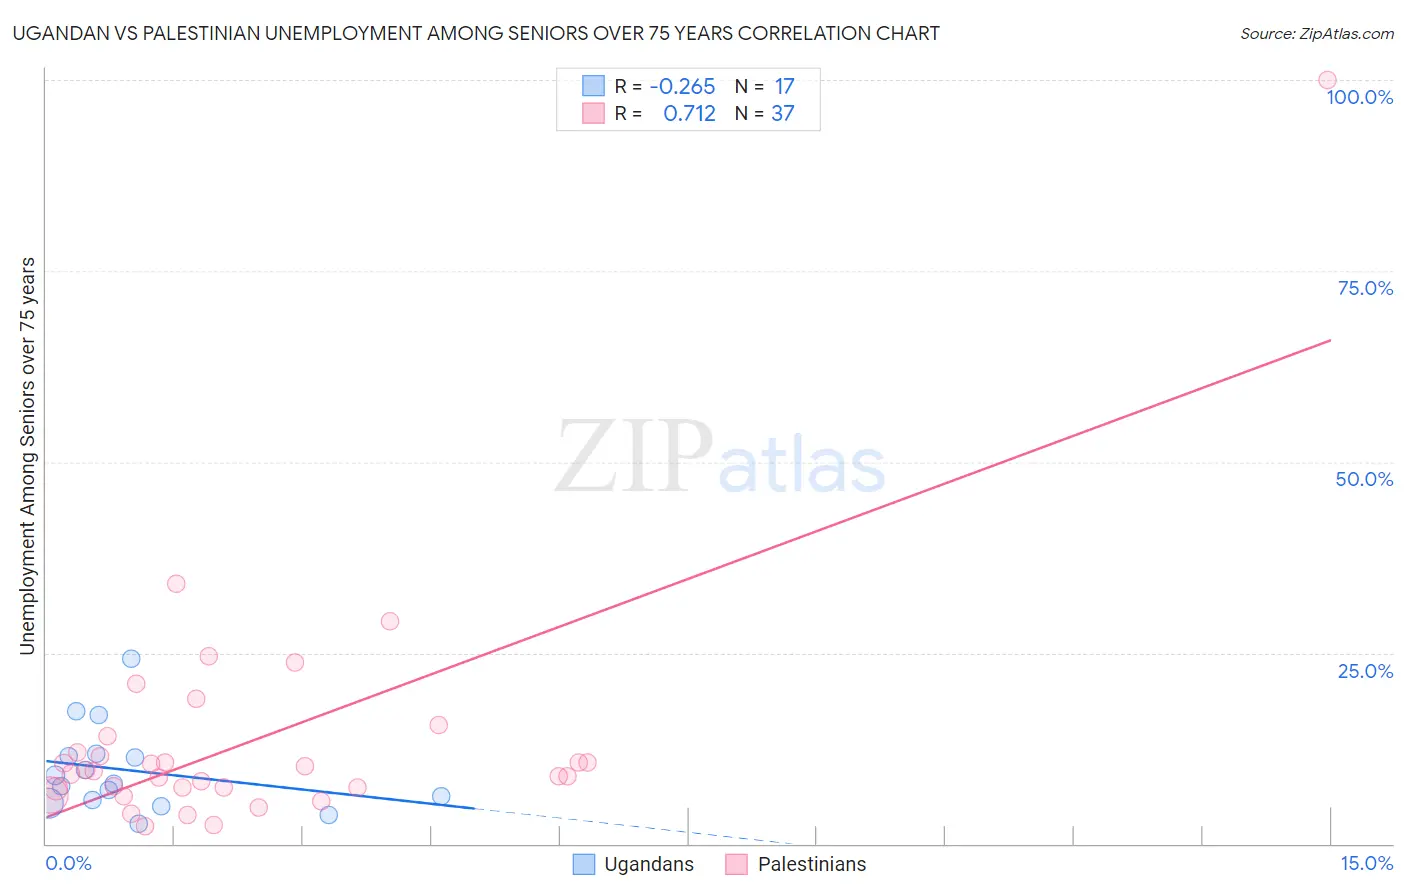
Ugandan vs Palestinian Unemployment Among Seniors over 75 years Correlation Chart
The statistical analysis conducted on geographies consisting of 74,859,637 people shows a weak negative correlation between the proportion of Ugandans and unemployment rate among seniors over the age of 75 in the United States with a correlation coefficient (R) of -0.265 and weighted average of 7.7%. Similarly, the statistical analysis conducted on geographies consisting of 136,961,824 people shows a strong positive correlation between the proportion of Palestinians and unemployment rate among seniors over the age of 75 in the United States with a correlation coefficient (R) of 0.712 and weighted average of 9.3%, a difference of 21.2%.
Unemployment Among Seniors over 75 years Correlation Summary
| Measurement | Ugandan | Palestinian |
| Minimum | 2.7% | 2.3% |
| Maximum | 24.3% | 100.0% |
| Range | 21.6% | 97.7% |
| Mean | 9.6% | 13.6% |
| Median | 7.8% | 9.5% |
| Interquartile 25% (IQ1) | 5.5% | 7.3% |
| Interquartile 75% (IQ3) | 11.6% | 13.0% |
| Interquartile Range (IQR) | 6.1% | 5.7% |
| Standard Deviation (Sample) | 5.6% | 16.3% |
| Standard Deviation (Population) | 5.4% | 16.1% |
Similar Demographics by Unemployment Among Seniors over 75 years
Demographics Similar to Ugandans by Unemployment Among Seniors over 75 years
In terms of unemployment among seniors over 75 years, the demographic groups most similar to Ugandans are Colville (7.7%, a difference of 0.020%), Kiowa (7.7%, a difference of 0.040%), Immigrants from Hungary (7.7%, a difference of 0.050%), Immigrants from Burma/Myanmar (7.7%, a difference of 0.16%), and Luxembourger (7.7%, a difference of 0.25%).
| Demographics | Rating | Rank | Unemployment Among Seniors over 75 years |
| Immigrants | Hong Kong | 100.0 /100 | #32 | Exceptional 7.6% |
| Cambodians | 100.0 /100 | #33 | Exceptional 7.6% |
| Immigrants | Eritrea | 100.0 /100 | #34 | Exceptional 7.7% |
| Immigrants | Norway | 100.0 /100 | #35 | Exceptional 7.7% |
| Luxembourgers | 100.0 /100 | #36 | Exceptional 7.7% |
| Immigrants | Hungary | 100.0 /100 | #37 | Exceptional 7.7% |
| Kiowa | 100.0 /100 | #38 | Exceptional 7.7% |
| Ugandans | 100.0 /100 | #39 | Exceptional 7.7% |
| Colville | 100.0 /100 | #40 | Exceptional 7.7% |
| Immigrants | Burma/Myanmar | 100.0 /100 | #41 | Exceptional 7.7% |
| Pueblo | 100.0 /100 | #42 | Exceptional 7.7% |
| Immigrants | Denmark | 100.0 /100 | #43 | Exceptional 7.8% |
| Immigrants | Spain | 100.0 /100 | #44 | Exceptional 7.8% |
| British West Indians | 100.0 /100 | #45 | Exceptional 7.8% |
| Immigrants | China | 100.0 /100 | #46 | Exceptional 7.8% |
Demographics Similar to Palestinians by Unemployment Among Seniors over 75 years
In terms of unemployment among seniors over 75 years, the demographic groups most similar to Palestinians are Iroquois (9.3%, a difference of 0.12%), Ukrainian (9.3%, a difference of 0.13%), Austrian (9.3%, a difference of 0.25%), Black/African American (9.4%, a difference of 0.32%), and Celtic (9.3%, a difference of 0.36%).
| Demographics | Rating | Rank | Unemployment Among Seniors over 75 years |
| Immigrants | England | 1.0 /100 | #258 | Tragic 9.3% |
| Slovenes | 1.0 /100 | #259 | Tragic 9.3% |
| Immigrants | Cameroon | 1.0 /100 | #260 | Tragic 9.3% |
| Celtics | 0.8 /100 | #261 | Tragic 9.3% |
| Austrians | 0.7 /100 | #262 | Tragic 9.3% |
| Ukrainians | 0.7 /100 | #263 | Tragic 9.3% |
| Iroquois | 0.7 /100 | #264 | Tragic 9.3% |
| Palestinians | 0.6 /100 | #265 | Tragic 9.3% |
| Blacks/African Americans | 0.5 /100 | #266 | Tragic 9.4% |
| Immigrants | Mexico | 0.4 /100 | #267 | Tragic 9.4% |
| Greeks | 0.4 /100 | #268 | Tragic 9.4% |
| Puerto Ricans | 0.3 /100 | #269 | Tragic 9.4% |
| Yaqui | 0.3 /100 | #270 | Tragic 9.4% |
| Bulgarians | 0.3 /100 | #271 | Tragic 9.4% |
| Immigrants | Iraq | 0.3 /100 | #272 | Tragic 9.4% |