French Canadian vs Immigrants from Moldova 4 or more Vehicles in Household
COMPARE
French Canadian
Immigrants from Moldova
4 or more Vehicles in Household
4 or more Vehicles in Household Comparison
French Canadians
Immigrants from Moldova
6.6%
4 OR MORE VEHICLES IN HOUSEHOLD
85.4/ 100
METRIC RATING
137th/ 347
METRIC RANK
6.0%
4 OR MORE VEHICLES IN HOUSEHOLD
9.3/ 100
METRIC RATING
221st/ 347
METRIC RANK
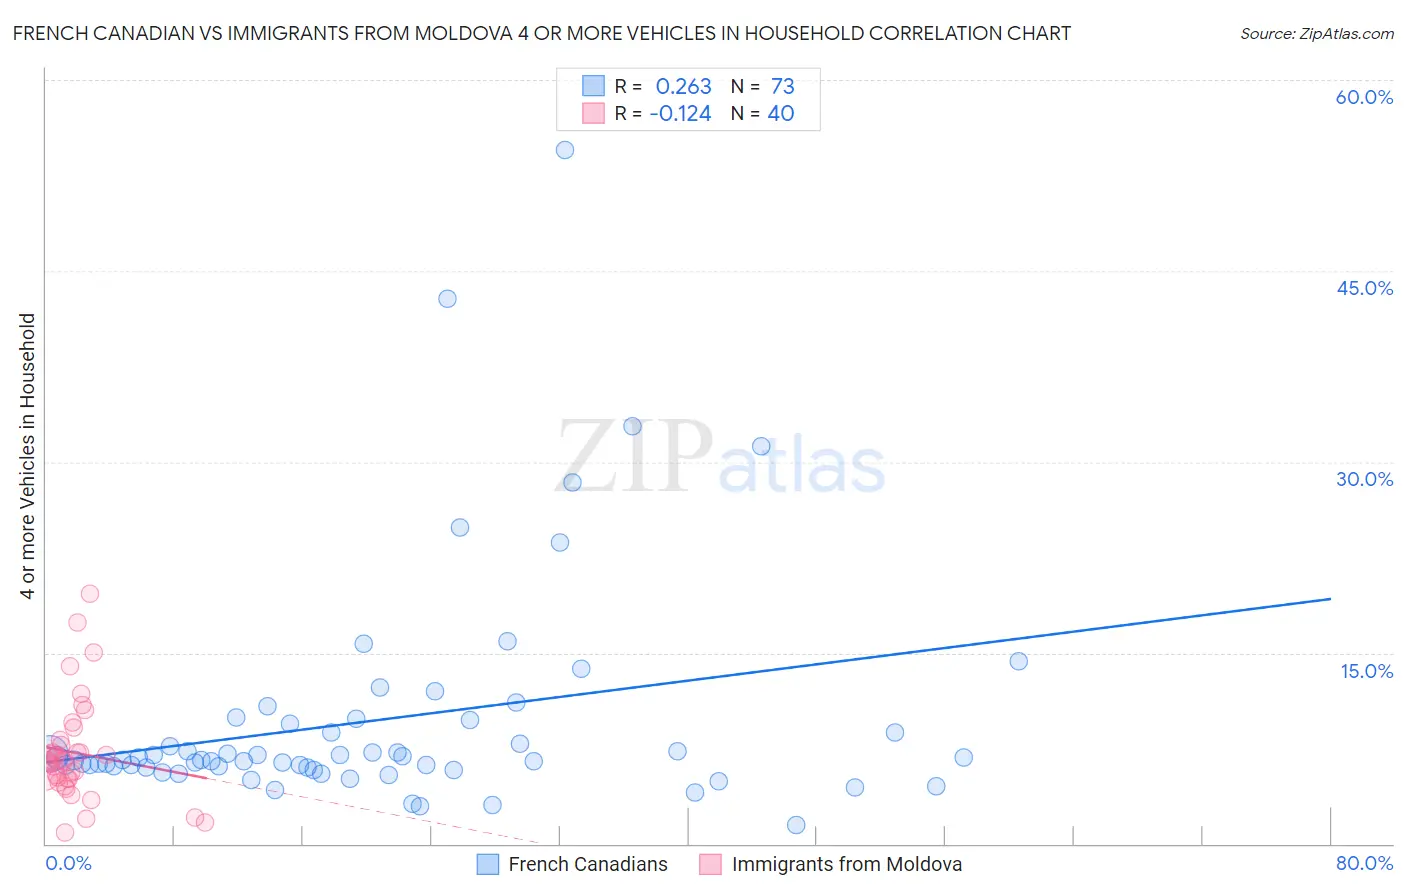
French Canadian vs Immigrants from Moldova 4 or more Vehicles in Household Correlation Chart
The statistical analysis conducted on geographies consisting of 500,260,140 people shows a weak positive correlation between the proportion of French Canadians and percentage of households with 4 or more vehicles available in the United States with a correlation coefficient (R) of 0.263 and weighted average of 6.6%. Similarly, the statistical analysis conducted on geographies consisting of 123,950,507 people shows a poor negative correlation between the proportion of Immigrants from Moldova and percentage of households with 4 or more vehicles available in the United States with a correlation coefficient (R) of -0.124 and weighted average of 6.0%, a difference of 10.8%.
4 or more Vehicles in Household Correlation Summary
| Measurement | French Canadian | Immigrants from Moldova |
| Minimum | 1.5% | 0.92% |
| Maximum | 54.5% | 19.6% |
| Range | 53.0% | 18.7% |
| Mean | 9.7% | 7.2% |
| Median | 6.6% | 6.5% |
| Interquartile 25% (IQ1) | 6.0% | 5.1% |
| Interquartile 75% (IQ3) | 9.6% | 7.9% |
| Interquartile Range (IQR) | 3.6% | 2.9% |
| Standard Deviation (Sample) | 9.0% | 4.0% |
| Standard Deviation (Population) | 8.9% | 3.9% |
Similar Demographics by 4 or more Vehicles in Household
Demographics Similar to French Canadians by 4 or more Vehicles in Household
In terms of 4 or more vehicles in household, the demographic groups most similar to French Canadians are Italian (6.6%, a difference of 0.16%), Luxembourger (6.6%, a difference of 0.21%), Tohono O'odham (6.6%, a difference of 0.27%), Ottawa (6.6%, a difference of 0.30%), and Armenian (6.6%, a difference of 0.32%).
| Demographics | Rating | Rank | 4 or more Vehicles in Household |
| Immigrants | Scotland | 89.0 /100 | #130 | Excellent 6.7% |
| Maltese | 88.4 /100 | #131 | Excellent 6.7% |
| Immigrants | Netherlands | 87.8 /100 | #132 | Excellent 6.6% |
| Armenians | 86.9 /100 | #133 | Excellent 6.6% |
| Ottawa | 86.9 /100 | #134 | Excellent 6.6% |
| Tohono O'odham | 86.7 /100 | #135 | Excellent 6.6% |
| Luxembourgers | 86.4 /100 | #136 | Excellent 6.6% |
| French Canadians | 85.4 /100 | #137 | Excellent 6.6% |
| Italians | 84.5 /100 | #138 | Excellent 6.6% |
| Jordanians | 82.1 /100 | #139 | Excellent 6.6% |
| Slavs | 81.6 /100 | #140 | Excellent 6.6% |
| Australians | 80.8 /100 | #141 | Excellent 6.6% |
| Immigrants | Iraq | 79.4 /100 | #142 | Good 6.5% |
| Immigrants | Canada | 78.6 /100 | #143 | Good 6.5% |
| Immigrants | North America | 78.5 /100 | #144 | Good 6.5% |
Demographics Similar to Immigrants from Moldova by 4 or more Vehicles in Household
In terms of 4 or more vehicles in household, the demographic groups most similar to Immigrants from Moldova are Cajun (6.0%, a difference of 0.030%), Immigrants from Kenya (6.0%, a difference of 0.030%), Cuban (6.0%, a difference of 0.050%), Indonesian (6.0%, a difference of 0.13%), and Russian (6.0%, a difference of 0.29%).
| Demographics | Rating | Rank | 4 or more Vehicles in Household |
| Immigrants | Austria | 14.3 /100 | #214 | Poor 6.0% |
| Immigrants | China | 13.8 /100 | #215 | Poor 6.0% |
| Immigrants | Romania | 13.8 /100 | #216 | Poor 6.0% |
| Nigerians | 12.2 /100 | #217 | Poor 6.0% |
| Immigrants | Italy | 11.0 /100 | #218 | Poor 6.0% |
| Serbians | 11.0 /100 | #219 | Poor 6.0% |
| Russians | 10.3 /100 | #220 | Poor 6.0% |
| Immigrants | Moldova | 9.3 /100 | #221 | Tragic 6.0% |
| Cajuns | 9.2 /100 | #222 | Tragic 6.0% |
| Immigrants | Kenya | 9.2 /100 | #223 | Tragic 6.0% |
| Cubans | 9.2 /100 | #224 | Tragic 6.0% |
| Indonesians | 8.9 /100 | #225 | Tragic 6.0% |
| Immigrants | Singapore | 7.9 /100 | #226 | Tragic 5.9% |
| Immigrants | Western Asia | 7.8 /100 | #227 | Tragic 5.9% |
| Immigrants | Uganda | 7.5 /100 | #228 | Tragic 5.9% |