Tsimshian vs Immigrants from Israel No Vehicles in Household
COMPARE
Tsimshian
Immigrants from Israel
No Vehicles in Household
No Vehicles in Household Comparison
Tsimshian
Immigrants from Israel
8.6%
NO VEHICLES IN HOUSEHOLD
99.4/ 100
METRIC RATING
81st/ 347
METRIC RANK
15.6%
NO VEHICLES IN HOUSEHOLD
0.0/ 100
METRIC RATING
311th/ 347
METRIC RANK
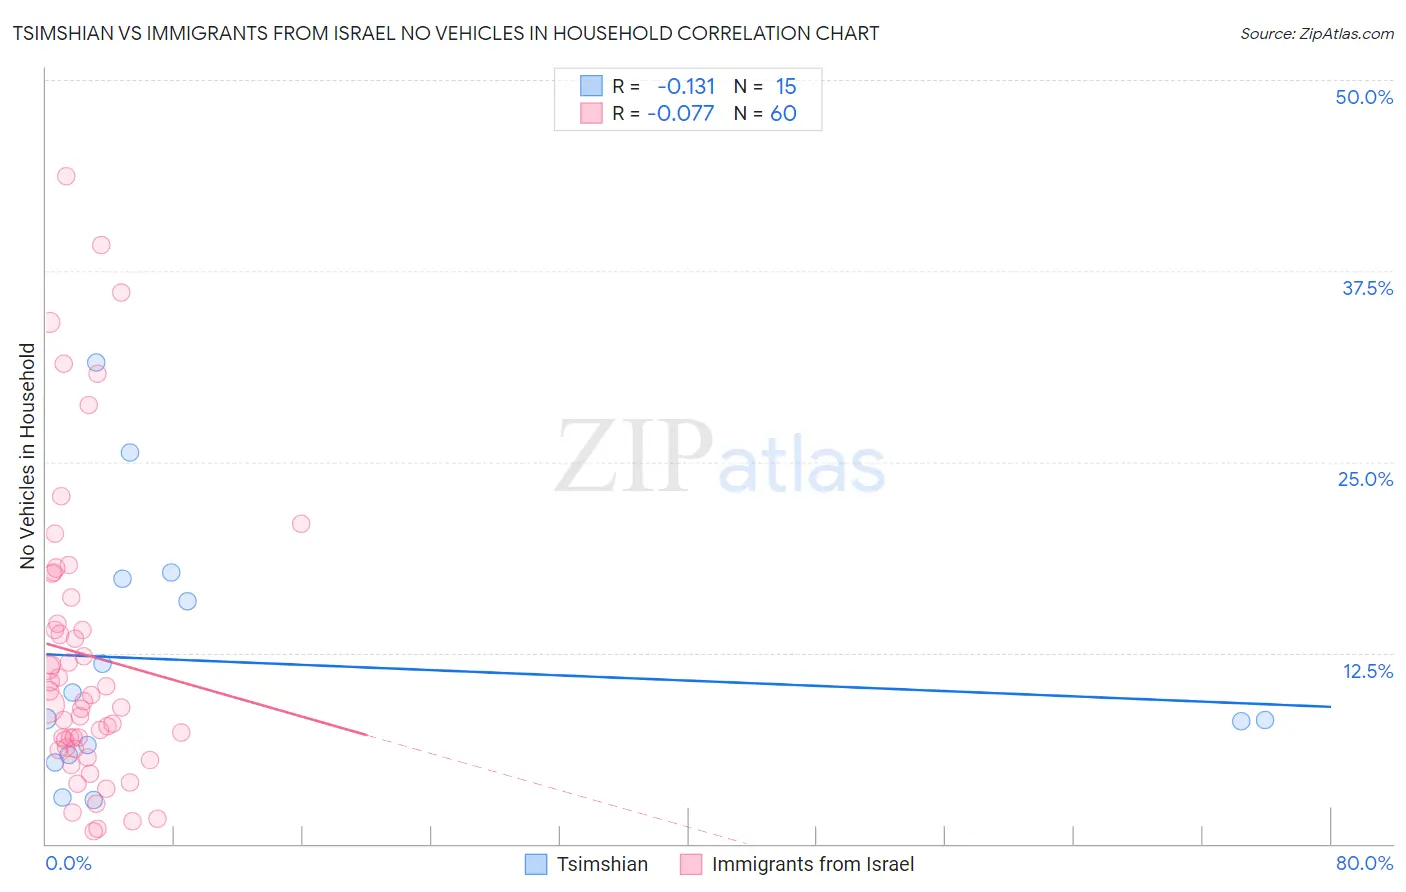
Tsimshian vs Immigrants from Israel No Vehicles in Household Correlation Chart
The statistical analysis conducted on geographies consisting of 15,626,179 people shows a poor negative correlation between the proportion of Tsimshian and percentage of households with no vehicle available in the United States with a correlation coefficient (R) of -0.131 and weighted average of 8.6%. Similarly, the statistical analysis conducted on geographies consisting of 209,834,938 people shows a slight negative correlation between the proportion of Immigrants from Israel and percentage of households with no vehicle available in the United States with a correlation coefficient (R) of -0.077 and weighted average of 15.6%, a difference of 81.3%.
No Vehicles in Household Correlation Summary
| Measurement | Tsimshian | Immigrants from Israel |
| Minimum | 2.8% | 0.81% |
| Maximum | 31.5% | 43.7% |
| Range | 28.6% | 42.9% |
| Mean | 11.8% | 12.4% |
| Median | 8.2% | 9.2% |
| Interquartile 25% (IQ1) | 5.8% | 6.3% |
| Interquartile 75% (IQ3) | 17.3% | 15.3% |
| Interquartile Range (IQR) | 11.5% | 9.0% |
| Standard Deviation (Sample) | 8.3% | 9.8% |
| Standard Deviation (Population) | 8.0% | 9.7% |
Similar Demographics by No Vehicles in Household
Demographics Similar to Tsimshian by No Vehicles in Household
In terms of no vehicles in household, the demographic groups most similar to Tsimshian are Bolivian (8.6%, a difference of 0.050%), Immigrants from South Eastern Asia (8.6%, a difference of 0.13%), Portuguese (8.6%, a difference of 0.20%), Immigrants from South Central Asia (8.6%, a difference of 0.26%), and Iranian (8.6%, a difference of 0.38%).
| Demographics | Rating | Rank | No Vehicles in Household |
| Cubans | 99.5 /100 | #74 | Exceptional 8.5% |
| Jordanians | 99.5 /100 | #75 | Exceptional 8.5% |
| Immigrants | Philippines | 99.5 /100 | #76 | Exceptional 8.5% |
| Iranians | 99.5 /100 | #77 | Exceptional 8.6% |
| Immigrants | South Central Asia | 99.5 /100 | #78 | Exceptional 8.6% |
| Portuguese | 99.5 /100 | #79 | Exceptional 8.6% |
| Bolivians | 99.4 /100 | #80 | Exceptional 8.6% |
| Tsimshian | 99.4 /100 | #81 | Exceptional 8.6% |
| Immigrants | South Eastern Asia | 99.4 /100 | #82 | Exceptional 8.6% |
| Italians | 99.4 /100 | #83 | Exceptional 8.6% |
| Immigrants | Jordan | 99.3 /100 | #84 | Exceptional 8.7% |
| Lebanese | 99.3 /100 | #85 | Exceptional 8.7% |
| Bangladeshis | 99.3 /100 | #86 | Exceptional 8.7% |
| Immigrants | England | 99.2 /100 | #87 | Exceptional 8.7% |
| Osage | 99.2 /100 | #88 | Exceptional 8.7% |
Demographics Similar to Immigrants from Israel by No Vehicles in Household
In terms of no vehicles in household, the demographic groups most similar to Immigrants from Israel are Cape Verdean (15.6%, a difference of 0.010%), Alaskan Athabascan (15.6%, a difference of 0.15%), Tohono O'odham (15.6%, a difference of 0.30%), Albanian (15.6%, a difference of 0.46%), and Puerto Rican (15.5%, a difference of 0.57%).
| Demographics | Rating | Rank | No Vehicles in Household |
| Immigrants | Russia | 0.0 /100 | #304 | Tragic 15.1% |
| Immigrants | China | 0.0 /100 | #305 | Tragic 15.2% |
| Immigrants | Belize | 0.0 /100 | #306 | Tragic 15.4% |
| Immigrants | Haiti | 0.0 /100 | #307 | Tragic 15.4% |
| U.S. Virgin Islanders | 0.0 /100 | #308 | Tragic 15.4% |
| Puerto Ricans | 0.0 /100 | #309 | Tragic 15.5% |
| Cape Verdeans | 0.0 /100 | #310 | Tragic 15.6% |
| Immigrants | Israel | 0.0 /100 | #311 | Tragic 15.6% |
| Alaskan Athabascans | 0.0 /100 | #312 | Tragic 15.6% |
| Tohono O'odham | 0.0 /100 | #313 | Tragic 15.6% |
| Albanians | 0.0 /100 | #314 | Tragic 15.6% |
| Cypriots | 0.0 /100 | #315 | Tragic 15.7% |
| Ghanaians | 0.0 /100 | #316 | Tragic 16.4% |
| Immigrants | Ghana | 0.0 /100 | #317 | Tragic 16.6% |
| Immigrants | Belarus | 0.0 /100 | #318 | Tragic 16.7% |