Sioux vs Immigrants from Israel No Vehicles in Household
COMPARE
Sioux
Immigrants from Israel
No Vehicles in Household
No Vehicles in Household Comparison
Sioux
Immigrants from Israel
10.1%
NO VEHICLES IN HOUSEHOLD
72.4/ 100
METRIC RATING
154th/ 347
METRIC RANK
15.6%
NO VEHICLES IN HOUSEHOLD
0.0/ 100
METRIC RATING
311th/ 347
METRIC RANK
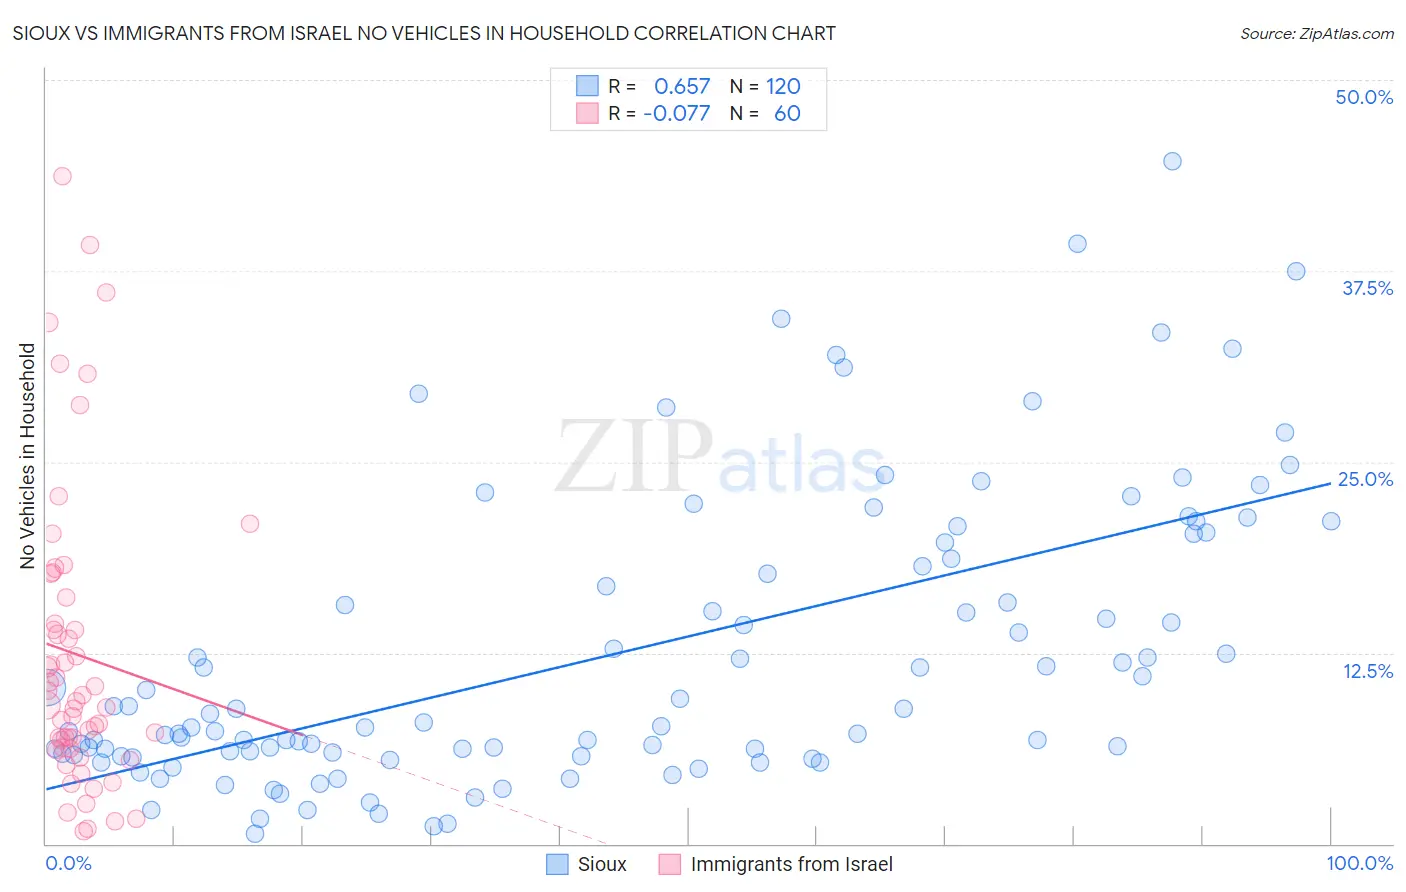
Sioux vs Immigrants from Israel No Vehicles in Household Correlation Chart
The statistical analysis conducted on geographies consisting of 233,693,165 people shows a significant positive correlation between the proportion of Sioux and percentage of households with no vehicle available in the United States with a correlation coefficient (R) of 0.657 and weighted average of 10.1%. Similarly, the statistical analysis conducted on geographies consisting of 209,834,938 people shows a slight negative correlation between the proportion of Immigrants from Israel and percentage of households with no vehicle available in the United States with a correlation coefficient (R) of -0.077 and weighted average of 15.6%, a difference of 54.7%.
No Vehicles in Household Correlation Summary
| Measurement | Sioux | Immigrants from Israel |
| Minimum | 0.66% | 0.81% |
| Maximum | 44.7% | 43.7% |
| Range | 44.0% | 42.9% |
| Mean | 12.4% | 12.4% |
| Median | 7.8% | 9.2% |
| Interquartile 25% (IQ1) | 5.8% | 6.3% |
| Interquartile 75% (IQ3) | 18.4% | 15.3% |
| Interquartile Range (IQR) | 12.5% | 9.0% |
| Standard Deviation (Sample) | 9.5% | 9.8% |
| Standard Deviation (Population) | 9.4% | 9.7% |
Similar Demographics by No Vehicles in Household
Demographics Similar to Sioux by No Vehicles in Household
In terms of no vehicles in household, the demographic groups most similar to Sioux are Salvadoran (10.1%, a difference of 0.010%), Tlingit-Haida (10.1%, a difference of 0.020%), Immigrants from Congo (10.1%, a difference of 0.11%), Immigrants from Eastern Africa (10.0%, a difference of 0.25%), and Colombian (10.0%, a difference of 0.26%).
| Demographics | Rating | Rank | No Vehicles in Household |
| Immigrants | Nicaragua | 79.8 /100 | #147 | Good 9.9% |
| Immigrants | Bosnia and Herzegovina | 79.1 /100 | #148 | Good 9.9% |
| Immigrants | Uganda | 76.1 /100 | #149 | Good 10.0% |
| Colombians | 73.9 /100 | #150 | Good 10.0% |
| Immigrants | Eastern Africa | 73.8 /100 | #151 | Good 10.0% |
| Immigrants | Congo | 73.0 /100 | #152 | Good 10.1% |
| Tlingit-Haida | 72.5 /100 | #153 | Good 10.1% |
| Sioux | 72.4 /100 | #154 | Good 10.1% |
| Salvadorans | 72.4 /100 | #155 | Good 10.1% |
| Immigrants | Micronesia | 70.9 /100 | #156 | Good 10.1% |
| Australians | 70.6 /100 | #157 | Good 10.1% |
| Spanish American Indians | 70.2 /100 | #158 | Good 10.1% |
| Immigrants | Indonesia | 69.3 /100 | #159 | Good 10.1% |
| Immigrants | Middle Africa | 65.7 /100 | #160 | Good 10.2% |
| New Zealanders | 65.1 /100 | #161 | Good 10.2% |
Demographics Similar to Immigrants from Israel by No Vehicles in Household
In terms of no vehicles in household, the demographic groups most similar to Immigrants from Israel are Cape Verdean (15.6%, a difference of 0.010%), Alaskan Athabascan (15.6%, a difference of 0.15%), Tohono O'odham (15.6%, a difference of 0.30%), Albanian (15.6%, a difference of 0.46%), and Puerto Rican (15.5%, a difference of 0.57%).
| Demographics | Rating | Rank | No Vehicles in Household |
| Immigrants | Russia | 0.0 /100 | #304 | Tragic 15.1% |
| Immigrants | China | 0.0 /100 | #305 | Tragic 15.2% |
| Immigrants | Belize | 0.0 /100 | #306 | Tragic 15.4% |
| Immigrants | Haiti | 0.0 /100 | #307 | Tragic 15.4% |
| U.S. Virgin Islanders | 0.0 /100 | #308 | Tragic 15.4% |
| Puerto Ricans | 0.0 /100 | #309 | Tragic 15.5% |
| Cape Verdeans | 0.0 /100 | #310 | Tragic 15.6% |
| Immigrants | Israel | 0.0 /100 | #311 | Tragic 15.6% |
| Alaskan Athabascans | 0.0 /100 | #312 | Tragic 15.6% |
| Tohono O'odham | 0.0 /100 | #313 | Tragic 15.6% |
| Albanians | 0.0 /100 | #314 | Tragic 15.6% |
| Cypriots | 0.0 /100 | #315 | Tragic 15.7% |
| Ghanaians | 0.0 /100 | #316 | Tragic 16.4% |
| Immigrants | Ghana | 0.0 /100 | #317 | Tragic 16.6% |
| Immigrants | Belarus | 0.0 /100 | #318 | Tragic 16.7% |