Immigrants from Sierra Leone vs Immigrants from Israel No Vehicles in Household
COMPARE
Immigrants from Sierra Leone
Immigrants from Israel
No Vehicles in Household
No Vehicles in Household Comparison
Immigrants from Sierra Leone
Immigrants from Israel
11.3%
NO VEHICLES IN HOUSEHOLD
6.4/ 100
METRIC RATING
225th/ 347
METRIC RANK
15.6%
NO VEHICLES IN HOUSEHOLD
0.0/ 100
METRIC RATING
311th/ 347
METRIC RANK
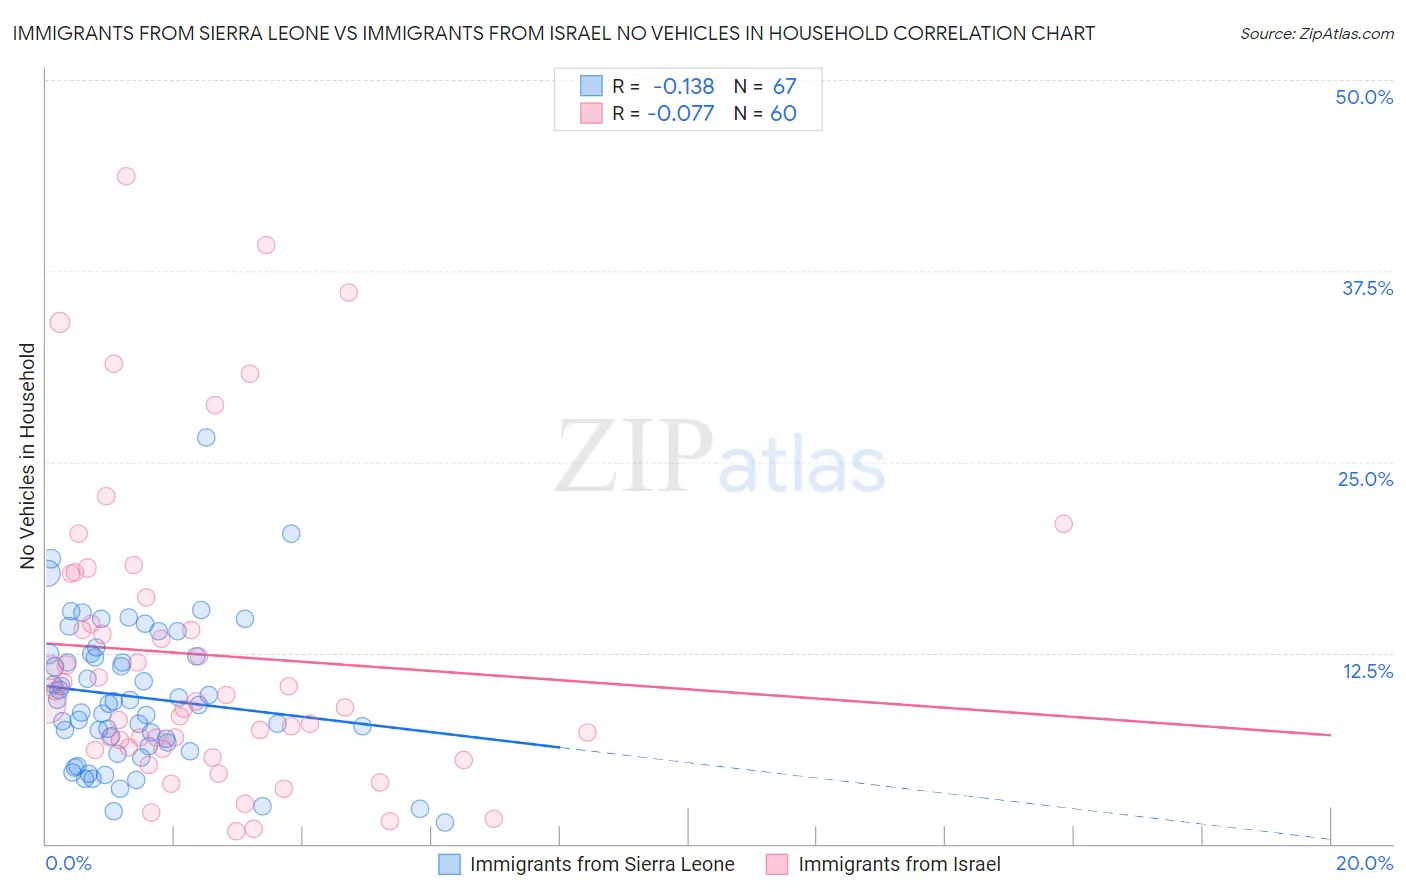
Immigrants from Sierra Leone vs Immigrants from Israel No Vehicles in Household Correlation Chart
The statistical analysis conducted on geographies consisting of 101,627,195 people shows a poor negative correlation between the proportion of Immigrants from Sierra Leone and percentage of households with no vehicle available in the United States with a correlation coefficient (R) of -0.138 and weighted average of 11.3%. Similarly, the statistical analysis conducted on geographies consisting of 209,834,938 people shows a slight negative correlation between the proportion of Immigrants from Israel and percentage of households with no vehicle available in the United States with a correlation coefficient (R) of -0.077 and weighted average of 15.6%, a difference of 37.2%.
No Vehicles in Household Correlation Summary
| Measurement | Immigrants from Sierra Leone | Immigrants from Israel |
| Minimum | 1.4% | 0.81% |
| Maximum | 26.6% | 43.7% |
| Range | 25.2% | 42.9% |
| Mean | 9.6% | 12.4% |
| Median | 9.1% | 9.2% |
| Interquartile 25% (IQ1) | 6.4% | 6.3% |
| Interquartile 75% (IQ3) | 12.4% | 15.3% |
| Interquartile Range (IQR) | 6.0% | 9.0% |
| Standard Deviation (Sample) | 4.7% | 9.8% |
| Standard Deviation (Population) | 4.6% | 9.7% |
Similar Demographics by No Vehicles in Household
Demographics Similar to Immigrants from Sierra Leone by No Vehicles in Household
In terms of no vehicles in household, the demographic groups most similar to Immigrants from Sierra Leone are Immigrants from Hong Kong (11.3%, a difference of 0.37%), Immigrants from Somalia (11.4%, a difference of 0.55%), Immigrants from Pakistan (11.4%, a difference of 0.57%), Uruguayan (11.3%, a difference of 0.59%), and Immigrants from Romania (11.4%, a difference of 0.62%).
| Demographics | Rating | Rank | No Vehicles in Household |
| Immigrants | Guatemala | 10.0 /100 | #218 | Tragic 11.2% |
| Argentineans | 9.6 /100 | #219 | Tragic 11.2% |
| Immigrants | Zaire | 9.6 /100 | #220 | Tragic 11.2% |
| Peruvians | 8.4 /100 | #221 | Tragic 11.2% |
| Immigrants | South America | 8.0 /100 | #222 | Tragic 11.3% |
| Uruguayans | 7.7 /100 | #223 | Tragic 11.3% |
| Immigrants | Hong Kong | 7.2 /100 | #224 | Tragic 11.3% |
| Immigrants | Sierra Leone | 6.4 /100 | #225 | Tragic 11.3% |
| Immigrants | Somalia | 5.4 /100 | #226 | Tragic 11.4% |
| Immigrants | Pakistan | 5.4 /100 | #227 | Tragic 11.4% |
| Immigrants | Romania | 5.3 /100 | #228 | Tragic 11.4% |
| Ugandans | 5.3 /100 | #229 | Tragic 11.4% |
| Immigrants | Norway | 5.1 /100 | #230 | Tragic 11.4% |
| Immigrants | Japan | 5.1 /100 | #231 | Tragic 11.4% |
| Immigrants | Turkey | 4.8 /100 | #232 | Tragic 11.5% |
Demographics Similar to Immigrants from Israel by No Vehicles in Household
In terms of no vehicles in household, the demographic groups most similar to Immigrants from Israel are Cape Verdean (15.6%, a difference of 0.010%), Alaskan Athabascan (15.6%, a difference of 0.15%), Tohono O'odham (15.6%, a difference of 0.30%), Albanian (15.6%, a difference of 0.46%), and Puerto Rican (15.5%, a difference of 0.57%).
| Demographics | Rating | Rank | No Vehicles in Household |
| Immigrants | Russia | 0.0 /100 | #304 | Tragic 15.1% |
| Immigrants | China | 0.0 /100 | #305 | Tragic 15.2% |
| Immigrants | Belize | 0.0 /100 | #306 | Tragic 15.4% |
| Immigrants | Haiti | 0.0 /100 | #307 | Tragic 15.4% |
| U.S. Virgin Islanders | 0.0 /100 | #308 | Tragic 15.4% |
| Puerto Ricans | 0.0 /100 | #309 | Tragic 15.5% |
| Cape Verdeans | 0.0 /100 | #310 | Tragic 15.6% |
| Immigrants | Israel | 0.0 /100 | #311 | Tragic 15.6% |
| Alaskan Athabascans | 0.0 /100 | #312 | Tragic 15.6% |
| Tohono O'odham | 0.0 /100 | #313 | Tragic 15.6% |
| Albanians | 0.0 /100 | #314 | Tragic 15.6% |
| Cypriots | 0.0 /100 | #315 | Tragic 15.7% |
| Ghanaians | 0.0 /100 | #316 | Tragic 16.4% |
| Immigrants | Ghana | 0.0 /100 | #317 | Tragic 16.6% |
| Immigrants | Belarus | 0.0 /100 | #318 | Tragic 16.7% |