Tsimshian vs French American Indian No Vehicles in Household
COMPARE
Tsimshian
French American Indian
No Vehicles in Household
No Vehicles in Household Comparison
Tsimshian
French American Indians
8.6%
NO VEHICLES IN HOUSEHOLD
99.4/ 100
METRIC RATING
81st/ 347
METRIC RANK
10.4%
NO VEHICLES IN HOUSEHOLD
49.1/ 100
METRIC RATING
176th/ 347
METRIC RANK
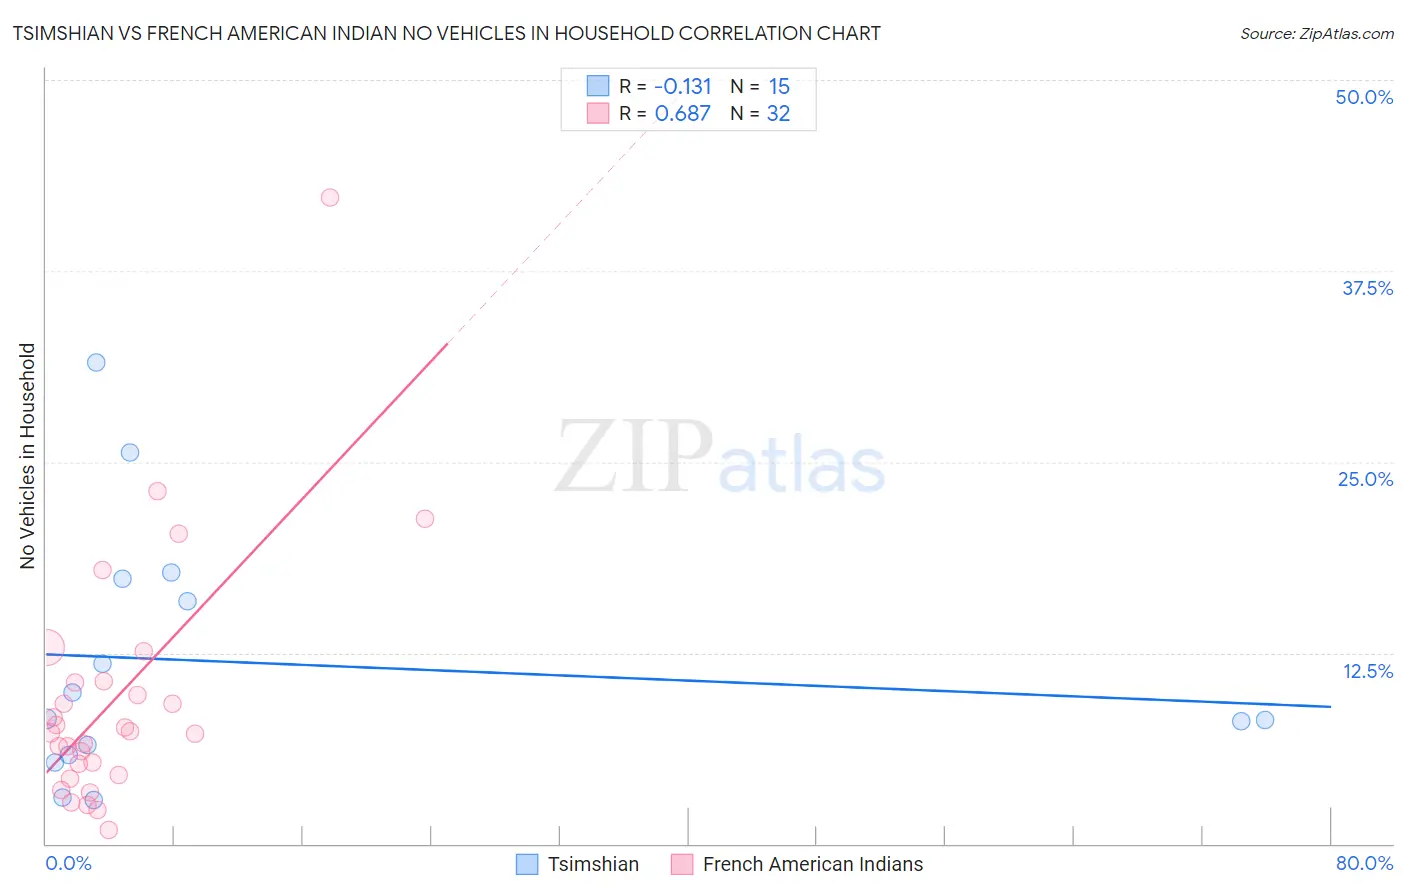
Tsimshian vs French American Indian No Vehicles in Household Correlation Chart
The statistical analysis conducted on geographies consisting of 15,626,179 people shows a poor negative correlation between the proportion of Tsimshian and percentage of households with no vehicle available in the United States with a correlation coefficient (R) of -0.131 and weighted average of 8.6%. Similarly, the statistical analysis conducted on geographies consisting of 131,848,748 people shows a significant positive correlation between the proportion of French American Indians and percentage of households with no vehicle available in the United States with a correlation coefficient (R) of 0.687 and weighted average of 10.4%, a difference of 21.3%.
No Vehicles in Household Correlation Summary
| Measurement | Tsimshian | French American Indian |
| Minimum | 2.8% | 0.86% |
| Maximum | 31.5% | 42.3% |
| Range | 28.6% | 41.4% |
| Mean | 11.8% | 9.5% |
| Median | 8.2% | 7.3% |
| Interquartile 25% (IQ1) | 5.8% | 4.9% |
| Interquartile 75% (IQ3) | 17.3% | 10.6% |
| Interquartile Range (IQR) | 11.5% | 5.7% |
| Standard Deviation (Sample) | 8.3% | 8.1% |
| Standard Deviation (Population) | 8.0% | 8.0% |
Similar Demographics by No Vehicles in Household
Demographics Similar to Tsimshian by No Vehicles in Household
In terms of no vehicles in household, the demographic groups most similar to Tsimshian are Bolivian (8.6%, a difference of 0.050%), Immigrants from South Eastern Asia (8.6%, a difference of 0.13%), Portuguese (8.6%, a difference of 0.20%), Immigrants from South Central Asia (8.6%, a difference of 0.26%), and Iranian (8.6%, a difference of 0.38%).
| Demographics | Rating | Rank | No Vehicles in Household |
| Cubans | 99.5 /100 | #74 | Exceptional 8.5% |
| Jordanians | 99.5 /100 | #75 | Exceptional 8.5% |
| Immigrants | Philippines | 99.5 /100 | #76 | Exceptional 8.5% |
| Iranians | 99.5 /100 | #77 | Exceptional 8.6% |
| Immigrants | South Central Asia | 99.5 /100 | #78 | Exceptional 8.6% |
| Portuguese | 99.5 /100 | #79 | Exceptional 8.6% |
| Bolivians | 99.4 /100 | #80 | Exceptional 8.6% |
| Tsimshian | 99.4 /100 | #81 | Exceptional 8.6% |
| Immigrants | South Eastern Asia | 99.4 /100 | #82 | Exceptional 8.6% |
| Italians | 99.4 /100 | #83 | Exceptional 8.6% |
| Immigrants | Jordan | 99.3 /100 | #84 | Exceptional 8.7% |
| Lebanese | 99.3 /100 | #85 | Exceptional 8.7% |
| Bangladeshis | 99.3 /100 | #86 | Exceptional 8.7% |
| Immigrants | England | 99.2 /100 | #87 | Exceptional 8.7% |
| Osage | 99.2 /100 | #88 | Exceptional 8.7% |
Demographics Similar to French American Indians by No Vehicles in Household
In terms of no vehicles in household, the demographic groups most similar to French American Indians are Immigrants from Burma/Myanmar (10.4%, a difference of 0.0%), Immigrants from El Salvador (10.4%, a difference of 0.010%), Immigrants from Sudan (10.4%, a difference of 0.12%), Filipino (10.4%, a difference of 0.13%), and Immigrants from Ethiopia (10.4%, a difference of 0.16%).
| Demographics | Rating | Rank | No Vehicles in Household |
| Lumbee | 54.7 /100 | #169 | Average 10.3% |
| Immigrants | Latin America | 53.2 /100 | #170 | Average 10.4% |
| Hmong | 52.7 /100 | #171 | Average 10.4% |
| Brazilians | 51.7 /100 | #172 | Average 10.4% |
| Filipinos | 50.1 /100 | #173 | Average 10.4% |
| Immigrants | Sudan | 50.0 /100 | #174 | Average 10.4% |
| Immigrants | Burma/Myanmar | 49.1 /100 | #175 | Average 10.4% |
| French American Indians | 49.1 /100 | #176 | Average 10.4% |
| Immigrants | El Salvador | 49.1 /100 | #177 | Average 10.4% |
| Immigrants | Ethiopia | 48.0 /100 | #178 | Average 10.4% |
| Ethiopians | 45.8 /100 | #179 | Average 10.5% |
| Arabs | 45.3 /100 | #180 | Average 10.5% |
| Immigrants | Colombia | 44.1 /100 | #181 | Average 10.5% |
| Immigrants | Bulgaria | 43.8 /100 | #182 | Average 10.5% |
| Natives/Alaskans | 43.7 /100 | #183 | Average 10.5% |