Tsimshian vs Moroccan No Vehicles in Household
COMPARE
Tsimshian
Moroccan
No Vehicles in Household
No Vehicles in Household Comparison
Tsimshian
Moroccans
8.6%
NO VEHICLES IN HOUSEHOLD
99.4/ 100
METRIC RATING
81st/ 347
METRIC RANK
14.7%
NO VEHICLES IN HOUSEHOLD
0.0/ 100
METRIC RATING
298th/ 347
METRIC RANK
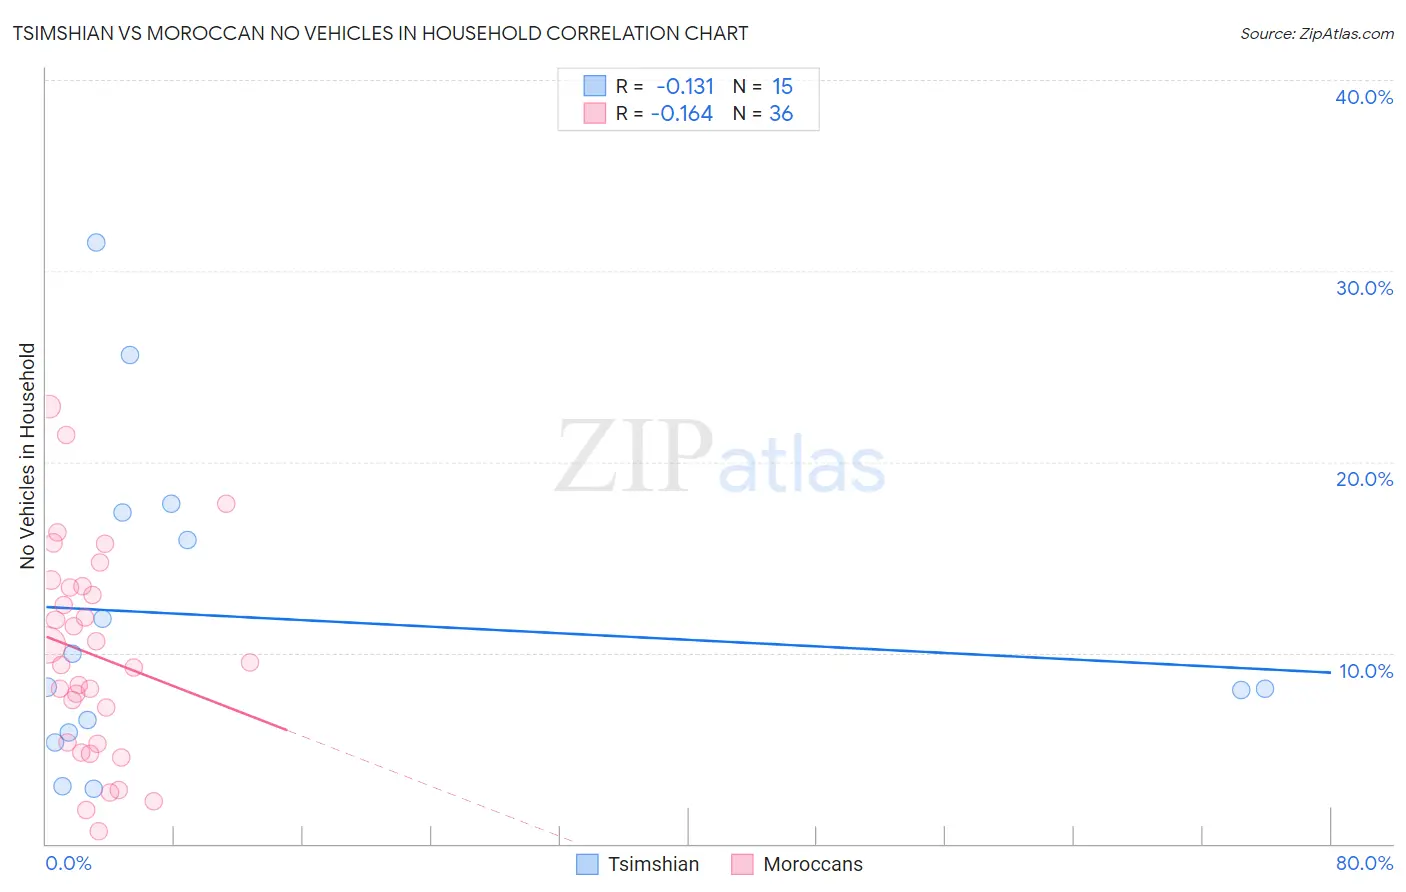
Tsimshian vs Moroccan No Vehicles in Household Correlation Chart
The statistical analysis conducted on geographies consisting of 15,626,179 people shows a poor negative correlation between the proportion of Tsimshian and percentage of households with no vehicle available in the United States with a correlation coefficient (R) of -0.131 and weighted average of 8.6%. Similarly, the statistical analysis conducted on geographies consisting of 201,657,116 people shows a poor negative correlation between the proportion of Moroccans and percentage of households with no vehicle available in the United States with a correlation coefficient (R) of -0.164 and weighted average of 14.7%, a difference of 70.8%.
No Vehicles in Household Correlation Summary
| Measurement | Tsimshian | Moroccan |
| Minimum | 2.8% | 0.64% |
| Maximum | 31.5% | 22.9% |
| Range | 28.6% | 22.3% |
| Mean | 11.8% | 9.9% |
| Median | 8.2% | 9.4% |
| Interquartile 25% (IQ1) | 5.8% | 5.3% |
| Interquartile 75% (IQ3) | 17.3% | 13.4% |
| Interquartile Range (IQR) | 11.5% | 8.2% |
| Standard Deviation (Sample) | 8.3% | 5.4% |
| Standard Deviation (Population) | 8.0% | 5.4% |
Similar Demographics by No Vehicles in Household
Demographics Similar to Tsimshian by No Vehicles in Household
In terms of no vehicles in household, the demographic groups most similar to Tsimshian are Bolivian (8.6%, a difference of 0.050%), Immigrants from South Eastern Asia (8.6%, a difference of 0.13%), Portuguese (8.6%, a difference of 0.20%), Immigrants from South Central Asia (8.6%, a difference of 0.26%), and Iranian (8.6%, a difference of 0.38%).
| Demographics | Rating | Rank | No Vehicles in Household |
| Cubans | 99.5 /100 | #74 | Exceptional 8.5% |
| Jordanians | 99.5 /100 | #75 | Exceptional 8.5% |
| Immigrants | Philippines | 99.5 /100 | #76 | Exceptional 8.5% |
| Iranians | 99.5 /100 | #77 | Exceptional 8.6% |
| Immigrants | South Central Asia | 99.5 /100 | #78 | Exceptional 8.6% |
| Portuguese | 99.5 /100 | #79 | Exceptional 8.6% |
| Bolivians | 99.4 /100 | #80 | Exceptional 8.6% |
| Tsimshian | 99.4 /100 | #81 | Exceptional 8.6% |
| Immigrants | South Eastern Asia | 99.4 /100 | #82 | Exceptional 8.6% |
| Italians | 99.4 /100 | #83 | Exceptional 8.6% |
| Immigrants | Jordan | 99.3 /100 | #84 | Exceptional 8.7% |
| Lebanese | 99.3 /100 | #85 | Exceptional 8.7% |
| Bangladeshis | 99.3 /100 | #86 | Exceptional 8.7% |
| Immigrants | England | 99.2 /100 | #87 | Exceptional 8.7% |
| Osage | 99.2 /100 | #88 | Exceptional 8.7% |
Demographics Similar to Moroccans by No Vehicles in Household
In terms of no vehicles in household, the demographic groups most similar to Moroccans are Immigrants from Panama (14.6%, a difference of 0.15%), Immigrants from Greece (14.7%, a difference of 0.20%), Immigrants from Spain (14.5%, a difference of 0.82%), Yuman (14.9%, a difference of 1.3%), and Immigrants from Ukraine (14.9%, a difference of 1.3%).
| Demographics | Rating | Rank | No Vehicles in Household |
| Okinawans | 0.0 /100 | #291 | Tragic 14.1% |
| Pima | 0.0 /100 | #292 | Tragic 14.1% |
| Immigrants | Jamaica | 0.0 /100 | #293 | Tragic 14.2% |
| Belizeans | 0.0 /100 | #294 | Tragic 14.3% |
| Paraguayans | 0.0 /100 | #295 | Tragic 14.4% |
| Immigrants | Spain | 0.0 /100 | #296 | Tragic 14.5% |
| Immigrants | Panama | 0.0 /100 | #297 | Tragic 14.6% |
| Moroccans | 0.0 /100 | #298 | Tragic 14.7% |
| Immigrants | Greece | 0.0 /100 | #299 | Tragic 14.7% |
| Yuman | 0.0 /100 | #300 | Tragic 14.9% |
| Immigrants | Ukraine | 0.0 /100 | #301 | Tragic 14.9% |
| Haitians | 0.0 /100 | #302 | Tragic 14.9% |
| Immigrants | Western Africa | 0.0 /100 | #303 | Tragic 15.0% |
| Immigrants | Russia | 0.0 /100 | #304 | Tragic 15.1% |
| Immigrants | China | 0.0 /100 | #305 | Tragic 15.2% |