Tsimshian vs Potawatomi No Vehicles in Household
COMPARE
Tsimshian
Potawatomi
No Vehicles in Household
No Vehicles in Household Comparison
Tsimshian
Potawatomi
8.6%
NO VEHICLES IN HOUSEHOLD
99.4/ 100
METRIC RATING
81st/ 347
METRIC RANK
8.8%
NO VEHICLES IN HOUSEHOLD
98.8/ 100
METRIC RATING
95th/ 347
METRIC RANK
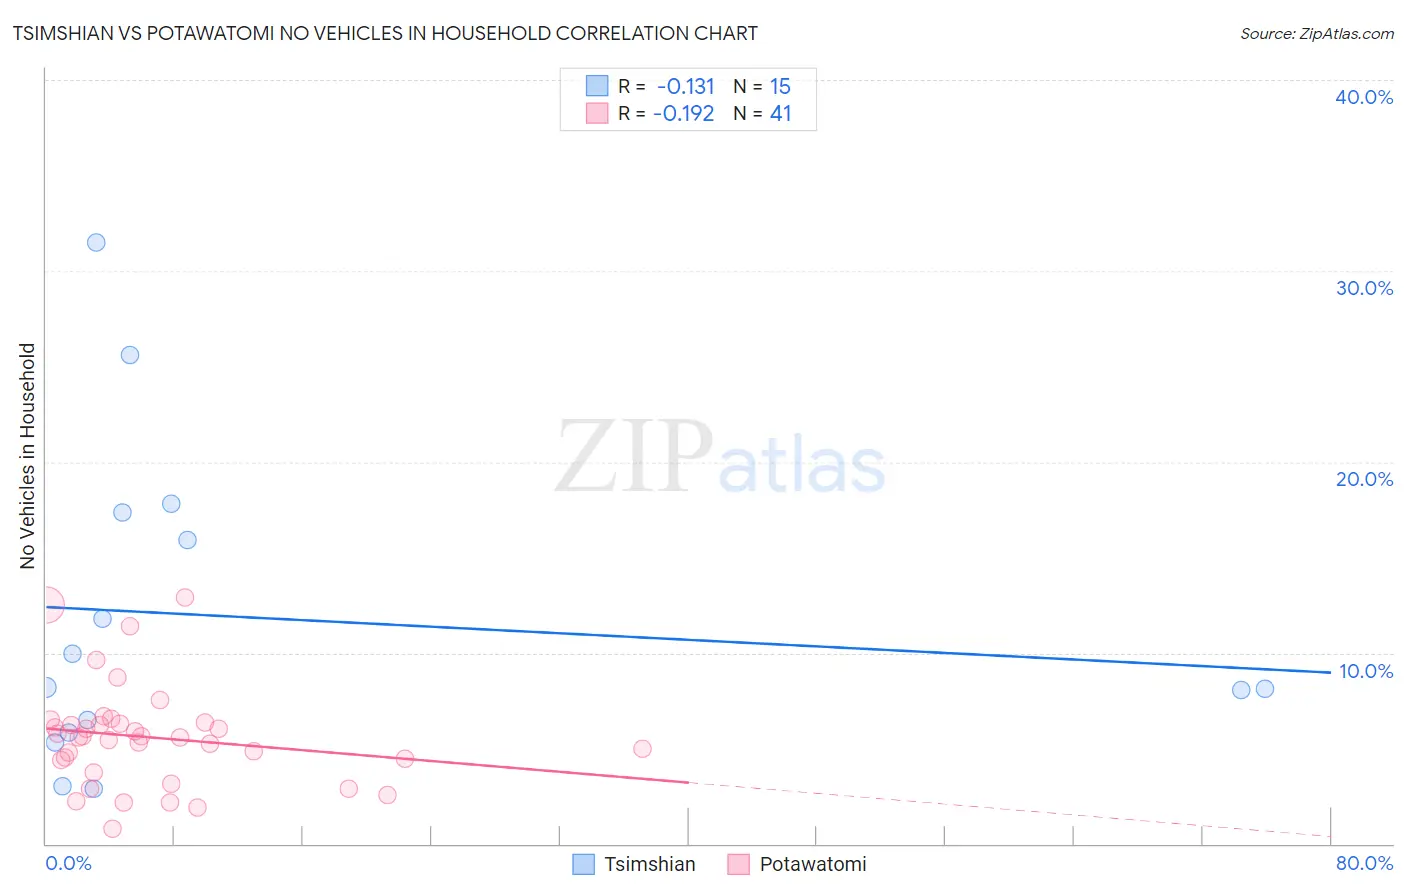
Tsimshian vs Potawatomi No Vehicles in Household Correlation Chart
The statistical analysis conducted on geographies consisting of 15,626,179 people shows a poor negative correlation between the proportion of Tsimshian and percentage of households with no vehicle available in the United States with a correlation coefficient (R) of -0.131 and weighted average of 8.6%. Similarly, the statistical analysis conducted on geographies consisting of 117,640,545 people shows a poor negative correlation between the proportion of Potawatomi and percentage of households with no vehicle available in the United States with a correlation coefficient (R) of -0.192 and weighted average of 8.8%, a difference of 2.9%.
No Vehicles in Household Correlation Summary
| Measurement | Tsimshian | Potawatomi |
| Minimum | 2.8% | 0.76% |
| Maximum | 31.5% | 12.9% |
| Range | 28.6% | 12.1% |
| Mean | 11.8% | 5.6% |
| Median | 8.2% | 5.6% |
| Interquartile 25% (IQ1) | 5.8% | 4.0% |
| Interquartile 75% (IQ3) | 17.3% | 6.3% |
| Interquartile Range (IQR) | 11.5% | 2.3% |
| Standard Deviation (Sample) | 8.3% | 2.7% |
| Standard Deviation (Population) | 8.0% | 2.6% |
Demographics Similar to Tsimshian and Potawatomi by No Vehicles in Household
In terms of no vehicles in household, the demographic groups most similar to Tsimshian are Bolivian (8.6%, a difference of 0.050%), Immigrants from South Eastern Asia (8.6%, a difference of 0.13%), Portuguese (8.6%, a difference of 0.20%), Immigrants from South Central Asia (8.6%, a difference of 0.26%), and Italian (8.6%, a difference of 0.47%). Similarly, the demographic groups most similar to Potawatomi are Austrian (8.8%, a difference of 0.14%), Immigrants from Bolivia (8.9%, a difference of 0.28%), Immigrants from Central America (8.9%, a difference of 0.94%), Immigrants from North America (8.7%, a difference of 1.1%), and Immigrants from Canada (8.7%, a difference of 1.2%).
| Demographics | Rating | Rank | No Vehicles in Household |
| Immigrants | South Central Asia | 99.5 /100 | #78 | Exceptional 8.6% |
| Portuguese | 99.5 /100 | #79 | Exceptional 8.6% |
| Bolivians | 99.4 /100 | #80 | Exceptional 8.6% |
| Tsimshian | 99.4 /100 | #81 | Exceptional 8.6% |
| Immigrants | South Eastern Asia | 99.4 /100 | #82 | Exceptional 8.6% |
| Italians | 99.4 /100 | #83 | Exceptional 8.6% |
| Immigrants | Jordan | 99.3 /100 | #84 | Exceptional 8.7% |
| Lebanese | 99.3 /100 | #85 | Exceptional 8.7% |
| Bangladeshis | 99.3 /100 | #86 | Exceptional 8.7% |
| Immigrants | England | 99.2 /100 | #87 | Exceptional 8.7% |
| Osage | 99.2 /100 | #88 | Exceptional 8.7% |
| Immigrants | Cuba | 99.2 /100 | #89 | Exceptional 8.7% |
| Bhutanese | 99.2 /100 | #90 | Exceptional 8.7% |
| Immigrants | Germany | 99.1 /100 | #91 | Exceptional 8.7% |
| Immigrants | Canada | 99.1 /100 | #92 | Exceptional 8.7% |
| Immigrants | North America | 99.1 /100 | #93 | Exceptional 8.7% |
| Austrians | 98.9 /100 | #94 | Exceptional 8.8% |
| Potawatomi | 98.8 /100 | #95 | Exceptional 8.8% |
| Immigrants | Bolivia | 98.7 /100 | #96 | Exceptional 8.9% |
| Immigrants | Central America | 98.5 /100 | #97 | Exceptional 8.9% |
| Slavs | 98.4 /100 | #98 | Exceptional 9.0% |