Trinidadian and Tobagonian vs New Zealander 4 or more Vehicles in Household
COMPARE
Trinidadian and Tobagonian
New Zealander
4 or more Vehicles in Household
4 or more Vehicles in Household Comparison
Trinidadians and Tobagonians
New Zealanders
4.3%
4 OR MORE VEHICLES IN HOUSEHOLD
0.0/ 100
METRIC RATING
328th/ 347
METRIC RANK
6.5%
4 OR MORE VEHICLES IN HOUSEHOLD
73.3/ 100
METRIC RATING
150th/ 347
METRIC RANK
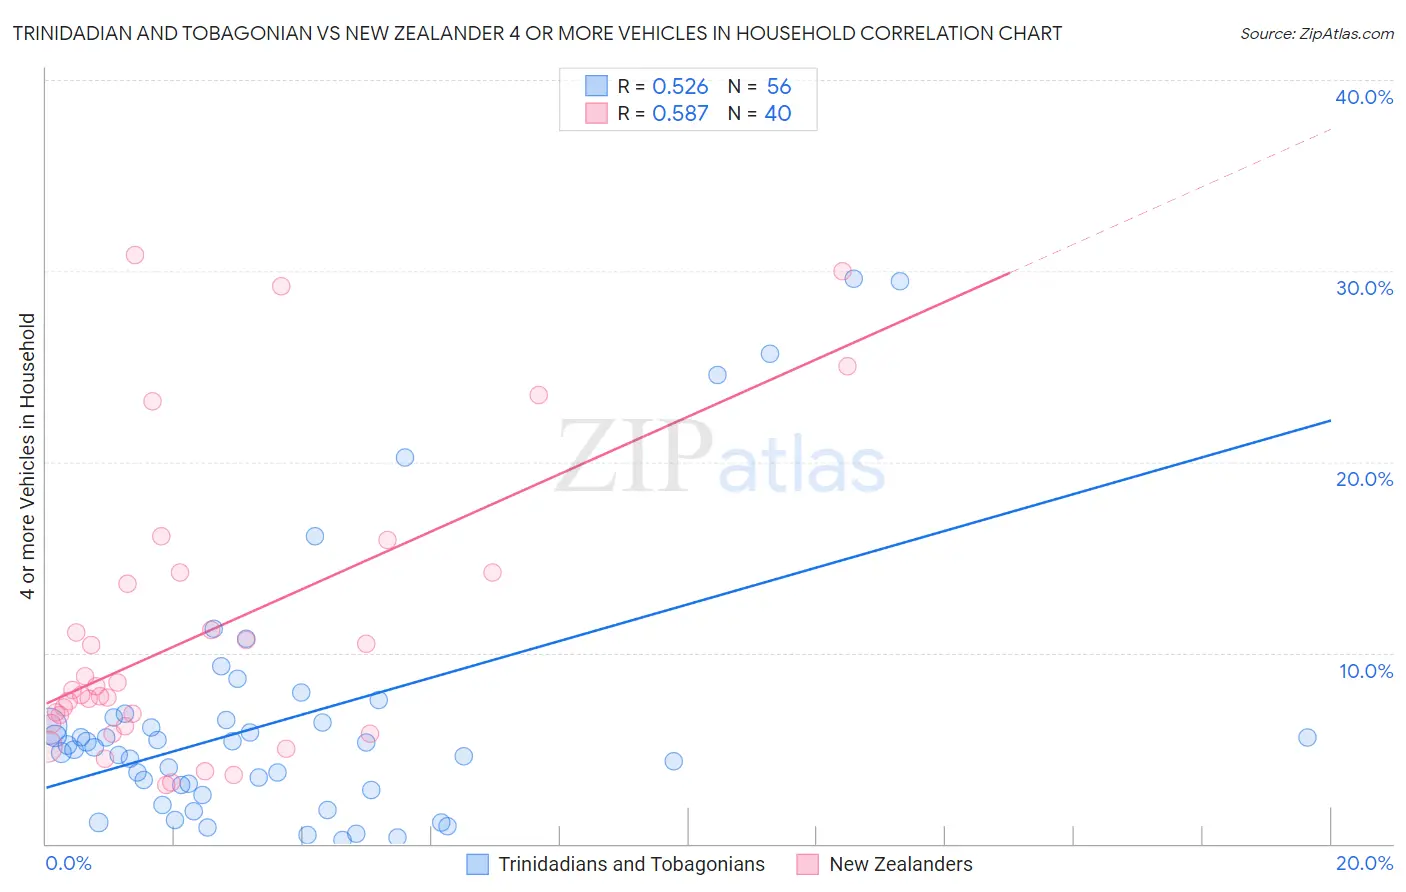
Trinidadian and Tobagonian vs New Zealander 4 or more Vehicles in Household Correlation Chart
The statistical analysis conducted on geographies consisting of 218,579,847 people shows a substantial positive correlation between the proportion of Trinidadians and Tobagonians and percentage of households with 4 or more vehicles available in the United States with a correlation coefficient (R) of 0.526 and weighted average of 4.3%. Similarly, the statistical analysis conducted on geographies consisting of 106,639,386 people shows a substantial positive correlation between the proportion of New Zealanders and percentage of households with 4 or more vehicles available in the United States with a correlation coefficient (R) of 0.587 and weighted average of 6.5%, a difference of 52.5%.
4 or more Vehicles in Household Correlation Summary
| Measurement | Trinidadian and Tobagonian | New Zealander |
| Minimum | 0.23% | 3.1% |
| Maximum | 29.6% | 30.9% |
| Range | 29.4% | 27.8% |
| Mean | 6.6% | 11.0% |
| Median | 5.1% | 7.9% |
| Interquartile 25% (IQ1) | 3.0% | 6.2% |
| Interquartile 75% (IQ3) | 6.6% | 13.9% |
| Interquartile Range (IQR) | 3.6% | 7.7% |
| Standard Deviation (Sample) | 6.8% | 7.6% |
| Standard Deviation (Population) | 6.8% | 7.5% |
Similar Demographics by 4 or more Vehicles in Household
Demographics Similar to Trinidadians and Tobagonians by 4 or more Vehicles in Household
In terms of 4 or more vehicles in household, the demographic groups most similar to Trinidadians and Tobagonians are Immigrants from Senegal (4.2%, a difference of 0.27%), Immigrants from Ecuador (4.2%, a difference of 0.47%), West Indian (4.2%, a difference of 0.73%), Senegalese (4.3%, a difference of 1.6%), and Immigrants from Dominica (4.2%, a difference of 1.6%).
| Demographics | Rating | Rank | 4 or more Vehicles in Household |
| Ecuadorians | 0.0 /100 | #321 | Tragic 4.5% |
| Immigrants | Yemen | 0.0 /100 | #322 | Tragic 4.5% |
| Immigrants | Caribbean | 0.0 /100 | #323 | Tragic 4.4% |
| Soviet Union | 0.0 /100 | #324 | Tragic 4.4% |
| Immigrants | Jamaica | 0.0 /100 | #325 | Tragic 4.4% |
| Cape Verdeans | 0.0 /100 | #326 | Tragic 4.4% |
| Senegalese | 0.0 /100 | #327 | Tragic 4.3% |
| Trinidadians and Tobagonians | 0.0 /100 | #328 | Tragic 4.3% |
| Immigrants | Senegal | 0.0 /100 | #329 | Tragic 4.2% |
| Immigrants | Ecuador | 0.0 /100 | #330 | Tragic 4.2% |
| West Indians | 0.0 /100 | #331 | Tragic 4.2% |
| Immigrants | Dominica | 0.0 /100 | #332 | Tragic 4.2% |
| Immigrants | Albania | 0.0 /100 | #333 | Tragic 4.1% |
| Immigrants | Trinidad and Tobago | 0.0 /100 | #334 | Tragic 4.1% |
| Barbadians | 0.0 /100 | #335 | Tragic 3.9% |
Demographics Similar to New Zealanders by 4 or more Vehicles in Household
In terms of 4 or more vehicles in household, the demographic groups most similar to New Zealanders are Immigrants from Jordan (6.5%, a difference of 0.040%), Greek (6.5%, a difference of 0.040%), Immigrants from Iran (6.5%, a difference of 0.080%), Immigrants from Costa Rica (6.5%, a difference of 0.13%), and Immigrants from Hong Kong (6.5%, a difference of 0.14%).
| Demographics | Rating | Rank | 4 or more Vehicles in Household |
| Immigrants | Canada | 78.6 /100 | #143 | Good 6.5% |
| Immigrants | North America | 78.5 /100 | #144 | Good 6.5% |
| Croatians | 77.8 /100 | #145 | Good 6.5% |
| Immigrants | Costa Rica | 74.4 /100 | #146 | Good 6.5% |
| Immigrants | Iran | 73.9 /100 | #147 | Good 6.5% |
| Immigrants | Jordan | 73.7 /100 | #148 | Good 6.5% |
| Greeks | 73.6 /100 | #149 | Good 6.5% |
| New Zealanders | 73.3 /100 | #150 | Good 6.5% |
| Immigrants | Hong Kong | 72.2 /100 | #151 | Good 6.5% |
| Yuman | 72.1 /100 | #152 | Good 6.5% |
| Immigrants | Armenia | 71.2 /100 | #153 | Good 6.5% |
| Central American Indians | 71.1 /100 | #154 | Good 6.5% |
| Iroquois | 70.4 /100 | #155 | Good 6.5% |
| Iranians | 69.9 /100 | #156 | Good 6.5% |
| Peruvians | 69.4 /100 | #157 | Good 6.5% |