Syrian vs Immigrants from Belize Vision Disability
COMPARE
Syrian
Immigrants from Belize
Vision Disability
Vision Disability Comparison
Syrians
Immigrants from Belize
2.1%
VISION DISABILITY
87.5/ 100
METRIC RATING
133rd/ 347
METRIC RANK
2.4%
VISION DISABILITY
0.1/ 100
METRIC RATING
263rd/ 347
METRIC RANK
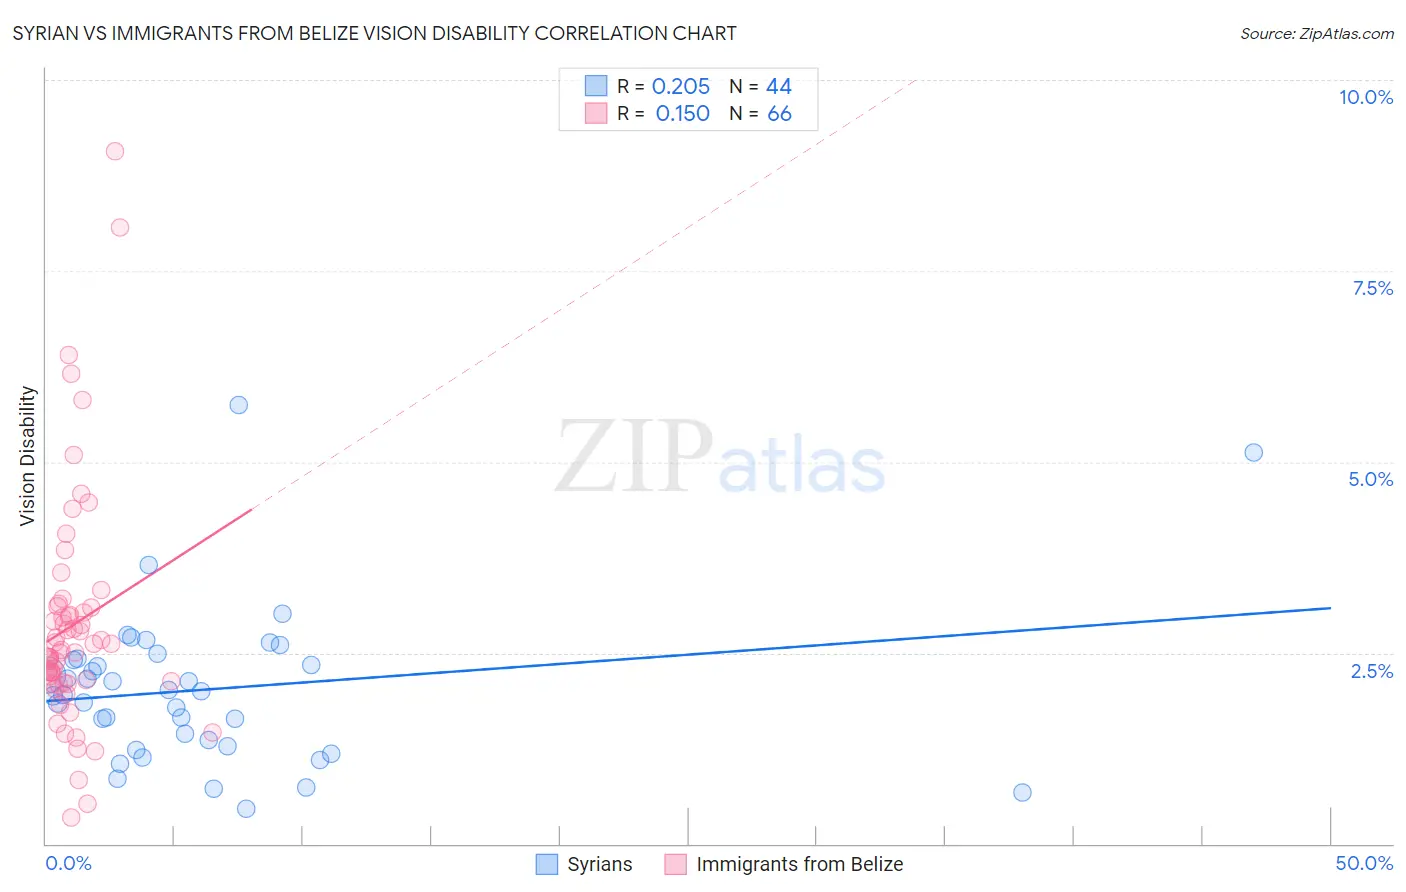
Syrian vs Immigrants from Belize Vision Disability Correlation Chart
The statistical analysis conducted on geographies consisting of 266,224,532 people shows a weak positive correlation between the proportion of Syrians and percentage of population with vision disability in the United States with a correlation coefficient (R) of 0.205 and weighted average of 2.1%. Similarly, the statistical analysis conducted on geographies consisting of 130,278,815 people shows a poor positive correlation between the proportion of Immigrants from Belize and percentage of population with vision disability in the United States with a correlation coefficient (R) of 0.150 and weighted average of 2.4%, a difference of 14.1%.
Vision Disability Correlation Summary
| Measurement | Syrian | Immigrants from Belize |
| Minimum | 0.46% | 0.34% |
| Maximum | 5.8% | 9.1% |
| Range | 5.3% | 8.7% |
| Mean | 2.0% | 2.9% |
| Median | 2.0% | 2.5% |
| Interquartile 25% (IQ1) | 1.3% | 2.1% |
| Interquartile 75% (IQ3) | 2.4% | 3.1% |
| Interquartile Range (IQR) | 1.1% | 0.99% |
| Standard Deviation (Sample) | 1.0% | 1.5% |
| Standard Deviation (Population) | 1.0% | 1.5% |
Similar Demographics by Vision Disability
Demographics Similar to Syrians by Vision Disability
In terms of vision disability, the demographic groups most similar to Syrians are Venezuelan (2.1%, a difference of 0.050%), New Zealander (2.1%, a difference of 0.10%), Vietnamese (2.1%, a difference of 0.12%), Immigrants from Hungary (2.1%, a difference of 0.17%), and Czech (2.1%, a difference of 0.17%).
| Demographics | Rating | Rank | Vision Disability |
| Immigrants | Peru | 89.5 /100 | #126 | Excellent 2.1% |
| Sudanese | 89.2 /100 | #127 | Excellent 2.1% |
| Immigrants | Chile | 89.0 /100 | #128 | Excellent 2.1% |
| Immigrants | Cameroon | 88.8 /100 | #129 | Excellent 2.1% |
| Immigrants | Kenya | 88.7 /100 | #130 | Excellent 2.1% |
| Immigrants | Hungary | 88.7 /100 | #131 | Excellent 2.1% |
| New Zealanders | 88.2 /100 | #132 | Excellent 2.1% |
| Syrians | 87.5 /100 | #133 | Excellent 2.1% |
| Venezuelans | 87.2 /100 | #134 | Excellent 2.1% |
| Vietnamese | 86.7 /100 | #135 | Excellent 2.1% |
| Czechs | 86.3 /100 | #136 | Excellent 2.1% |
| Immigrants | South Eastern Asia | 86.3 /100 | #137 | Excellent 2.1% |
| Arabs | 86.3 /100 | #138 | Excellent 2.1% |
| Immigrants | Morocco | 85.2 /100 | #139 | Excellent 2.1% |
| Immigrants | Netherlands | 84.2 /100 | #140 | Excellent 2.1% |
Demographics Similar to Immigrants from Belize by Vision Disability
In terms of vision disability, the demographic groups most similar to Immigrants from Belize are Immigrants from Liberia (2.4%, a difference of 0.12%), Immigrants from Jamaica (2.4%, a difference of 0.14%), Mexican American Indian (2.4%, a difference of 0.19%), Ute (2.4%, a difference of 0.20%), and Jamaican (2.4%, a difference of 0.26%).
| Demographics | Rating | Rank | Vision Disability |
| Immigrants | Haiti | 0.2 /100 | #256 | Tragic 2.4% |
| West Indians | 0.2 /100 | #257 | Tragic 2.4% |
| British West Indians | 0.2 /100 | #258 | Tragic 2.4% |
| Whites/Caucasians | 0.2 /100 | #259 | Tragic 2.4% |
| Belizeans | 0.2 /100 | #260 | Tragic 2.4% |
| Fijians | 0.1 /100 | #261 | Tragic 2.4% |
| Jamaicans | 0.1 /100 | #262 | Tragic 2.4% |
| Immigrants | Belize | 0.1 /100 | #263 | Tragic 2.4% |
| Immigrants | Liberia | 0.1 /100 | #264 | Tragic 2.4% |
| Immigrants | Jamaica | 0.1 /100 | #265 | Tragic 2.4% |
| Mexican American Indians | 0.1 /100 | #266 | Tragic 2.4% |
| Ute | 0.1 /100 | #267 | Tragic 2.4% |
| Senegalese | 0.1 /100 | #268 | Tragic 2.4% |
| Celtics | 0.1 /100 | #269 | Tragic 2.4% |
| Cubans | 0.1 /100 | #270 | Tragic 2.4% |