Swiss vs Apache 6th Grade
COMPARE
Swiss
Apache
6th Grade
6th Grade Comparison
Swiss
Apache
97.9%
6TH GRADE
100.0/ 100
METRIC RATING
34th/ 347
METRIC RANK
97.1%
6TH GRADE
53.6/ 100
METRIC RATING
167th/ 347
METRIC RANK
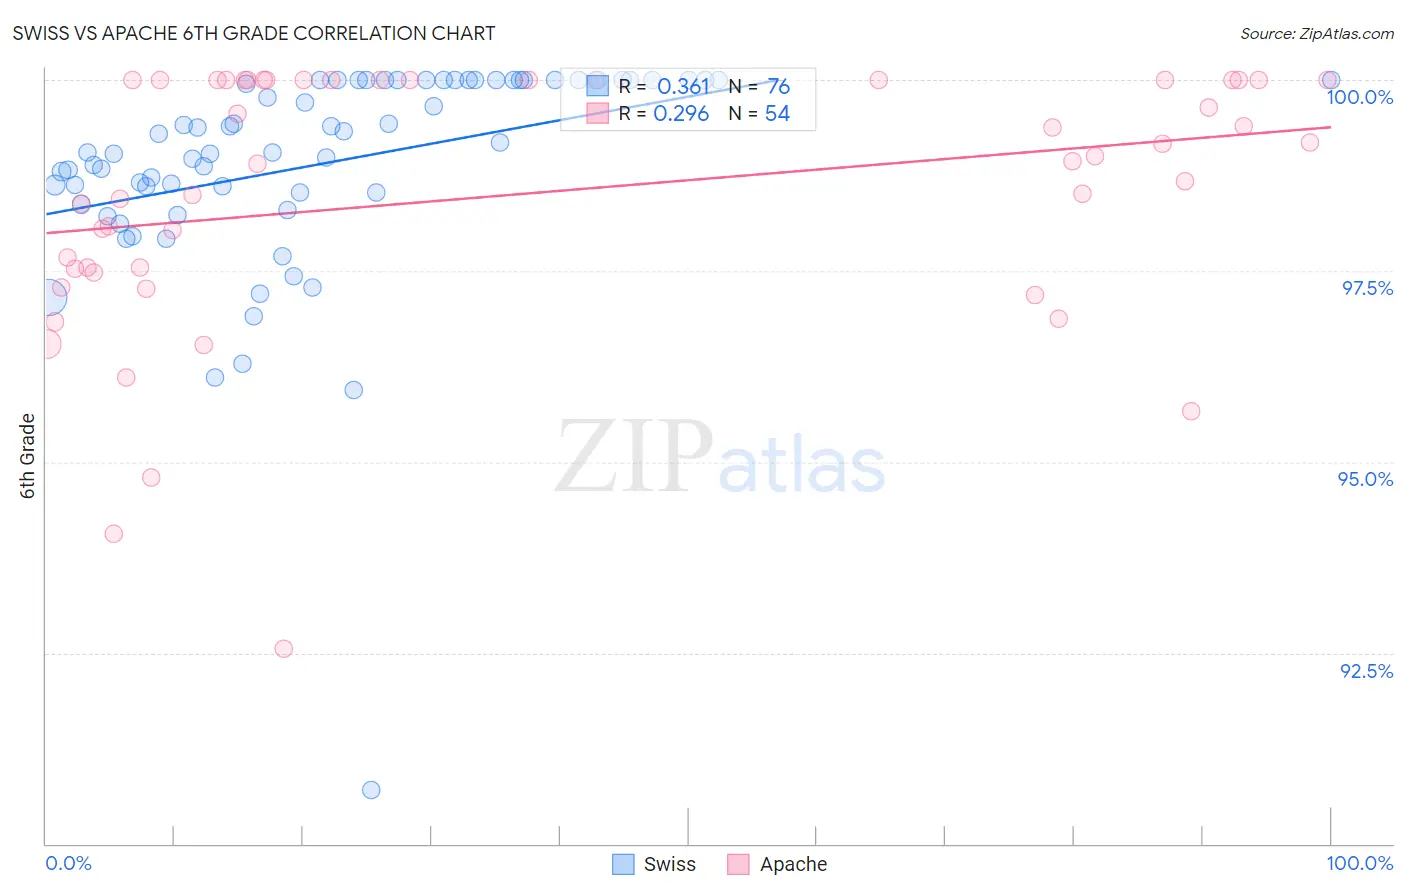
Swiss vs Apache 6th Grade Correlation Chart
The statistical analysis conducted on geographies consisting of 465,021,856 people shows a mild positive correlation between the proportion of Swiss and percentage of population with at least 6th grade education in the United States with a correlation coefficient (R) of 0.361 and weighted average of 97.9%. Similarly, the statistical analysis conducted on geographies consisting of 231,142,814 people shows a weak positive correlation between the proportion of Apache and percentage of population with at least 6th grade education in the United States with a correlation coefficient (R) of 0.296 and weighted average of 97.1%, a difference of 0.91%.
6th Grade Correlation Summary
| Measurement | Swiss | Apache |
| Minimum | 90.7% | 92.5% |
| Maximum | 100.0% | 100.0% |
| Range | 9.3% | 7.5% |
| Mean | 98.9% | 98.5% |
| Median | 99.1% | 99.0% |
| Interquartile 25% (IQ1) | 98.5% | 97.5% |
| Interquartile 75% (IQ3) | 100.0% | 100.0% |
| Interquartile Range (IQR) | 1.5% | 2.5% |
| Standard Deviation (Sample) | 1.4% | 1.7% |
| Standard Deviation (Population) | 1.4% | 1.7% |
Similar Demographics by 6th Grade
Demographics Similar to Swiss by 6th Grade
In terms of 6th grade, the demographic groups most similar to Swiss are Chippewa (97.9%, a difference of 0.0%), Chinese (97.9%, a difference of 0.020%), Italian (97.9%, a difference of 0.030%), British (97.9%, a difference of 0.030%), and Alaska Native (98.0%, a difference of 0.040%).
| Demographics | Rating | Rank | 6th Grade |
| Yup'ik | 100.0 /100 | #27 | Exceptional 98.0% |
| Scandinavians | 100.0 /100 | #28 | Exceptional 98.0% |
| French | 100.0 /100 | #29 | Exceptional 98.0% |
| French Canadians | 100.0 /100 | #30 | Exceptional 98.0% |
| Europeans | 100.0 /100 | #31 | Exceptional 98.0% |
| Alaska Natives | 100.0 /100 | #32 | Exceptional 98.0% |
| Chippewa | 100.0 /100 | #33 | Exceptional 97.9% |
| Swiss | 100.0 /100 | #34 | Exceptional 97.9% |
| Chinese | 100.0 /100 | #35 | Exceptional 97.9% |
| Italians | 100.0 /100 | #36 | Exceptional 97.9% |
| British | 100.0 /100 | #37 | Exceptional 97.9% |
| Belgians | 100.0 /100 | #38 | Exceptional 97.9% |
| Luxembourgers | 99.9 /100 | #39 | Exceptional 97.9% |
| Latvians | 99.9 /100 | #40 | Exceptional 97.9% |
| Eastern Europeans | 99.9 /100 | #41 | Exceptional 97.9% |
Demographics Similar to Apache by 6th Grade
In terms of 6th grade, the demographic groups most similar to Apache are Immigrants from Italy (97.1%, a difference of 0.0%), Immigrants from Taiwan (97.1%, a difference of 0.0%), Bermudan (97.1%, a difference of 0.0%), Immigrants from Poland (97.1%, a difference of 0.010%), and Chilean (97.1%, a difference of 0.010%).
| Demographics | Rating | Rank | 6th Grade |
| Ugandans | 62.2 /100 | #160 | Good 97.1% |
| Immigrants | Belarus | 60.4 /100 | #161 | Good 97.1% |
| Marshallese | 60.2 /100 | #162 | Good 97.1% |
| Albanians | 57.8 /100 | #163 | Average 97.1% |
| Immigrants | Korea | 57.7 /100 | #164 | Average 97.1% |
| Immigrants | Poland | 56.2 /100 | #165 | Average 97.1% |
| Immigrants | Italy | 53.8 /100 | #166 | Average 97.1% |
| Apache | 53.6 /100 | #167 | Average 97.1% |
| Immigrants | Taiwan | 53.5 /100 | #168 | Average 97.1% |
| Bermudans | 52.6 /100 | #169 | Average 97.1% |
| Chileans | 52.1 /100 | #170 | Average 97.1% |
| Immigrants | Sri Lanka | 51.7 /100 | #171 | Average 97.1% |
| Egyptians | 50.9 /100 | #172 | Average 97.1% |
| Arabs | 50.1 /100 | #173 | Average 97.0% |
| Venezuelans | 50.0 /100 | #174 | Average 97.0% |