Latvian vs Immigrants from Caribbean No Vehicles in Household
COMPARE
Latvian
Immigrants from Caribbean
No Vehicles in Household
No Vehicles in Household Comparison
Latvians
Immigrants from Caribbean
9.8%
NO VEHICLES IN HOUSEHOLD
85.1/ 100
METRIC RATING
135th/ 347
METRIC RANK
19.6%
NO VEHICLES IN HOUSEHOLD
0.0/ 100
METRIC RATING
324th/ 347
METRIC RANK
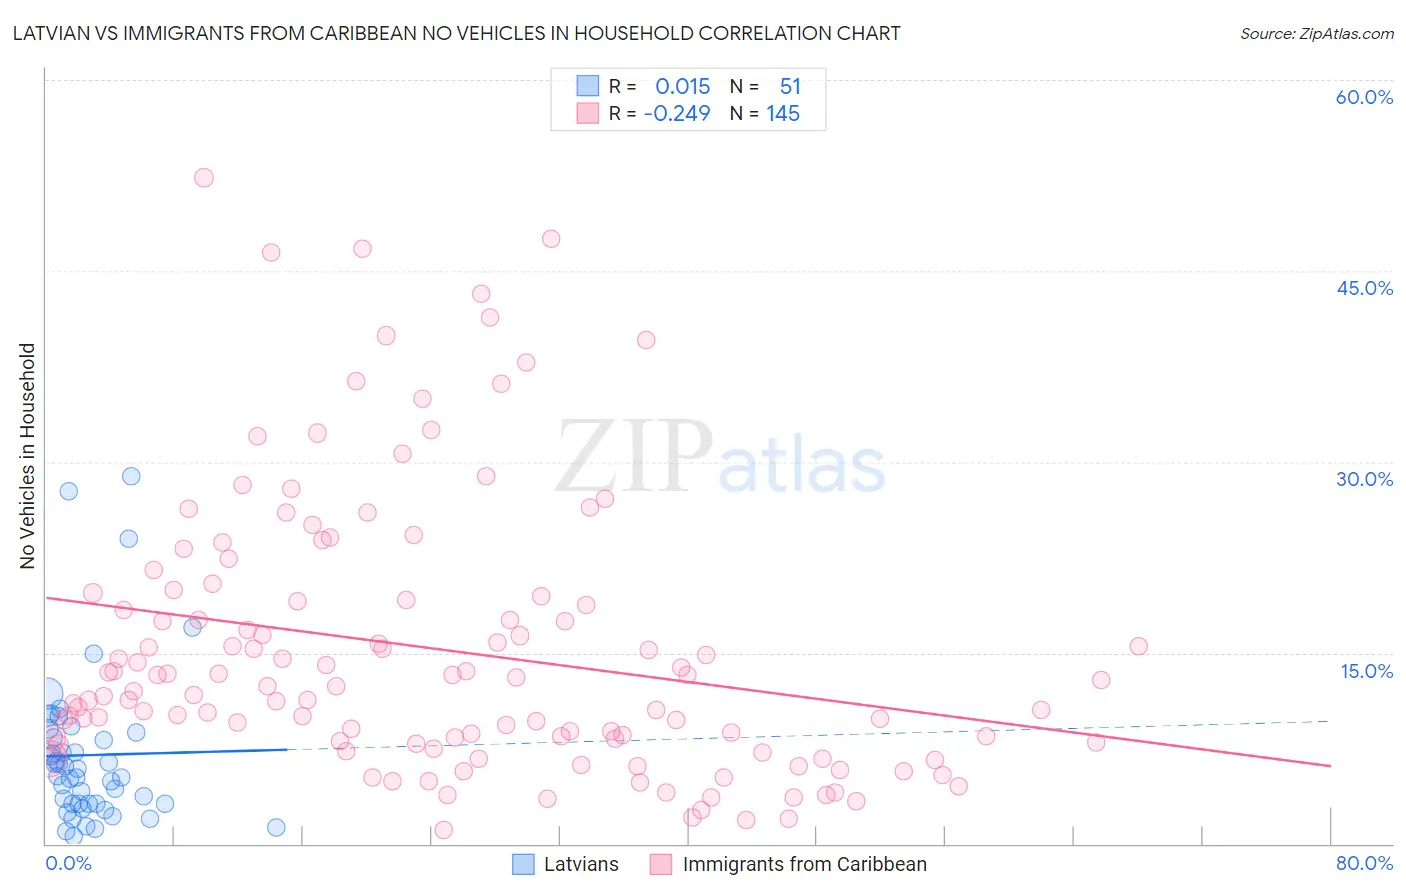
Latvian vs Immigrants from Caribbean No Vehicles in Household Correlation Chart
The statistical analysis conducted on geographies consisting of 220,382,965 people shows no correlation between the proportion of Latvians and percentage of households with no vehicle available in the United States with a correlation coefficient (R) of 0.015 and weighted average of 9.8%. Similarly, the statistical analysis conducted on geographies consisting of 448,573,126 people shows a weak negative correlation between the proportion of Immigrants from Caribbean and percentage of households with no vehicle available in the United States with a correlation coefficient (R) of -0.249 and weighted average of 19.6%, a difference of 100.4%.
No Vehicles in Household Correlation Summary
| Measurement | Latvian | Immigrants from Caribbean |
| Minimum | 0.54% | 1.0% |
| Maximum | 28.8% | 52.3% |
| Range | 28.3% | 51.3% |
| Mean | 7.0% | 15.3% |
| Median | 5.3% | 12.4% |
| Interquartile 25% (IQ1) | 3.1% | 8.0% |
| Interquartile 75% (IQ3) | 8.8% | 19.3% |
| Interquartile Range (IQR) | 5.7% | 11.3% |
| Standard Deviation (Sample) | 6.1% | 10.8% |
| Standard Deviation (Population) | 6.1% | 10.8% |
Similar Demographics by No Vehicles in Household
Demographics Similar to Latvians by No Vehicles in Household
In terms of no vehicles in household, the demographic groups most similar to Latvians are Immigrants from South Africa (9.8%, a difference of 0.050%), Immigrants from Moldova (9.8%, a difference of 0.15%), Estonian (9.8%, a difference of 0.27%), Marshallese (9.8%, a difference of 0.31%), and Immigrants from Lithuania (9.8%, a difference of 0.32%).
| Demographics | Rating | Rank | No Vehicles in Household |
| Immigrants | Syria | 89.5 /100 | #128 | Excellent 9.6% |
| Nicaraguans | 89.5 /100 | #129 | Excellent 9.7% |
| Burmese | 88.8 /100 | #130 | Excellent 9.7% |
| Immigrants | Azores | 88.2 /100 | #131 | Excellent 9.7% |
| Kenyans | 88.0 /100 | #132 | Excellent 9.7% |
| Immigrants | Oceania | 87.1 /100 | #133 | Excellent 9.7% |
| Syrians | 87.1 /100 | #134 | Excellent 9.7% |
| Latvians | 85.1 /100 | #135 | Excellent 9.8% |
| Immigrants | South Africa | 85.0 /100 | #136 | Excellent 9.8% |
| Immigrants | Moldova | 84.6 /100 | #137 | Excellent 9.8% |
| Estonians | 84.2 /100 | #138 | Excellent 9.8% |
| Marshallese | 84.0 /100 | #139 | Excellent 9.8% |
| Immigrants | Lithuania | 84.0 /100 | #140 | Excellent 9.8% |
| Sudanese | 83.1 /100 | #141 | Excellent 9.8% |
| Immigrants | Zimbabwe | 82.6 /100 | #142 | Excellent 9.9% |
Demographics Similar to Immigrants from Caribbean by No Vehicles in Household
In terms of no vehicles in household, the demographic groups most similar to Immigrants from Caribbean are Senegalese (19.8%, a difference of 0.72%), Immigrants from Yemen (19.5%, a difference of 0.73%), Immigrants from West Indies (20.5%, a difference of 4.7%), Immigrants from Cabo Verde (18.4%, a difference of 6.3%), and Immigrants from Senegal (21.1%, a difference of 7.8%).
| Demographics | Rating | Rank | No Vehicles in Household |
| Immigrants | Ghana | 0.0 /100 | #317 | Tragic 16.6% |
| Immigrants | Belarus | 0.0 /100 | #318 | Tragic 16.7% |
| Alaska Natives | 0.0 /100 | #319 | Tragic 17.4% |
| Soviet Union | 0.0 /100 | #320 | Tragic 17.4% |
| Jamaicans | 0.0 /100 | #321 | Tragic 17.9% |
| Immigrants | Cabo Verde | 0.0 /100 | #322 | Tragic 18.4% |
| Immigrants | Yemen | 0.0 /100 | #323 | Tragic 19.5% |
| Immigrants | Caribbean | 0.0 /100 | #324 | Tragic 19.6% |
| Senegalese | 0.0 /100 | #325 | Tragic 19.8% |
| Immigrants | West Indies | 0.0 /100 | #326 | Tragic 20.5% |
| Immigrants | Senegal | 0.0 /100 | #327 | Tragic 21.1% |
| Immigrants | Dominica | 0.0 /100 | #328 | Tragic 22.2% |
| Ecuadorians | 0.0 /100 | #329 | Tragic 22.8% |
| West Indians | 0.0 /100 | #330 | Tragic 23.7% |
| Trinidadians and Tobagonians | 0.0 /100 | #331 | Tragic 23.7% |