Spanish American vs Puget Sound Salish 11th Grade
COMPARE
Spanish American
Puget Sound Salish
11th Grade
11th Grade Comparison
Spanish Americans
Puget Sound Salish
91.4%
11TH GRADE
0.6/ 100
METRIC RATING
260th/ 347
METRIC RANK
93.6%
11TH GRADE
99.1/ 100
METRIC RATING
93rd/ 347
METRIC RANK
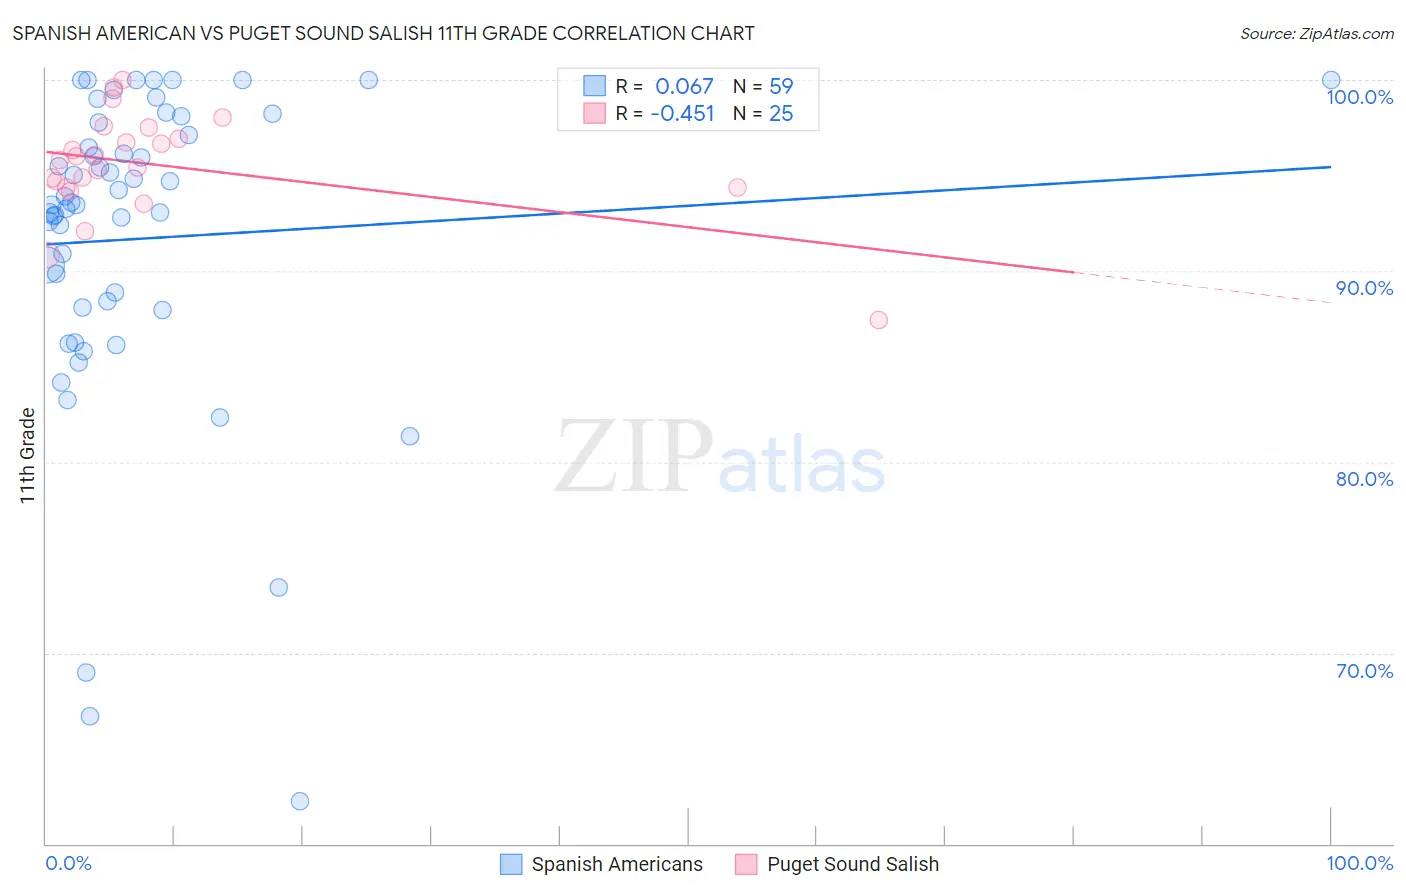
Spanish American vs Puget Sound Salish 11th Grade Correlation Chart
The statistical analysis conducted on geographies consisting of 103,168,542 people shows a slight positive correlation between the proportion of Spanish Americans and percentage of population with at least 11th grade education in the United States with a correlation coefficient (R) of 0.067 and weighted average of 91.4%. Similarly, the statistical analysis conducted on geographies consisting of 46,155,775 people shows a moderate negative correlation between the proportion of Puget Sound Salish and percentage of population with at least 11th grade education in the United States with a correlation coefficient (R) of -0.451 and weighted average of 93.6%, a difference of 2.4%.
11th Grade Correlation Summary
| Measurement | Spanish American | Puget Sound Salish |
| Minimum | 62.3% | 87.4% |
| Maximum | 100.0% | 100.0% |
| Range | 37.7% | 12.6% |
| Mean | 91.7% | 95.5% |
| Median | 93.5% | 95.8% |
| Interquartile 25% (IQ1) | 88.1% | 94.4% |
| Interquartile 75% (IQ3) | 97.8% | 97.2% |
| Interquartile Range (IQR) | 9.7% | 2.8% |
| Standard Deviation (Sample) | 8.3% | 2.7% |
| Standard Deviation (Population) | 8.2% | 2.7% |
Similar Demographics by 11th Grade
Demographics Similar to Spanish Americans by 11th Grade
In terms of 11th grade, the demographic groups most similar to Spanish Americans are Jamaican (91.4%, a difference of 0.010%), Taiwanese (91.3%, a difference of 0.010%), Immigrants from Colombia (91.4%, a difference of 0.020%), Immigrants from Uruguay (91.3%, a difference of 0.020%), and Cajun (91.4%, a difference of 0.040%).
| Demographics | Rating | Rank | 11th Grade |
| Immigrants | South America | 0.8 /100 | #253 | Tragic 91.4% |
| Immigrants | Eritrea | 0.7 /100 | #254 | Tragic 91.4% |
| Blacks/African Americans | 0.7 /100 | #255 | Tragic 91.4% |
| Immigrants | Senegal | 0.7 /100 | #256 | Tragic 91.4% |
| Cajuns | 0.7 /100 | #257 | Tragic 91.4% |
| Immigrants | Colombia | 0.6 /100 | #258 | Tragic 91.4% |
| Jamaicans | 0.6 /100 | #259 | Tragic 91.4% |
| Spanish Americans | 0.6 /100 | #260 | Tragic 91.4% |
| Taiwanese | 0.6 /100 | #261 | Tragic 91.3% |
| Immigrants | Uruguay | 0.5 /100 | #262 | Tragic 91.3% |
| Immigrants | Ghana | 0.3 /100 | #263 | Tragic 91.2% |
| Yup'ik | 0.3 /100 | #264 | Tragic 91.2% |
| Pueblo | 0.3 /100 | #265 | Tragic 91.2% |
| Immigrants | Western Africa | 0.3 /100 | #266 | Tragic 91.2% |
| Immigrants | Jamaica | 0.3 /100 | #267 | Tragic 91.2% |
Demographics Similar to Puget Sound Salish by 11th Grade
In terms of 11th grade, the demographic groups most similar to Puget Sound Salish are Immigrants from Bulgaria (93.6%, a difference of 0.020%), Swiss (93.6%, a difference of 0.020%), Immigrants from France (93.6%, a difference of 0.020%), South African (93.6%, a difference of 0.030%), and Ottawa (93.6%, a difference of 0.040%).
| Demographics | Rating | Rank | 11th Grade |
| Immigrants | South Central Asia | 99.2 /100 | #86 | Exceptional 93.6% |
| Immigrants | Western Europe | 99.2 /100 | #87 | Exceptional 93.6% |
| Cambodians | 99.2 /100 | #88 | Exceptional 93.6% |
| Burmese | 99.2 /100 | #89 | Exceptional 93.6% |
| Ottawa | 99.2 /100 | #90 | Exceptional 93.6% |
| South Africans | 99.2 /100 | #91 | Exceptional 93.6% |
| Immigrants | Bulgaria | 99.1 /100 | #92 | Exceptional 93.6% |
| Puget Sound Salish | 99.1 /100 | #93 | Exceptional 93.6% |
| Swiss | 99.0 /100 | #94 | Exceptional 93.6% |
| Immigrants | France | 99.0 /100 | #95 | Exceptional 93.6% |
| Immigrants | Turkey | 98.9 /100 | #96 | Exceptional 93.5% |
| Immigrants | Iran | 98.9 /100 | #97 | Exceptional 93.5% |
| Immigrants | Israel | 98.8 /100 | #98 | Exceptional 93.5% |
| Menominee | 98.7 /100 | #99 | Exceptional 93.5% |
| Immigrants | North Macedonia | 98.7 /100 | #100 | Exceptional 93.5% |