Immigrants from Cambodia vs Dutch 2 or more Vehicles in Household
COMPARE
Immigrants from Cambodia
Dutch
2 or more Vehicles in Household
2 or more Vehicles in Household Comparison
Immigrants from Cambodia
Dutch
56.2%
2 OR MORE VEHICLES IN HOUSEHOLD
83.6/ 100
METRIC RATING
141st/ 347
METRIC RANK
61.6%
2 OR MORE VEHICLES IN HOUSEHOLD
100.0/ 100
METRIC RATING
11th/ 347
METRIC RANK
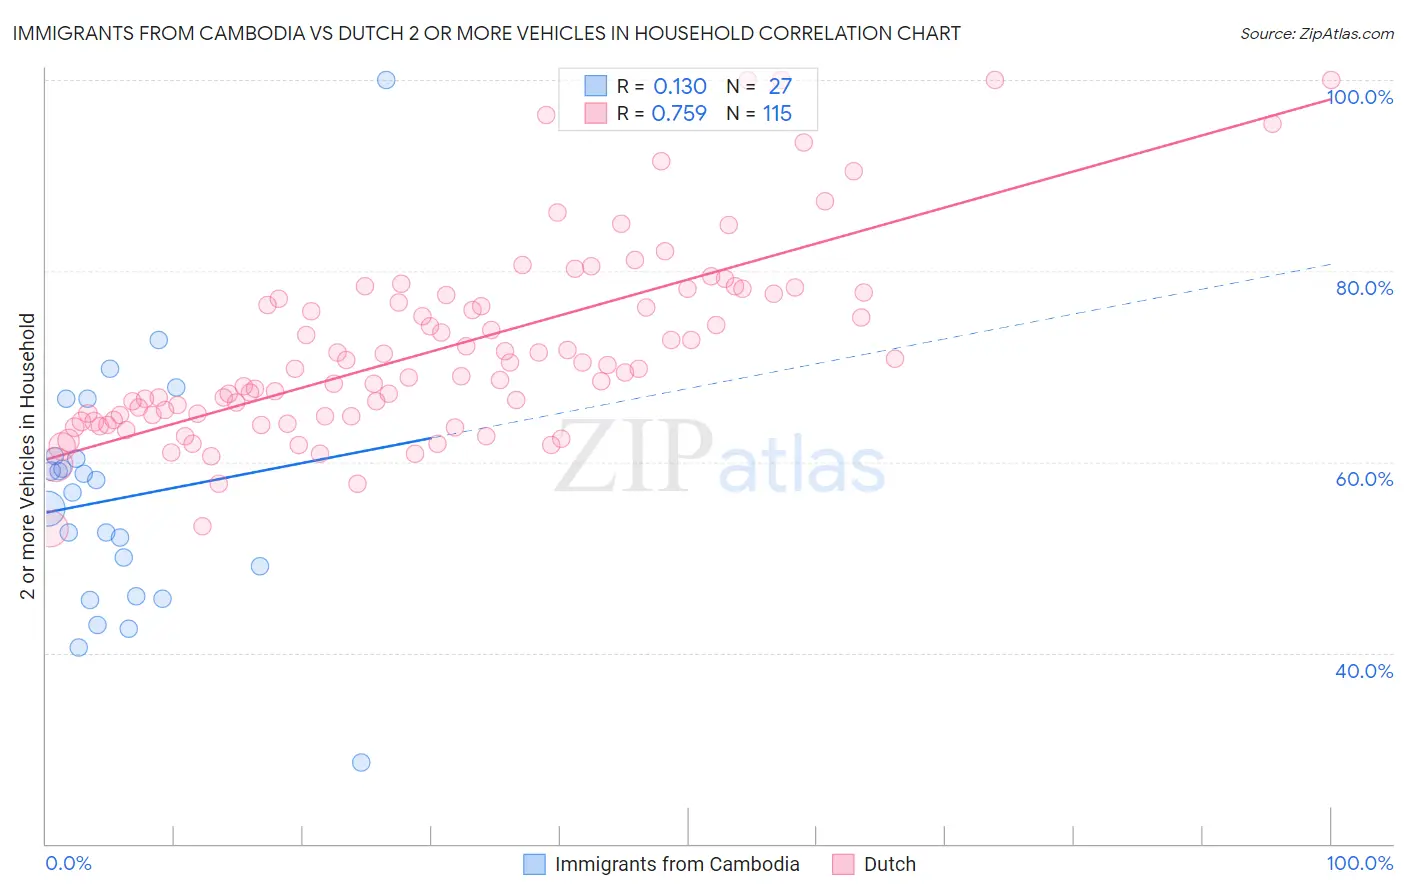
Immigrants from Cambodia vs Dutch 2 or more Vehicles in Household Correlation Chart
The statistical analysis conducted on geographies consisting of 205,137,461 people shows a poor positive correlation between the proportion of Immigrants from Cambodia and percentage of households with 2 or more vehicles available in the United States with a correlation coefficient (R) of 0.130 and weighted average of 56.2%. Similarly, the statistical analysis conducted on geographies consisting of 553,922,403 people shows a strong positive correlation between the proportion of Dutch and percentage of households with 2 or more vehicles available in the United States with a correlation coefficient (R) of 0.759 and weighted average of 61.6%, a difference of 9.6%.
2 or more Vehicles in Household Correlation Summary
| Measurement | Immigrants from Cambodia | Dutch |
| Minimum | 28.6% | 53.0% |
| Maximum | 100.0% | 100.0% |
| Range | 71.4% | 47.0% |
| Mean | 56.3% | 71.8% |
| Median | 56.8% | 69.7% |
| Interquartile 25% (IQ1) | 46.0% | 64.7% |
| Interquartile 75% (IQ3) | 60.7% | 77.5% |
| Interquartile Range (IQR) | 14.7% | 12.8% |
| Standard Deviation (Sample) | 13.4% | 10.0% |
| Standard Deviation (Population) | 13.1% | 10.0% |
Similar Demographics by 2 or more Vehicles in Household
Demographics Similar to Immigrants from Cambodia by 2 or more Vehicles in Household
In terms of 2 or more vehicles in household, the demographic groups most similar to Immigrants from Cambodia are Latvian (56.2%, a difference of 0.0%), South African (56.2%, a difference of 0.040%), Armenian (56.3%, a difference of 0.050%), Salvadoran (56.3%, a difference of 0.080%), and Cuban (56.3%, a difference of 0.090%).
| Demographics | Rating | Rank | 2 or more Vehicles in Household |
| Immigrants | Azores | 86.6 /100 | #134 | Excellent 56.4% |
| Blackfeet | 86.5 /100 | #135 | Excellent 56.4% |
| Immigrants | Asia | 86.0 /100 | #136 | Excellent 56.3% |
| Cubans | 84.8 /100 | #137 | Excellent 56.3% |
| Salvadorans | 84.7 /100 | #138 | Excellent 56.3% |
| Armenians | 84.3 /100 | #139 | Excellent 56.3% |
| Latvians | 83.6 /100 | #140 | Excellent 56.2% |
| Immigrants | Cambodia | 83.6 /100 | #141 | Excellent 56.2% |
| South Africans | 83.1 /100 | #142 | Excellent 56.2% |
| Seminole | 81.7 /100 | #143 | Excellent 56.2% |
| Immigrants | Syria | 81.4 /100 | #144 | Excellent 56.2% |
| Syrians | 81.2 /100 | #145 | Excellent 56.2% |
| Venezuelans | 80.7 /100 | #146 | Excellent 56.1% |
| Serbians | 80.3 /100 | #147 | Excellent 56.1% |
| Immigrants | Moldova | 80.2 /100 | #148 | Excellent 56.1% |
Demographics Similar to Dutch by 2 or more Vehicles in Household
In terms of 2 or more vehicles in household, the demographic groups most similar to Dutch are Mexican (61.7%, a difference of 0.050%), German (61.6%, a difference of 0.11%), Samoan (61.5%, a difference of 0.23%), Czech (61.5%, a difference of 0.28%), and Swedish (61.8%, a difference of 0.33%).
| Demographics | Rating | Rank | 2 or more Vehicles in Household |
| Norwegians | 100.0 /100 | #4 | Exceptional 62.8% |
| Immigrants | Fiji | 100.0 /100 | #5 | Exceptional 62.3% |
| Scandinavians | 100.0 /100 | #6 | Exceptional 62.1% |
| Puget Sound Salish | 100.0 /100 | #7 | Exceptional 62.1% |
| English | 100.0 /100 | #8 | Exceptional 61.9% |
| Swedes | 100.0 /100 | #9 | Exceptional 61.8% |
| Mexicans | 100.0 /100 | #10 | Exceptional 61.7% |
| Dutch | 100.0 /100 | #11 | Exceptional 61.6% |
| Germans | 100.0 /100 | #12 | Exceptional 61.6% |
| Samoans | 100.0 /100 | #13 | Exceptional 61.5% |
| Czechs | 100.0 /100 | #14 | Exceptional 61.5% |
| Nepalese | 100.0 /100 | #15 | Exceptional 61.4% |
| Native Hawaiians | 100.0 /100 | #16 | Exceptional 61.4% |
| Basques | 100.0 /100 | #17 | Exceptional 61.4% |
| Europeans | 100.0 /100 | #18 | Exceptional 61.4% |