South African vs Immigrants from Eritrea No Vehicles in Household
COMPARE
South African
Immigrants from Eritrea
No Vehicles in Household
No Vehicles in Household Comparison
South Africans
Immigrants from Eritrea
10.2%
NO VEHICLES IN HOUSEHOLD
61.1/ 100
METRIC RATING
164th/ 347
METRIC RANK
10.6%
NO VEHICLES IN HOUSEHOLD
36.3/ 100
METRIC RATING
189th/ 347
METRIC RANK
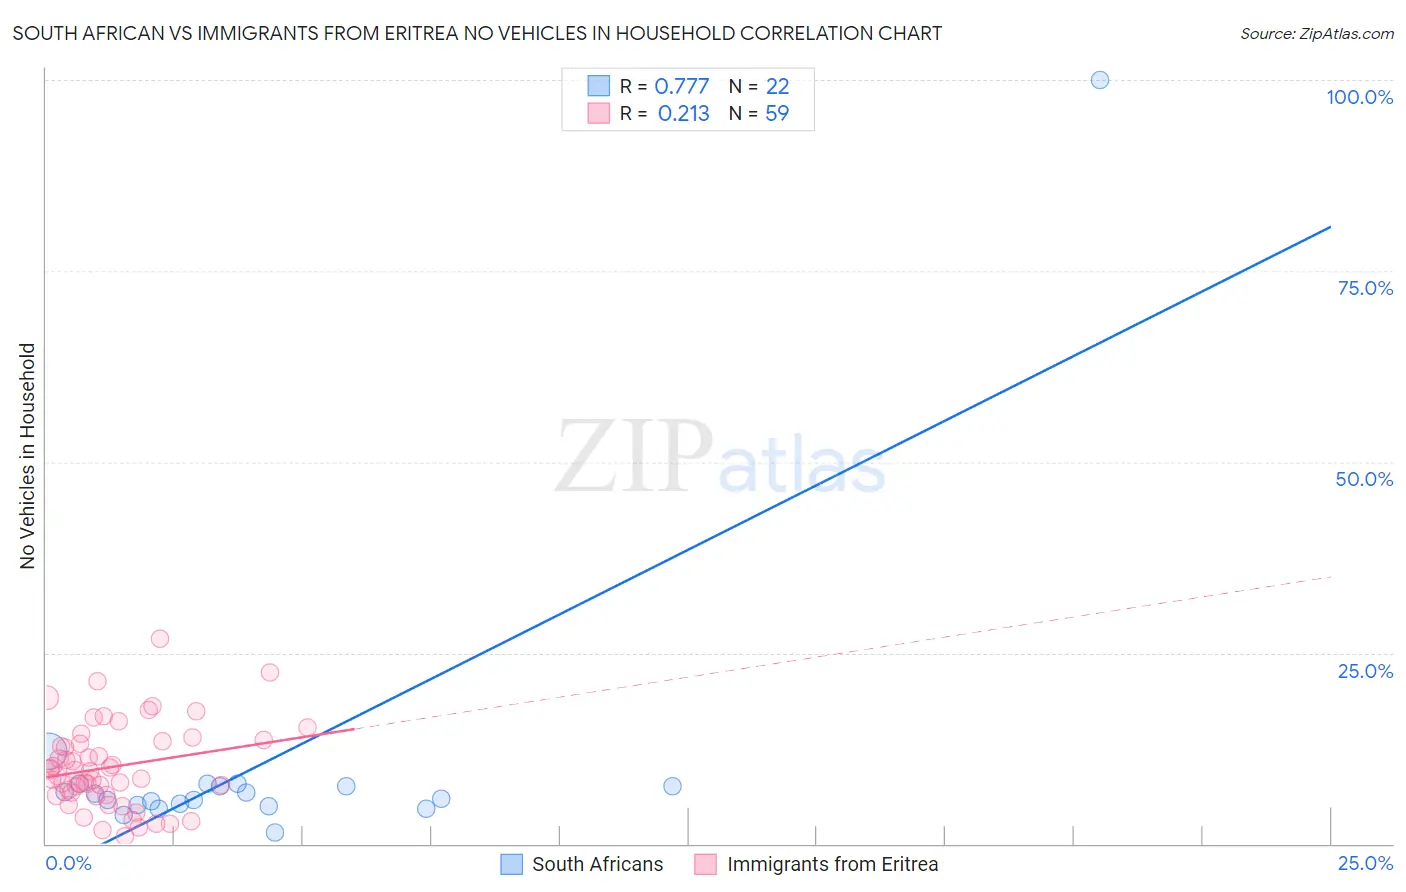
South African vs Immigrants from Eritrea No Vehicles in Household Correlation Chart
The statistical analysis conducted on geographies consisting of 182,340,903 people shows a strong positive correlation between the proportion of South Africans and percentage of households with no vehicle available in the United States with a correlation coefficient (R) of 0.777 and weighted average of 10.2%. Similarly, the statistical analysis conducted on geographies consisting of 104,832,678 people shows a weak positive correlation between the proportion of Immigrants from Eritrea and percentage of households with no vehicle available in the United States with a correlation coefficient (R) of 0.213 and weighted average of 10.6%, a difference of 3.5%.
No Vehicles in Household Correlation Summary
| Measurement | South African | Immigrants from Eritrea |
| Minimum | 1.5% | 0.94% |
| Maximum | 100.0% | 26.8% |
| Range | 98.5% | 25.8% |
| Mean | 10.5% | 10.1% |
| Median | 6.2% | 9.6% |
| Interquartile 25% (IQ1) | 5.1% | 6.4% |
| Interquartile 75% (IQ3) | 7.6% | 13.4% |
| Interquartile Range (IQR) | 2.5% | 7.1% |
| Standard Deviation (Sample) | 20.1% | 5.5% |
| Standard Deviation (Population) | 19.6% | 5.4% |
Similar Demographics by No Vehicles in Household
Demographics Similar to South Africans by No Vehicles in Household
In terms of no vehicles in household, the demographic groups most similar to South Africans are Comanche (10.2%, a difference of 0.040%), Immigrants from Costa Rica (10.3%, a difference of 0.10%), Immigrants from Saudi Arabia (10.3%, a difference of 0.34%), Immigrants from Cambodia (10.2%, a difference of 0.37%), and Immigrants from Austria (10.2%, a difference of 0.48%).
| Demographics | Rating | Rank | No Vehicles in Household |
| Australians | 70.6 /100 | #157 | Good 10.1% |
| Spanish American Indians | 70.2 /100 | #158 | Good 10.1% |
| Immigrants | Indonesia | 69.3 /100 | #159 | Good 10.1% |
| Immigrants | Middle Africa | 65.7 /100 | #160 | Good 10.2% |
| New Zealanders | 65.1 /100 | #161 | Good 10.2% |
| Immigrants | Austria | 64.4 /100 | #162 | Good 10.2% |
| Immigrants | Cambodia | 63.7 /100 | #163 | Good 10.2% |
| South Africans | 61.1 /100 | #164 | Good 10.2% |
| Comanche | 60.8 /100 | #165 | Good 10.2% |
| Immigrants | Costa Rica | 60.5 /100 | #166 | Good 10.3% |
| Immigrants | Saudi Arabia | 58.8 /100 | #167 | Average 10.3% |
| Indonesians | 56.7 /100 | #168 | Average 10.3% |
| Lumbee | 54.7 /100 | #169 | Average 10.3% |
| Immigrants | Latin America | 53.2 /100 | #170 | Average 10.4% |
| Hmong | 52.7 /100 | #171 | Average 10.4% |
Demographics Similar to Immigrants from Eritrea by No Vehicles in Household
In terms of no vehicles in household, the demographic groups most similar to Immigrants from Eritrea are Immigrants from Armenia (10.6%, a difference of 0.18%), Immigrants from North Macedonia (10.6%, a difference of 0.23%), Immigrants from Poland (10.6%, a difference of 0.30%), Immigrants from Northern Europe (10.7%, a difference of 0.47%), and Carpatho Rusyn (10.7%, a difference of 0.61%).
| Demographics | Rating | Rank | No Vehicles in Household |
| Immigrants | Bulgaria | 43.8 /100 | #182 | Average 10.5% |
| Natives/Alaskans | 43.7 /100 | #183 | Average 10.5% |
| Immigrants | Nepal | 42.4 /100 | #184 | Average 10.5% |
| South Americans | 41.9 /100 | #185 | Average 10.5% |
| German Russians | 40.6 /100 | #186 | Average 10.5% |
| Immigrants | Poland | 38.4 /100 | #187 | Fair 10.6% |
| Immigrants | Armenia | 37.5 /100 | #188 | Fair 10.6% |
| Immigrants | Eritrea | 36.3 /100 | #189 | Fair 10.6% |
| Immigrants | North Macedonia | 34.6 /100 | #190 | Fair 10.6% |
| Immigrants | Northern Europe | 33.1 /100 | #191 | Fair 10.7% |
| Carpatho Rusyns | 32.1 /100 | #192 | Fair 10.7% |
| Ukrainians | 28.0 /100 | #193 | Fair 10.7% |
| Pueblo | 27.0 /100 | #194 | Fair 10.8% |
| Immigrants | Brazil | 26.3 /100 | #195 | Fair 10.8% |
| Central Americans | 24.3 /100 | #196 | Fair 10.8% |