South African vs Israeli Unemployment Among Seniors over 75 years
COMPARE
South African
Israeli
Unemployment Among Seniors over 75 years
Unemployment Among Seniors over 75 years Comparison
South Africans
Israelis
7.5%
UNEMPLOYMENT AMONG SENIORS OVER 75 YEARS
100.0/ 100
METRIC RATING
26th/ 347
METRIC RANK
7.4%
UNEMPLOYMENT AMONG SENIORS OVER 75 YEARS
100.0/ 100
METRIC RATING
23rd/ 347
METRIC RANK
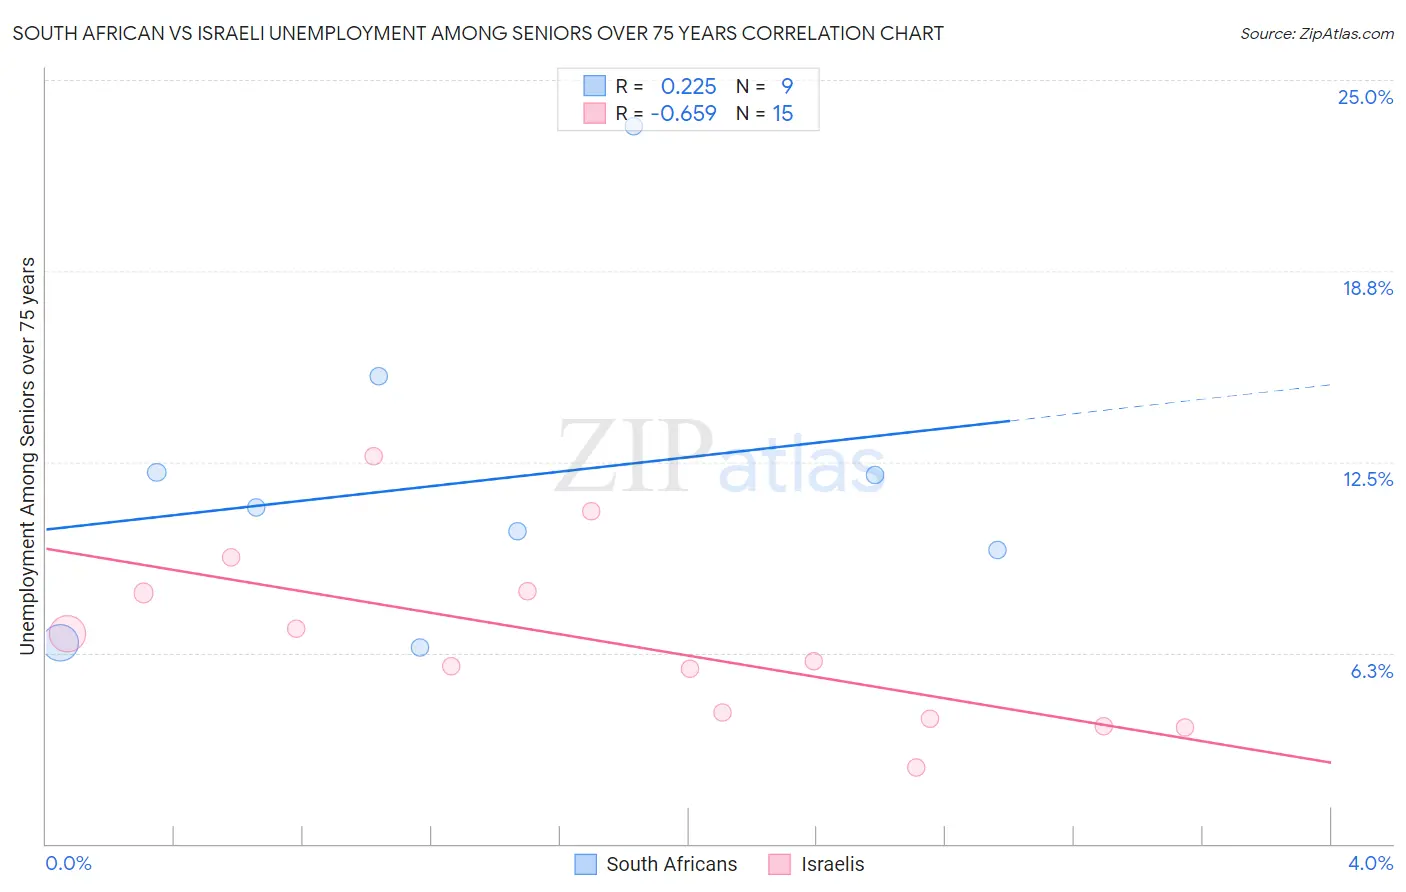
South African vs Israeli Unemployment Among Seniors over 75 years Correlation Chart
The statistical analysis conducted on geographies consisting of 121,244,008 people shows a weak positive correlation between the proportion of South Africans and unemployment rate among seniors over the age of 75 in the United States with a correlation coefficient (R) of 0.225 and weighted average of 7.5%. Similarly, the statistical analysis conducted on geographies consisting of 137,607,512 people shows a significant negative correlation between the proportion of Israelis and unemployment rate among seniors over the age of 75 in the United States with a correlation coefficient (R) of -0.659 and weighted average of 7.4%, a difference of 1.4%.
Unemployment Among Seniors over 75 years Correlation Summary
| Measurement | South African | Israeli |
| Minimum | 6.4% | 2.5% |
| Maximum | 23.5% | 12.7% |
| Range | 17.1% | 10.2% |
| Mean | 11.9% | 6.6% |
| Median | 11.0% | 6.0% |
| Interquartile 25% (IQ1) | 8.1% | 4.1% |
| Interquartile 75% (IQ3) | 13.7% | 8.3% |
| Interquartile Range (IQR) | 5.7% | 4.2% |
| Standard Deviation (Sample) | 5.2% | 2.9% |
| Standard Deviation (Population) | 4.9% | 2.8% |
Demographics Similar to South Africans and Israelis by Unemployment Among Seniors over 75 years
In terms of unemployment among seniors over 75 years, the demographic groups most similar to South Africans are Immigrants from Uruguay (7.5%, a difference of 0.18%), Immigrants from Barbados (7.6%, a difference of 0.44%), Immigrants from Israel (7.6%, a difference of 0.55%), Immigrants from Iran (7.6%, a difference of 0.59%), and Immigrants from Sweden (7.6%, a difference of 0.70%). Similarly, the demographic groups most similar to Israelis are Immigrants from Cuba (7.4%, a difference of 0.080%), Cypriot (7.4%, a difference of 0.33%), Chickasaw (7.3%, a difference of 1.1%), Immigrants from Uruguay (7.5%, a difference of 1.2%), and Immigrants from Barbados (7.6%, a difference of 1.8%).
| Demographics | Rating | Rank | Unemployment Among Seniors over 75 years |
| Ute | 100.0 /100 | #14 | Exceptional 6.8% |
| Icelanders | 100.0 /100 | #15 | Exceptional 7.0% |
| Seminole | 100.0 /100 | #16 | Exceptional 7.1% |
| Immigrants | Switzerland | 100.0 /100 | #17 | Exceptional 7.2% |
| Immigrants | Uzbekistan | 100.0 /100 | #18 | Exceptional 7.2% |
| Immigrants | Zaire | 100.0 /100 | #19 | Exceptional 7.2% |
| Armenians | 100.0 /100 | #20 | Exceptional 7.2% |
| Chickasaw | 100.0 /100 | #21 | Exceptional 7.3% |
| Cypriots | 100.0 /100 | #22 | Exceptional 7.4% |
| Israelis | 100.0 /100 | #23 | Exceptional 7.4% |
| Immigrants | Cuba | 100.0 /100 | #24 | Exceptional 7.4% |
| Immigrants | Uruguay | 100.0 /100 | #25 | Exceptional 7.5% |
| South Africans | 100.0 /100 | #26 | Exceptional 7.5% |
| Immigrants | Barbados | 100.0 /100 | #27 | Exceptional 7.6% |
| Immigrants | Israel | 100.0 /100 | #28 | Exceptional 7.6% |
| Immigrants | Iran | 100.0 /100 | #29 | Exceptional 7.6% |
| Immigrants | Sweden | 100.0 /100 | #30 | Exceptional 7.6% |
| Guyanese | 100.0 /100 | #31 | Exceptional 7.6% |
| Immigrants | Hong Kong | 100.0 /100 | #32 | Exceptional 7.6% |
| Cambodians | 100.0 /100 | #33 | Exceptional 7.6% |
| Immigrants | Eritrea | 100.0 /100 | #34 | Exceptional 7.7% |