South African vs Immigrants from Ghana No Vehicles in Household
COMPARE
South African
Immigrants from Ghana
No Vehicles in Household
No Vehicles in Household Comparison
South Africans
Immigrants from Ghana
10.2%
NO VEHICLES IN HOUSEHOLD
61.1/ 100
METRIC RATING
164th/ 347
METRIC RANK
16.6%
NO VEHICLES IN HOUSEHOLD
0.0/ 100
METRIC RATING
317th/ 347
METRIC RANK
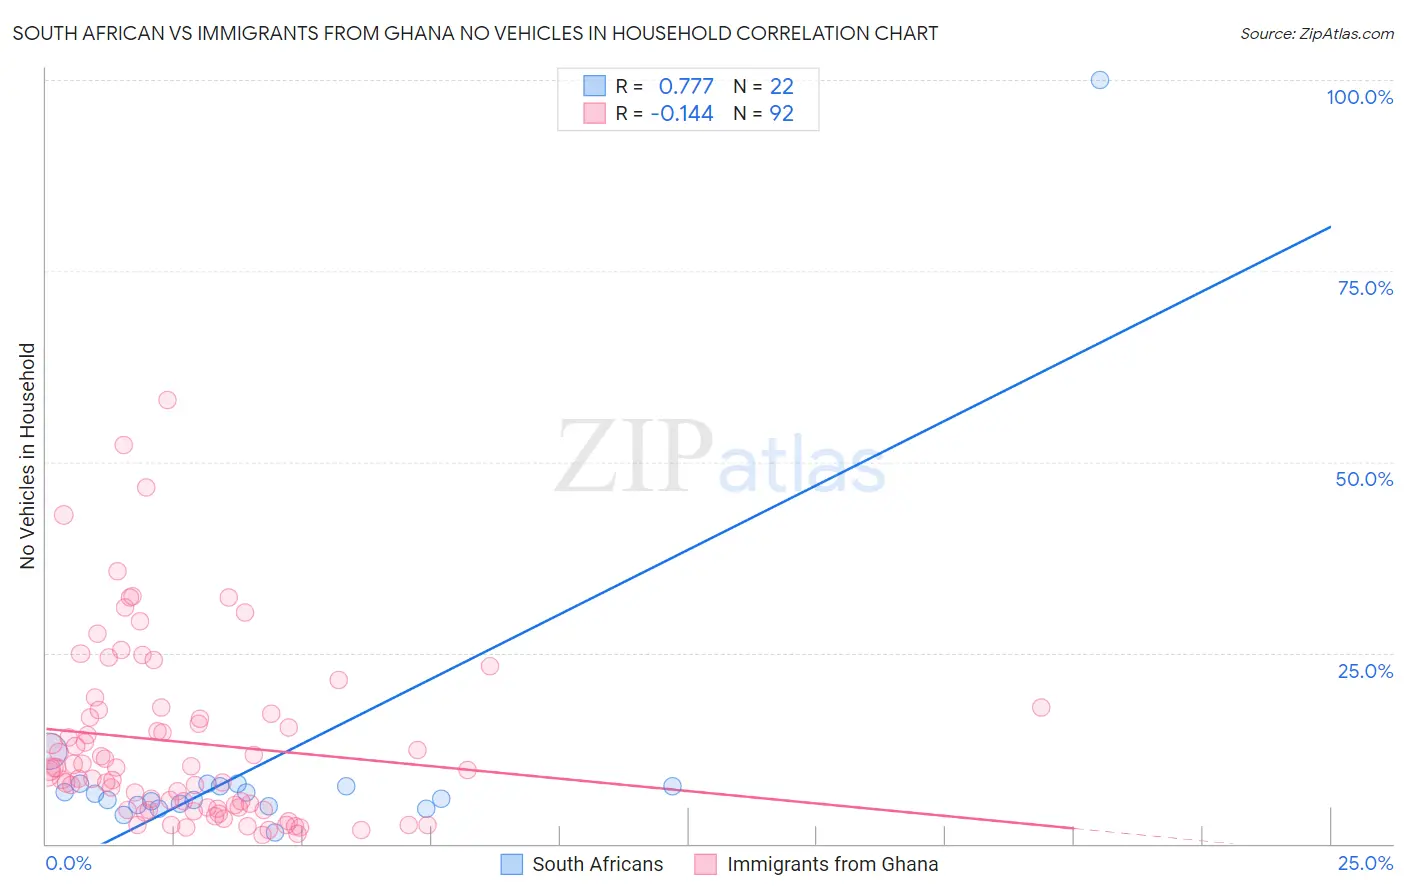
South African vs Immigrants from Ghana No Vehicles in Household Correlation Chart
The statistical analysis conducted on geographies consisting of 182,340,903 people shows a strong positive correlation between the proportion of South Africans and percentage of households with no vehicle available in the United States with a correlation coefficient (R) of 0.777 and weighted average of 10.2%. Similarly, the statistical analysis conducted on geographies consisting of 199,471,025 people shows a poor negative correlation between the proportion of Immigrants from Ghana and percentage of households with no vehicle available in the United States with a correlation coefficient (R) of -0.144 and weighted average of 16.6%, a difference of 62.0%.
No Vehicles in Household Correlation Summary
| Measurement | South African | Immigrants from Ghana |
| Minimum | 1.5% | 1.2% |
| Maximum | 100.0% | 58.0% |
| Range | 98.5% | 56.8% |
| Mean | 10.5% | 13.3% |
| Median | 6.2% | 9.8% |
| Interquartile 25% (IQ1) | 5.1% | 4.6% |
| Interquartile 75% (IQ3) | 7.6% | 17.3% |
| Interquartile Range (IQR) | 2.5% | 12.7% |
| Standard Deviation (Sample) | 20.1% | 11.8% |
| Standard Deviation (Population) | 19.6% | 11.7% |
Similar Demographics by No Vehicles in Household
Demographics Similar to South Africans by No Vehicles in Household
In terms of no vehicles in household, the demographic groups most similar to South Africans are Comanche (10.2%, a difference of 0.040%), Immigrants from Costa Rica (10.3%, a difference of 0.10%), Immigrants from Saudi Arabia (10.3%, a difference of 0.34%), Immigrants from Cambodia (10.2%, a difference of 0.37%), and Immigrants from Austria (10.2%, a difference of 0.48%).
| Demographics | Rating | Rank | No Vehicles in Household |
| Australians | 70.6 /100 | #157 | Good 10.1% |
| Spanish American Indians | 70.2 /100 | #158 | Good 10.1% |
| Immigrants | Indonesia | 69.3 /100 | #159 | Good 10.1% |
| Immigrants | Middle Africa | 65.7 /100 | #160 | Good 10.2% |
| New Zealanders | 65.1 /100 | #161 | Good 10.2% |
| Immigrants | Austria | 64.4 /100 | #162 | Good 10.2% |
| Immigrants | Cambodia | 63.7 /100 | #163 | Good 10.2% |
| South Africans | 61.1 /100 | #164 | Good 10.2% |
| Comanche | 60.8 /100 | #165 | Good 10.2% |
| Immigrants | Costa Rica | 60.5 /100 | #166 | Good 10.3% |
| Immigrants | Saudi Arabia | 58.8 /100 | #167 | Average 10.3% |
| Indonesians | 56.7 /100 | #168 | Average 10.3% |
| Lumbee | 54.7 /100 | #169 | Average 10.3% |
| Immigrants | Latin America | 53.2 /100 | #170 | Average 10.4% |
| Hmong | 52.7 /100 | #171 | Average 10.4% |
Demographics Similar to Immigrants from Ghana by No Vehicles in Household
In terms of no vehicles in household, the demographic groups most similar to Immigrants from Ghana are Immigrants from Belarus (16.7%, a difference of 0.86%), Ghanaian (16.4%, a difference of 0.95%), Alaska Native (17.4%, a difference of 4.8%), Soviet Union (17.4%, a difference of 5.0%), and Cypriot (15.7%, a difference of 6.0%).
| Demographics | Rating | Rank | No Vehicles in Household |
| Cape Verdeans | 0.0 /100 | #310 | Tragic 15.6% |
| Immigrants | Israel | 0.0 /100 | #311 | Tragic 15.6% |
| Alaskan Athabascans | 0.0 /100 | #312 | Tragic 15.6% |
| Tohono O'odham | 0.0 /100 | #313 | Tragic 15.6% |
| Albanians | 0.0 /100 | #314 | Tragic 15.6% |
| Cypriots | 0.0 /100 | #315 | Tragic 15.7% |
| Ghanaians | 0.0 /100 | #316 | Tragic 16.4% |
| Immigrants | Ghana | 0.0 /100 | #317 | Tragic 16.6% |
| Immigrants | Belarus | 0.0 /100 | #318 | Tragic 16.7% |
| Alaska Natives | 0.0 /100 | #319 | Tragic 17.4% |
| Soviet Union | 0.0 /100 | #320 | Tragic 17.4% |
| Jamaicans | 0.0 /100 | #321 | Tragic 17.9% |
| Immigrants | Cabo Verde | 0.0 /100 | #322 | Tragic 18.4% |
| Immigrants | Yemen | 0.0 /100 | #323 | Tragic 19.5% |
| Immigrants | Caribbean | 0.0 /100 | #324 | Tragic 19.6% |