French Canadian vs Immigrants from Hong Kong 2 or more Vehicles in Household
COMPARE
French Canadian
Immigrants from Hong Kong
2 or more Vehicles in Household
2 or more Vehicles in Household Comparison
French Canadians
Immigrants from Hong Kong
58.9%
2 OR MORE VEHICLES IN HOUSEHOLD
99.8/ 100
METRIC RATING
60th/ 347
METRIC RANK
52.6%
2 OR MORE VEHICLES IN HOUSEHOLD
0.6/ 100
METRIC RATING
257th/ 347
METRIC RANK
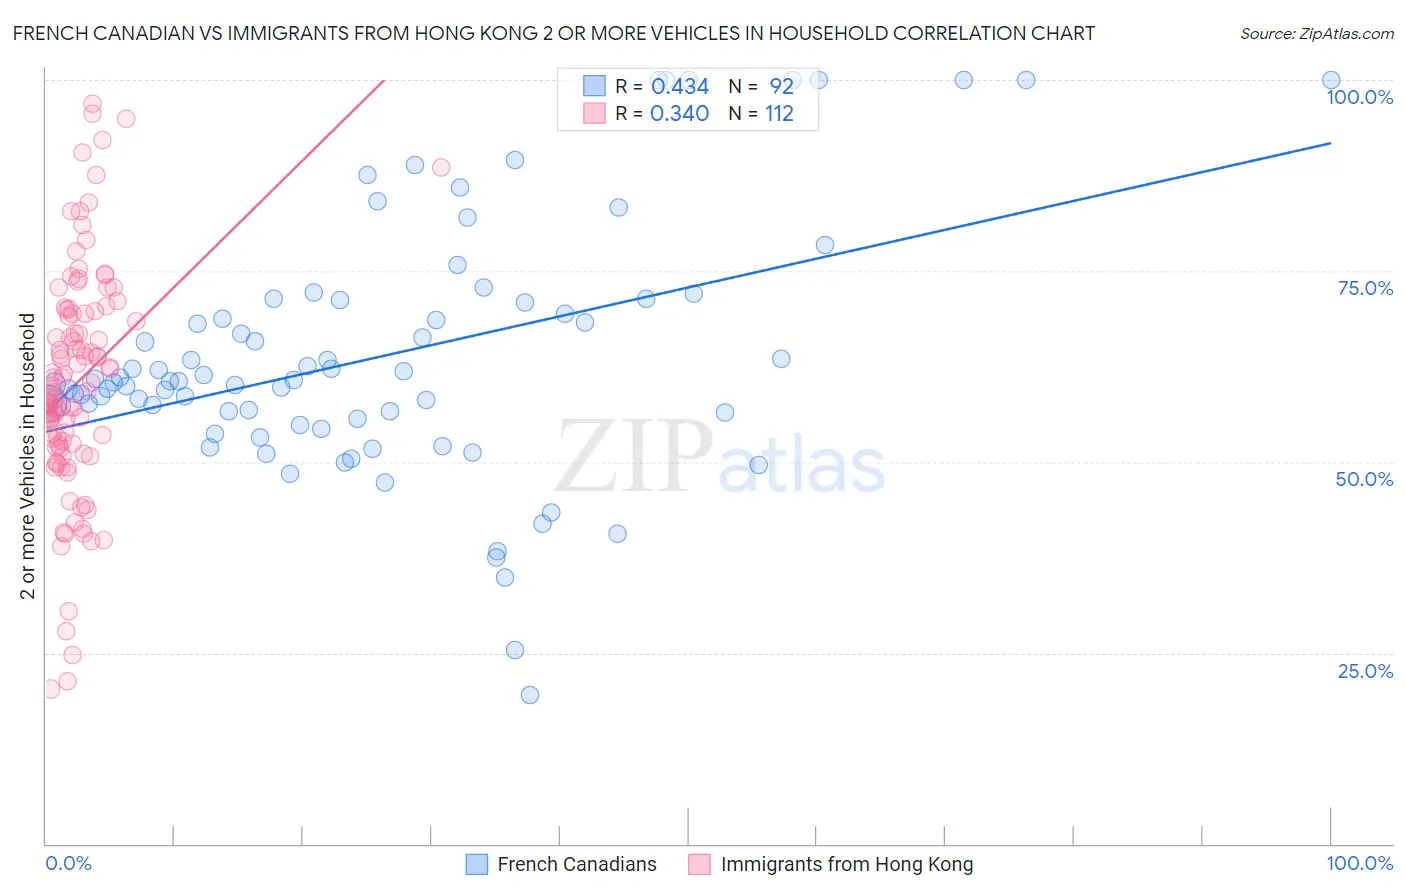
French Canadian vs Immigrants from Hong Kong 2 or more Vehicles in Household Correlation Chart
The statistical analysis conducted on geographies consisting of 502,331,363 people shows a moderate positive correlation between the proportion of French Canadians and percentage of households with 2 or more vehicles available in the United States with a correlation coefficient (R) of 0.434 and weighted average of 58.9%. Similarly, the statistical analysis conducted on geographies consisting of 253,902,062 people shows a mild positive correlation between the proportion of Immigrants from Hong Kong and percentage of households with 2 or more vehicles available in the United States with a correlation coefficient (R) of 0.340 and weighted average of 52.6%, a difference of 12.0%.
2 or more Vehicles in Household Correlation Summary
| Measurement | French Canadian | Immigrants from Hong Kong |
| Minimum | 19.5% | 20.2% |
| Maximum | 100.0% | 96.9% |
| Range | 80.5% | 76.6% |
| Mean | 63.9% | 60.4% |
| Median | 60.5% | 59.5% |
| Interquartile 25% (IQ1) | 56.1% | 52.0% |
| Interquartile 75% (IQ3) | 71.1% | 69.6% |
| Interquartile Range (IQR) | 15.0% | 17.6% |
| Standard Deviation (Sample) | 16.6% | 15.1% |
| Standard Deviation (Population) | 16.5% | 15.0% |
Similar Demographics by 2 or more Vehicles in Household
Demographics Similar to French Canadians by 2 or more Vehicles in Household
In terms of 2 or more vehicles in household, the demographic groups most similar to French Canadians are Spanish American (58.9%, a difference of 0.030%), Immigrants from Scotland (58.9%, a difference of 0.050%), Osage (58.8%, a difference of 0.13%), Nonimmigrants (58.8%, a difference of 0.17%), and Afghan (59.0%, a difference of 0.23%).
| Demographics | Rating | Rank | 2 or more Vehicles in Household |
| Celtics | 99.9 /100 | #53 | Exceptional 59.2% |
| Bhutanese | 99.9 /100 | #54 | Exceptional 59.1% |
| Luxembourgers | 99.9 /100 | #55 | Exceptional 59.1% |
| Chickasaw | 99.9 /100 | #56 | Exceptional 59.0% |
| Afghans | 99.9 /100 | #57 | Exceptional 59.0% |
| Immigrants | Scotland | 99.8 /100 | #58 | Exceptional 58.9% |
| Spanish Americans | 99.8 /100 | #59 | Exceptional 58.9% |
| French Canadians | 99.8 /100 | #60 | Exceptional 58.9% |
| Osage | 99.8 /100 | #61 | Exceptional 58.8% |
| Immigrants | Nonimmigrants | 99.8 /100 | #62 | Exceptional 58.8% |
| Mexican American Indians | 99.8 /100 | #63 | Exceptional 58.7% |
| Portuguese | 99.7 /100 | #64 | Exceptional 58.6% |
| Immigrants | Central America | 99.7 /100 | #65 | Exceptional 58.6% |
| Croatians | 99.7 /100 | #66 | Exceptional 58.6% |
| Laotians | 99.7 /100 | #67 | Exceptional 58.6% |
Demographics Similar to Immigrants from Hong Kong by 2 or more Vehicles in Household
In terms of 2 or more vehicles in household, the demographic groups most similar to Immigrants from Hong Kong are Central American Indian (52.5%, a difference of 0.10%), Immigrants from Eritrea (52.6%, a difference of 0.14%), Alsatian (52.5%, a difference of 0.14%), Uruguayan (52.7%, a difference of 0.18%), and Immigrants from Bahamas (52.5%, a difference of 0.20%).
| Demographics | Rating | Rank | 2 or more Vehicles in Household |
| Mongolians | 1.0 /100 | #250 | Tragic 52.8% |
| Immigrants | Sudan | 1.0 /100 | #251 | Tragic 52.8% |
| Immigrants | Portugal | 1.0 /100 | #252 | Tragic 52.8% |
| Nigerians | 0.9 /100 | #253 | Tragic 52.8% |
| Immigrants | Malaysia | 0.8 /100 | #254 | Tragic 52.7% |
| Uruguayans | 0.7 /100 | #255 | Tragic 52.7% |
| Immigrants | Eritrea | 0.7 /100 | #256 | Tragic 52.6% |
| Immigrants | Hong Kong | 0.6 /100 | #257 | Tragic 52.6% |
| Central American Indians | 0.6 /100 | #258 | Tragic 52.5% |
| Alsatians | 0.6 /100 | #259 | Tragic 52.5% |
| Immigrants | Bahamas | 0.5 /100 | #260 | Tragic 52.5% |
| Immigrants | Australia | 0.5 /100 | #261 | Tragic 52.4% |
| Immigrants | Northern Africa | 0.4 /100 | #262 | Tragic 52.3% |
| Immigrants | Southern Europe | 0.4 /100 | #263 | Tragic 52.3% |
| Immigrants | Latvia | 0.4 /100 | #264 | Tragic 52.2% |