Sioux vs Kiowa No Vehicles in Household
COMPARE
Sioux
Kiowa
No Vehicles in Household
No Vehicles in Household Comparison
Sioux
Kiowa
10.1%
NO VEHICLES IN HOUSEHOLD
72.4/ 100
METRIC RATING
154th/ 347
METRIC RANK
11.5%
NO VEHICLES IN HOUSEHOLD
4.0/ 100
METRIC RATING
235th/ 347
METRIC RANK
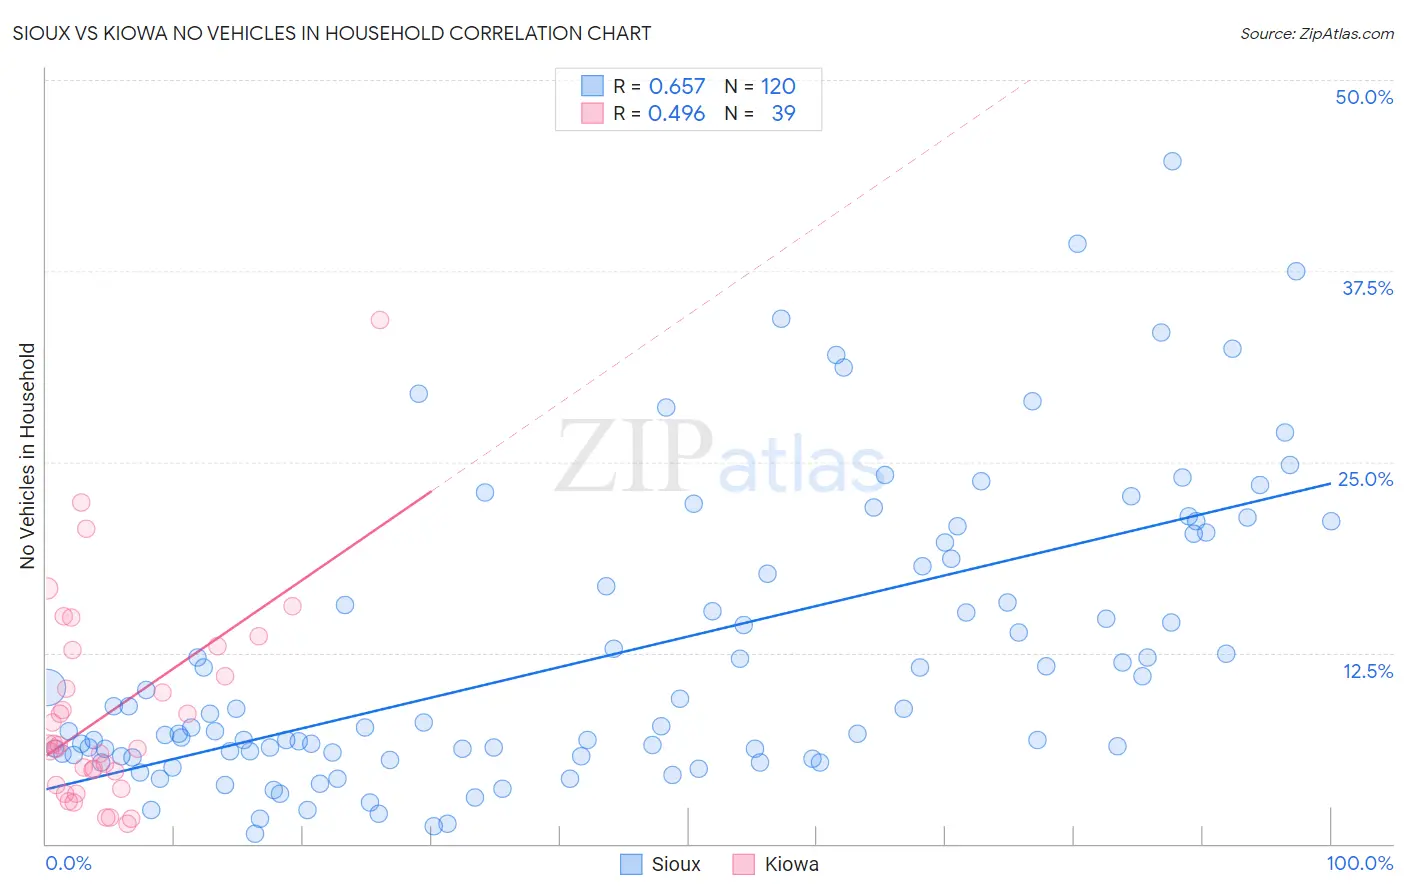
Sioux vs Kiowa No Vehicles in Household Correlation Chart
The statistical analysis conducted on geographies consisting of 233,693,165 people shows a significant positive correlation between the proportion of Sioux and percentage of households with no vehicle available in the United States with a correlation coefficient (R) of 0.657 and weighted average of 10.1%. Similarly, the statistical analysis conducted on geographies consisting of 56,075,715 people shows a moderate positive correlation between the proportion of Kiowa and percentage of households with no vehicle available in the United States with a correlation coefficient (R) of 0.496 and weighted average of 11.5%, a difference of 14.5%.
No Vehicles in Household Correlation Summary
| Measurement | Sioux | Kiowa |
| Minimum | 0.66% | 1.3% |
| Maximum | 44.7% | 34.3% |
| Range | 44.0% | 33.0% |
| Mean | 12.4% | 8.7% |
| Median | 7.8% | 6.4% |
| Interquartile 25% (IQ1) | 5.8% | 3.8% |
| Interquartile 75% (IQ3) | 18.4% | 12.7% |
| Interquartile Range (IQR) | 12.5% | 8.8% |
| Standard Deviation (Sample) | 9.5% | 6.7% |
| Standard Deviation (Population) | 9.4% | 6.7% |
Similar Demographics by No Vehicles in Household
Demographics Similar to Sioux by No Vehicles in Household
In terms of no vehicles in household, the demographic groups most similar to Sioux are Salvadoran (10.1%, a difference of 0.010%), Tlingit-Haida (10.1%, a difference of 0.020%), Immigrants from Congo (10.1%, a difference of 0.11%), Immigrants from Eastern Africa (10.0%, a difference of 0.25%), and Colombian (10.0%, a difference of 0.26%).
| Demographics | Rating | Rank | No Vehicles in Household |
| Immigrants | Nicaragua | 79.8 /100 | #147 | Good 9.9% |
| Immigrants | Bosnia and Herzegovina | 79.1 /100 | #148 | Good 9.9% |
| Immigrants | Uganda | 76.1 /100 | #149 | Good 10.0% |
| Colombians | 73.9 /100 | #150 | Good 10.0% |
| Immigrants | Eastern Africa | 73.8 /100 | #151 | Good 10.0% |
| Immigrants | Congo | 73.0 /100 | #152 | Good 10.1% |
| Tlingit-Haida | 72.5 /100 | #153 | Good 10.1% |
| Sioux | 72.4 /100 | #154 | Good 10.1% |
| Salvadorans | 72.4 /100 | #155 | Good 10.1% |
| Immigrants | Micronesia | 70.9 /100 | #156 | Good 10.1% |
| Australians | 70.6 /100 | #157 | Good 10.1% |
| Spanish American Indians | 70.2 /100 | #158 | Good 10.1% |
| Immigrants | Indonesia | 69.3 /100 | #159 | Good 10.1% |
| Immigrants | Middle Africa | 65.7 /100 | #160 | Good 10.2% |
| New Zealanders | 65.1 /100 | #161 | Good 10.2% |
Demographics Similar to Kiowa by No Vehicles in Household
In terms of no vehicles in household, the demographic groups most similar to Kiowa are Cree (11.6%, a difference of 0.35%), Immigrants from Peru (11.5%, a difference of 0.38%), Houma (11.5%, a difference of 0.57%), Ute (11.6%, a difference of 0.59%), and Immigrants from Turkey (11.5%, a difference of 0.61%).
| Demographics | Rating | Rank | No Vehicles in Household |
| Immigrants | Romania | 5.3 /100 | #228 | Tragic 11.4% |
| Ugandans | 5.3 /100 | #229 | Tragic 11.4% |
| Immigrants | Norway | 5.1 /100 | #230 | Tragic 11.4% |
| Immigrants | Japan | 5.1 /100 | #231 | Tragic 11.4% |
| Immigrants | Turkey | 4.8 /100 | #232 | Tragic 11.5% |
| Houma | 4.7 /100 | #233 | Tragic 11.5% |
| Immigrants | Peru | 4.5 /100 | #234 | Tragic 11.5% |
| Kiowa | 4.0 /100 | #235 | Tragic 11.5% |
| Cree | 3.5 /100 | #236 | Tragic 11.6% |
| Ute | 3.3 /100 | #237 | Tragic 11.6% |
| Russians | 3.2 /100 | #238 | Tragic 11.6% |
| Taiwanese | 2.8 /100 | #239 | Tragic 11.7% |
| Immigrants | Immigrants | 2.7 /100 | #240 | Tragic 11.7% |
| Eastern Europeans | 2.7 /100 | #241 | Tragic 11.7% |
| Turks | 2.6 /100 | #242 | Tragic 11.7% |