Sioux vs Macedonian No Vehicles in Household
COMPARE
Sioux
Macedonian
No Vehicles in Household
No Vehicles in Household Comparison
Sioux
Macedonians
10.1%
NO VEHICLES IN HOUSEHOLD
72.4/ 100
METRIC RATING
154th/ 347
METRIC RANK
12.2%
NO VEHICLES IN HOUSEHOLD
0.7/ 100
METRIC RATING
260th/ 347
METRIC RANK
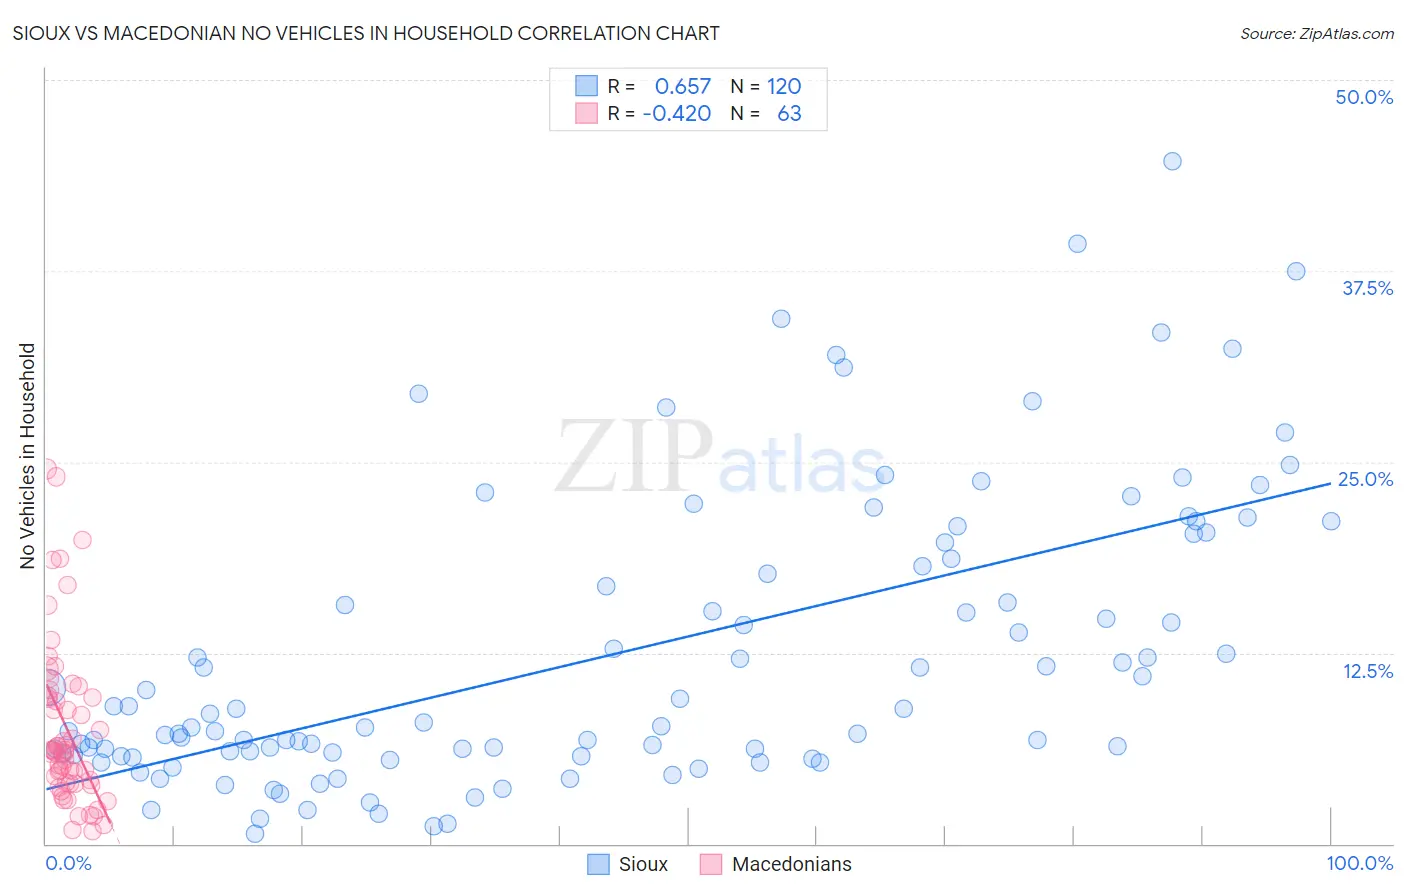
Sioux vs Macedonian No Vehicles in Household Correlation Chart
The statistical analysis conducted on geographies consisting of 233,693,165 people shows a significant positive correlation between the proportion of Sioux and percentage of households with no vehicle available in the United States with a correlation coefficient (R) of 0.657 and weighted average of 10.1%. Similarly, the statistical analysis conducted on geographies consisting of 132,434,178 people shows a moderate negative correlation between the proportion of Macedonians and percentage of households with no vehicle available in the United States with a correlation coefficient (R) of -0.420 and weighted average of 12.2%, a difference of 20.8%.
No Vehicles in Household Correlation Summary
| Measurement | Sioux | Macedonian |
| Minimum | 0.66% | 0.82% |
| Maximum | 44.7% | 24.5% |
| Range | 44.0% | 23.7% |
| Mean | 12.4% | 7.5% |
| Median | 7.8% | 6.0% |
| Interquartile 25% (IQ1) | 5.8% | 3.9% |
| Interquartile 75% (IQ3) | 18.4% | 9.7% |
| Interquartile Range (IQR) | 12.5% | 5.8% |
| Standard Deviation (Sample) | 9.5% | 5.3% |
| Standard Deviation (Population) | 9.4% | 5.3% |
Similar Demographics by No Vehicles in Household
Demographics Similar to Sioux by No Vehicles in Household
In terms of no vehicles in household, the demographic groups most similar to Sioux are Salvadoran (10.1%, a difference of 0.010%), Tlingit-Haida (10.1%, a difference of 0.020%), Immigrants from Congo (10.1%, a difference of 0.11%), Immigrants from Eastern Africa (10.0%, a difference of 0.25%), and Colombian (10.0%, a difference of 0.26%).
| Demographics | Rating | Rank | No Vehicles in Household |
| Immigrants | Nicaragua | 79.8 /100 | #147 | Good 9.9% |
| Immigrants | Bosnia and Herzegovina | 79.1 /100 | #148 | Good 9.9% |
| Immigrants | Uganda | 76.1 /100 | #149 | Good 10.0% |
| Colombians | 73.9 /100 | #150 | Good 10.0% |
| Immigrants | Eastern Africa | 73.8 /100 | #151 | Good 10.0% |
| Immigrants | Congo | 73.0 /100 | #152 | Good 10.1% |
| Tlingit-Haida | 72.5 /100 | #153 | Good 10.1% |
| Sioux | 72.4 /100 | #154 | Good 10.1% |
| Salvadorans | 72.4 /100 | #155 | Good 10.1% |
| Immigrants | Micronesia | 70.9 /100 | #156 | Good 10.1% |
| Australians | 70.6 /100 | #157 | Good 10.1% |
| Spanish American Indians | 70.2 /100 | #158 | Good 10.1% |
| Immigrants | Indonesia | 69.3 /100 | #159 | Good 10.1% |
| Immigrants | Middle Africa | 65.7 /100 | #160 | Good 10.2% |
| New Zealanders | 65.1 /100 | #161 | Good 10.2% |
Demographics Similar to Macedonians by No Vehicles in Household
In terms of no vehicles in household, the demographic groups most similar to Macedonians are Subsaharan African (12.2%, a difference of 0.39%), Immigrants from Liberia (12.2%, a difference of 0.46%), Immigrants from Latvia (12.1%, a difference of 0.55%), Immigrants from Egypt (12.2%, a difference of 0.61%), and South American Indian (12.1%, a difference of 0.80%).
| Demographics | Rating | Rank | No Vehicles in Household |
| Egyptians | 1.4 /100 | #253 | Tragic 11.9% |
| Immigrants | Uruguay | 1.3 /100 | #254 | Tragic 11.9% |
| Hondurans | 1.2 /100 | #255 | Tragic 12.0% |
| Liberians | 1.2 /100 | #256 | Tragic 12.0% |
| Nigerians | 0.9 /100 | #257 | Tragic 12.1% |
| South American Indians | 0.9 /100 | #258 | Tragic 12.1% |
| Immigrants | Latvia | 0.8 /100 | #259 | Tragic 12.1% |
| Macedonians | 0.7 /100 | #260 | Tragic 12.2% |
| Sub-Saharan Africans | 0.6 /100 | #261 | Tragic 12.2% |
| Immigrants | Liberia | 0.6 /100 | #262 | Tragic 12.2% |
| Immigrants | Egypt | 0.6 /100 | #263 | Tragic 12.2% |
| Immigrants | Switzerland | 0.5 /100 | #264 | Tragic 12.3% |
| Africans | 0.4 /100 | #265 | Tragic 12.3% |
| Israelis | 0.3 /100 | #266 | Tragic 12.4% |
| Immigrants | Europe | 0.3 /100 | #267 | Tragic 12.5% |