Sierra Leonean vs Palestinian 2 or more Vehicles in Household
COMPARE
Sierra Leonean
Palestinian
2 or more Vehicles in Household
2 or more Vehicles in Household Comparison
Sierra Leoneans
Palestinians
52.9%
2 OR MORE VEHICLES IN HOUSEHOLD
1.2/ 100
METRIC RATING
247th/ 347
METRIC RANK
57.7%
2 OR MORE VEHICLES IN HOUSEHOLD
98.6/ 100
METRIC RATING
98th/ 347
METRIC RANK
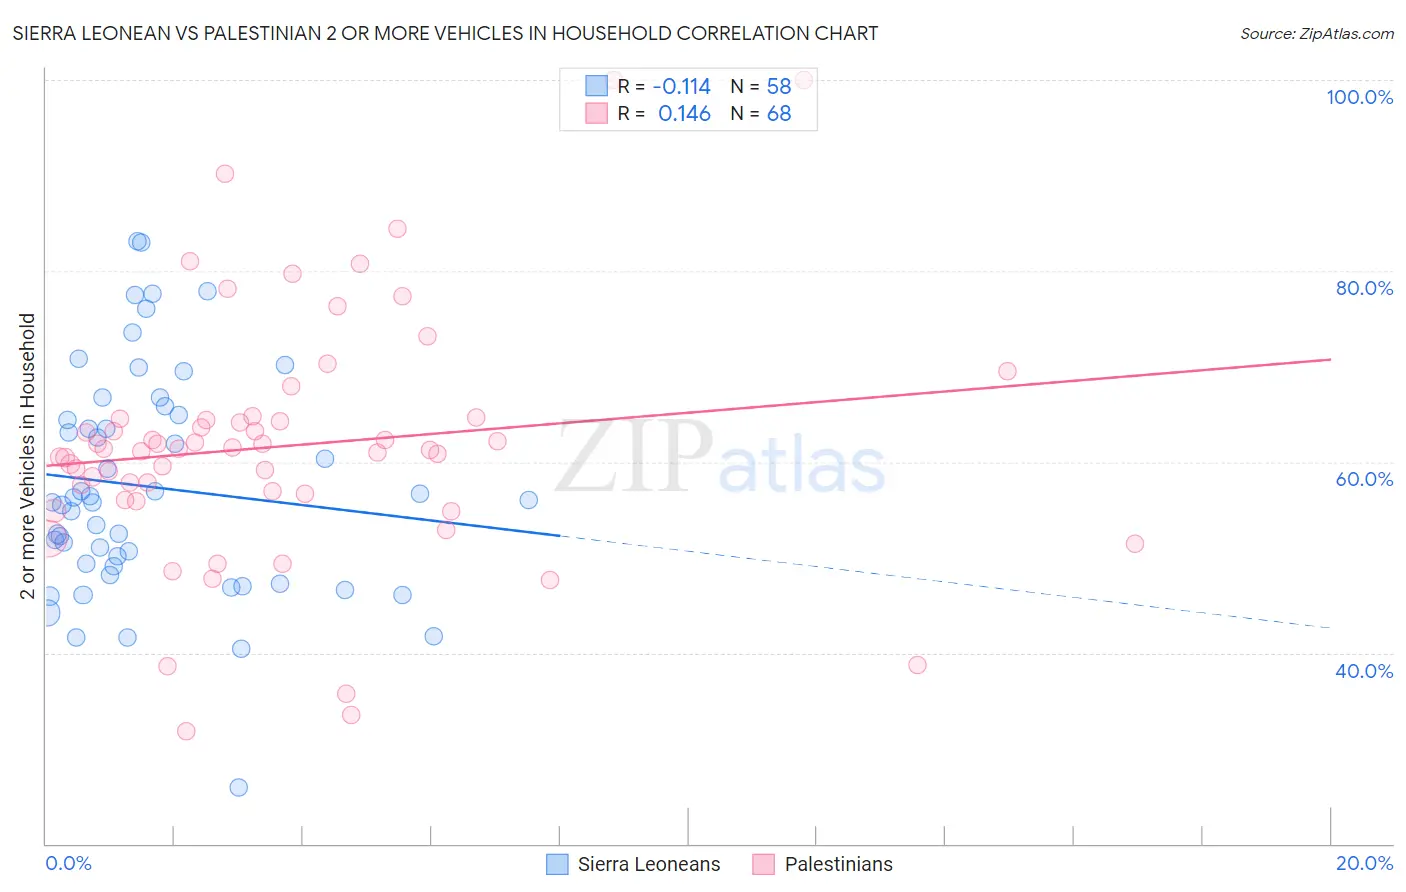
Sierra Leonean vs Palestinian 2 or more Vehicles in Household Correlation Chart
The statistical analysis conducted on geographies consisting of 83,352,562 people shows a poor negative correlation between the proportion of Sierra Leoneans and percentage of households with 2 or more vehicles available in the United States with a correlation coefficient (R) of -0.114 and weighted average of 52.9%. Similarly, the statistical analysis conducted on geographies consisting of 216,408,770 people shows a poor positive correlation between the proportion of Palestinians and percentage of households with 2 or more vehicles available in the United States with a correlation coefficient (R) of 0.146 and weighted average of 57.7%, a difference of 9.0%.
2 or more Vehicles in Household Correlation Summary
| Measurement | Sierra Leonean | Palestinian |
| Minimum | 25.9% | 31.8% |
| Maximum | 83.1% | 100.0% |
| Range | 57.3% | 68.2% |
| Mean | 57.3% | 61.7% |
| Median | 55.9% | 61.4% |
| Interquartile 25% (IQ1) | 49.0% | 56.3% |
| Interquartile 75% (IQ3) | 64.9% | 64.5% |
| Interquartile Range (IQR) | 15.8% | 8.1% |
| Standard Deviation (Sample) | 11.8% | 13.0% |
| Standard Deviation (Population) | 11.7% | 12.9% |
Similar Demographics by 2 or more Vehicles in Household
Demographics Similar to Sierra Leoneans by 2 or more Vehicles in Household
In terms of 2 or more vehicles in household, the demographic groups most similar to Sierra Leoneans are Immigrants from Nigeria (52.9%, a difference of 0.030%), Colombian (52.9%, a difference of 0.12%), Immigrants from Brazil (52.8%, a difference of 0.18%), Mongolian (52.8%, a difference of 0.18%), and Immigrants from Sudan (52.8%, a difference of 0.21%).
| Demographics | Rating | Rank | 2 or more Vehicles in Household |
| Immigrants | Europe | 2.1 /100 | #240 | Tragic 53.2% |
| Immigrants | Sierra Leone | 2.1 /100 | #241 | Tragic 53.2% |
| Immigrants | Eastern Asia | 2.1 /100 | #242 | Tragic 53.2% |
| Ethiopians | 1.7 /100 | #243 | Tragic 53.1% |
| Indians (Asian) | 1.7 /100 | #244 | Tragic 53.1% |
| Immigrants | Ethiopia | 1.5 /100 | #245 | Tragic 53.0% |
| Immigrants | Nigeria | 1.2 /100 | #246 | Tragic 52.9% |
| Sierra Leoneans | 1.2 /100 | #247 | Tragic 52.9% |
| Colombians | 1.1 /100 | #248 | Tragic 52.9% |
| Immigrants | Brazil | 1.0 /100 | #249 | Tragic 52.8% |
| Mongolians | 1.0 /100 | #250 | Tragic 52.8% |
| Immigrants | Sudan | 1.0 /100 | #251 | Tragic 52.8% |
| Immigrants | Portugal | 1.0 /100 | #252 | Tragic 52.8% |
| Nigerians | 0.9 /100 | #253 | Tragic 52.8% |
| Immigrants | Malaysia | 0.8 /100 | #254 | Tragic 52.7% |
Demographics Similar to Palestinians by 2 or more Vehicles in Household
In terms of 2 or more vehicles in household, the demographic groups most similar to Palestinians are Cajun (57.7%, a difference of 0.070%), Fijian (57.6%, a difference of 0.14%), Slavic (57.8%, a difference of 0.15%), Burmese (57.8%, a difference of 0.17%), and Lebanese (57.6%, a difference of 0.19%).
| Demographics | Rating | Rank | 2 or more Vehicles in Household |
| Pakistanis | 99.0 /100 | #91 | Exceptional 57.9% |
| Shoshone | 99.0 /100 | #92 | Exceptional 57.9% |
| Ottawa | 99.0 /100 | #93 | Exceptional 57.9% |
| Filipinos | 98.9 /100 | #94 | Exceptional 57.8% |
| Hmong | 98.9 /100 | #95 | Exceptional 57.8% |
| Burmese | 98.8 /100 | #96 | Exceptional 57.8% |
| Slavs | 98.8 /100 | #97 | Exceptional 57.8% |
| Palestinians | 98.6 /100 | #98 | Exceptional 57.7% |
| Cajuns | 98.5 /100 | #99 | Exceptional 57.7% |
| Fijians | 98.4 /100 | #100 | Exceptional 57.6% |
| Lebanese | 98.3 /100 | #101 | Exceptional 57.6% |
| Immigrants | Bolivia | 98.2 /100 | #102 | Exceptional 57.6% |
| Jordanians | 98.2 /100 | #103 | Exceptional 57.6% |
| Immigrants | Indonesia | 98.2 /100 | #104 | Exceptional 57.6% |
| Immigrants | Korea | 98.2 /100 | #105 | Exceptional 57.6% |